Burchwood neighborhood in Plant City, Florida (FL), 33567 detailed profile
Settings
X

Business Search - 14 Million verified businesses
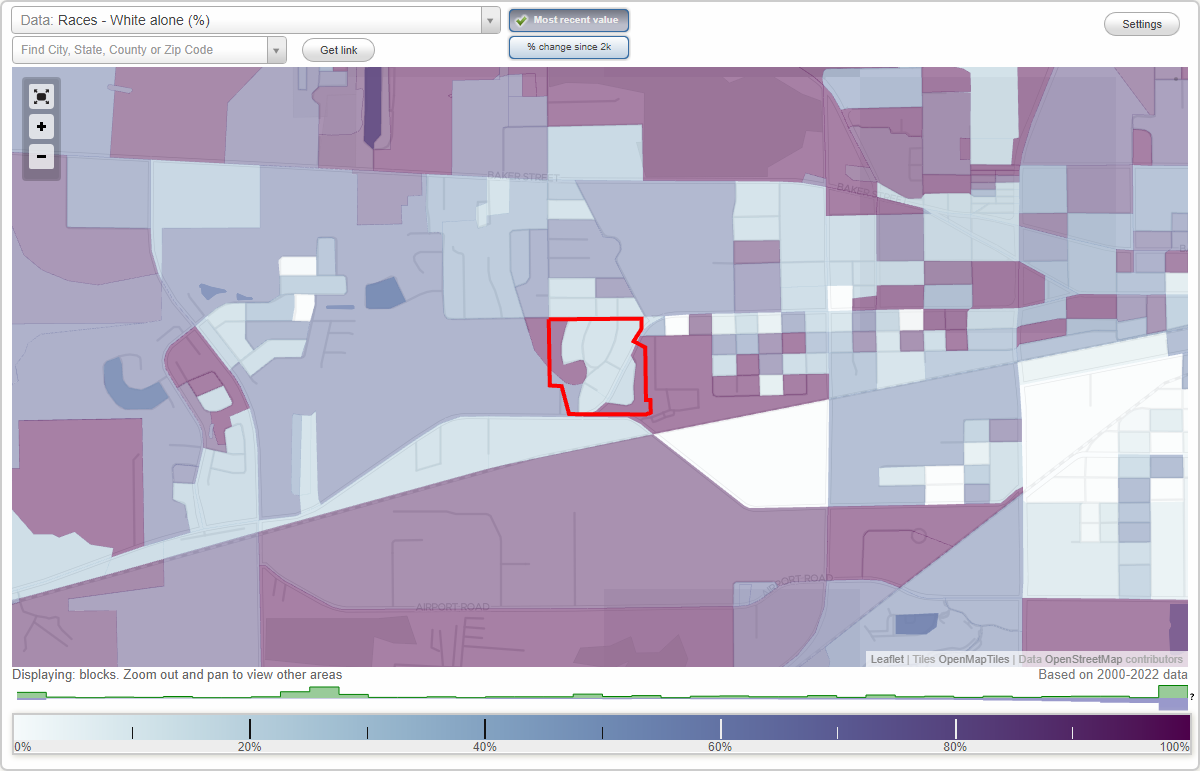
Area: 0.059 square miles
Population: 135
Population density:
| Burchwood: | 2,290 people per square mile |
| Plant City: | 1,752 people per square mile |

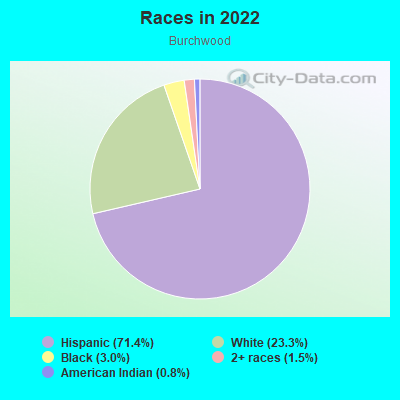
- 9571.4%Hispanic or Latino
- 3123.3%White
- 43.0%Black
- 21.5%Two or more races
- 10.8%American Indian
Median household income in 2022:
| Burchwood: | $89,305 |
| Plant City: | $62,015 |
Distribution of median household income
![Distribution of median household income]()
- 5Less than $10,000
- 7$10,000 to $19,999
- 5$20,000 to $29,999
- 8$30,000 to $39,999
- 4$40,000 to $49,999
- 3$50,000 to $59,999
- 1$60,000 to $74,999
- 10$75,000 to $99,999
- 9$100,000 to $124,999
- 10$125,000 to $149,999
- 10$150,000 to $199,999

Distribution of owner-occupied house/condo value
![Distribution of owner-occupied house/condo value]()
- 14Less than $50,000
- 10$50,000 to $99,999
- 5$100,000 to $149,999
- 4$150,000 to $199,999
- 4$200,000 to $249,999
- 6$250,000 to $299,999
- 2$300,000 to $399,999
- 1$1,000,000 or more

Distribution of rent paid by renters
![Distribution of rent paid by renters]()
- 2$500 to $599
- 4$600 to $699
- 4$700 to $799
- 6$800 to $899
- 3$900 to $999
- 2$1,000 to $1,249
- 10$1,500 to $1,999
- 3$2,000 or more

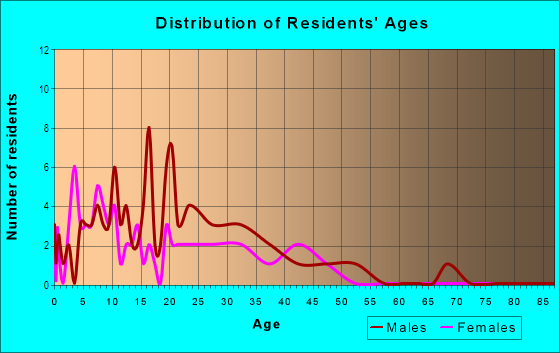
| Males: | 67 |
| Females: | 67 |
Males:
| This neighborhood: | 35.9 years |
| Whole city: | 36.5 years |
| This neighborhood: | 40.5 years |
| Whole city: | 39.4 years |
Average household size:
| Burchwood: | 3.4 people |
| Plant City: | 2.7 people |
Percentage of family households:
| Burchwood: | 66.0% |
| Plant City: | 49.7% |
| Here: | 57.4% |
| Plant City: | 45.0% |
Percentage of married-couple families with children (among all households):
| Burchwood: | 11.9% |
| Plant City: | 22.6% |
Percentage of single-mother households (among all households):
| Burchwood: | 7.9% |
| Plant City: | 9.4% |
Percentage of never married males 15 years old and over:
Percentage of never married females 15 years old and over:
| Burchwood: | 17.9% |
| Plant City: | 17.9% |
Percentage of never married females 15 years old and over:
| Burchwood: | 27.0% |
| city: | 16.8% |
Percentage of people that speak English not well or not at all:
| Burchwood: | 9.2% |
| Plant City: | 6.5% |
Percentage of people born in this state:
Percentage of people born in another U.S. state:
Percentage of native residents but born outside the U.S.:
Percentage of foreign born residents:
| Here: | 53.5% |
| Plant City: | 52.8% |
Percentage of people born in another U.S. state:
| Burchwood: | 16.1% |
| Plant City: | 27.7% |
Percentage of native residents but born outside the U.S.:
| Here: | 4.7% |
| city: | 4.6% |
Percentage of foreign born residents:
| Here: | 25.7% |
| Plant City: | 14.9% |
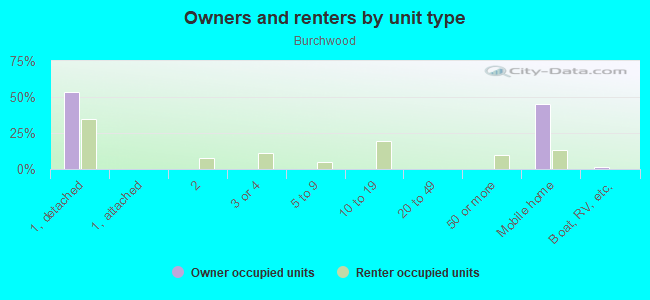
Owner-occupied
Renter-occupied

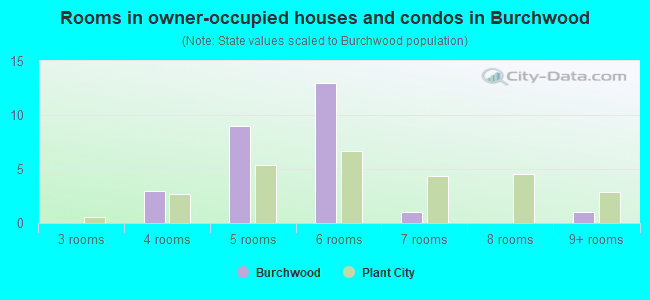
- Rooms in owner-occupied houses and condos in Burchwood
- 01 room
- 02 rooms
- 03 rooms
- 34 rooms
- 95 rooms
- 136 rooms
- 17 rooms
- 08 rooms
- 19+ rooms
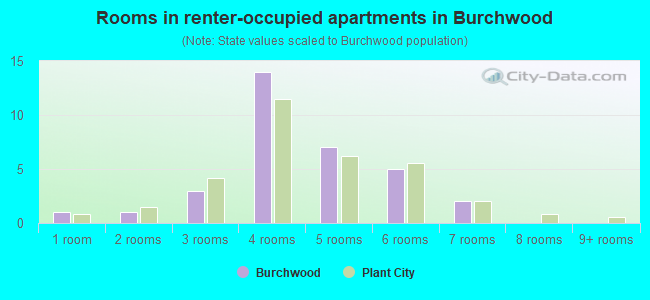
- Rooms in renter-occupied apartments in Burchwood
- 11 room
- 12 rooms
- 33 rooms
- 144 rooms
- 75 rooms
- 56 rooms
- 27 rooms
- 08 rooms
- 09+ rooms
Owner-occupied
Renter-occupied
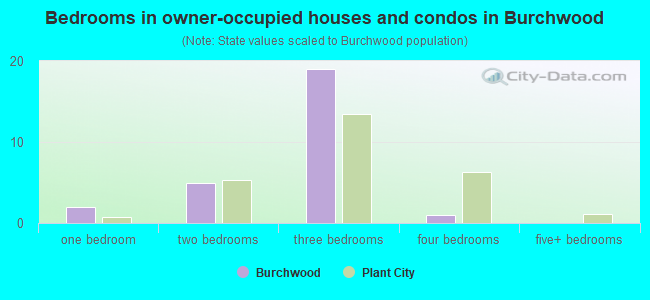
- Bedrooms in owner-occupied houses and condos in Burchwood
- 0no bedroom
- 21 bedroom
- 52 bedrooms
- 193 bedrooms
- 14 bedrooms
- 05+ bedrooms
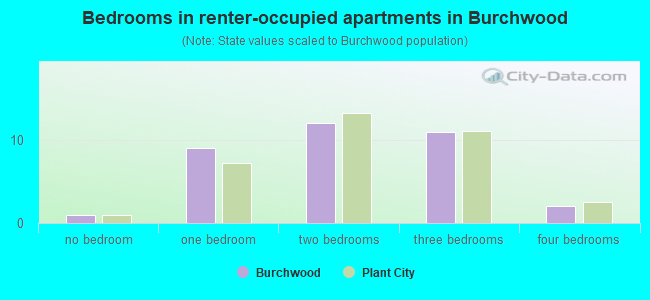
- Bedrooms in renter-occupied apartments in Burchwood
- 1no bedroom
- 91 bedroom
- 122 bedrooms
- 113 bedrooms
- 24 bedrooms
- 05+ bedrooms
Average number of cars or other vehicles available in houses/condos:
Average number of cars or other vehicles available in apartments:
| This neighborhood: | 3.2 |
| Plant City: | 2.0 |
Average number of cars or other vehicles available in apartments:
| Here: | 2.4 |
| city: | 1.4 |
Percentage of units with a mortgage:
| Burchwood: | 31.8% |
| Plant City: | 61.6% |
Average estimated value of detached houses in 2022 (74.4% of all units):
| Burchwood: | $195,011 |
| Florida: | $500,941 |
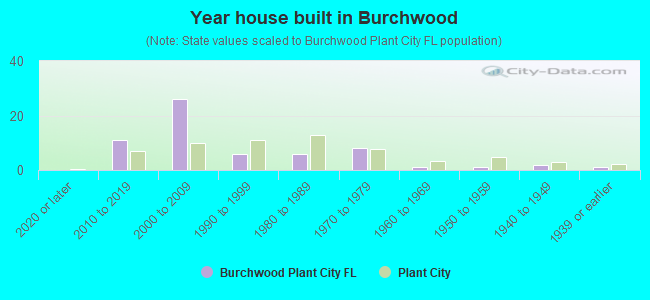
- Year house built in Burchwood
- 02020 or later
- 112010 to 2019
- 262000 to 2009
- 61990 to 1999
- 61980 to 1989
- 81970 to 1979
- 11960 to 1969
- 11950 to 1959
- 21940 to 1949
- 11939 or earlier
City-data.com crime index for city in 2020 (higher means more crime):
| City: | 235.5 |
| U.S. average: | 219.5 |
Travel time to work (commute)
![Travel time to work (commute)]()
- 2Less than 5 minutes
- 75 to 9 minutes
- 1910 to 14 minutes
- 1215 to 19 minutes
- 1020 to 24 minutes
- 125 to 29 minutes
- 1430 to 34 minutes
- 235 to 39 minutes
- 240 to 44 minutes
- 1760 to 89 minutes
- 190 or more minutes

Means of transportation to work
![Means of transportation to work]()
- 85.3%68Drove a car alone
- 11.3%9Carpooled
- 2.5%2Other means
- 5.0%4Worked at home

Time leaving home to go to work
![Time leaving home to go to work]()
- 712:00 a.m. to 4:59 a.m.
- 25:00 a.m. to 5:29 a.m.
- 135:30 a.m. to 5:59 a.m.
- 266:00 a.m. to 6:29 a.m.
- 36:30 a.m. to 6:59 a.m.
- 77:00 a.m. to 7:29 a.m.
- 107:30 a.m. to 7:59 a.m.
- 78:00 a.m. to 8:29 a.m.
- 38:30 a.m. to 8:59 a.m.
- 412:00 p.m. to 3:59 p.m.
- 54:00 p.m. to 11:59 p.m.

Occupations of males:
- Percentage of males in architecture and engineering occupations:
Here: 7.2% city: 2.6%
- Percentage of males in education, training, and library occupations:
Here: 1.7% city: 1.8%
- Percentage of males in arts, design, entertainment, sports, and media occupations:
Here: 3.6% city: 2.2%
- Percentage of males in service occupations:
Here: 5.9% city: 14.0%
- Percentage of males in sales and office occupations:
Here: 20.2% city: 16.0%
- Percentage of males in farming, fishing, and forestry occupations:
Here: 6.0% city: 2.6%
- Percentage of males in construction, extraction, and maintenance occupations:
Here: 30.8% city: 16.9%
- Percentage of males in production occupations:
Here: 7.5% city: 6.7%
- Percentage of males in transportation occupations:
Here: 5.7% city: 7.1%
- Percentage of males in material moving occupations:
Here: 4.2% city: 5.5%
Occupations of females:
- Percentage of females in management occupations (except farmers):
Here: 7.5% city: 9.6%
- Percentage of females in business and financial operations occupations:
Here: 3.8% city: 5.6%
- Percentage of females in architecture and engineering occupations:
Here: 4.8% city: 0.8%
- Percentage of females in education, training, and library occupations:
Here: 11.1% city: 9.5%
- Percentage of females in healthcare practitioners and technical occupations:
Here: 8.3% city: 8.4%
- Percentage of females in service occupations:
Here: 21.2% city: 20.2%
- Percentage of females in sales and office occupations:
Here: 31.3% city: 33.1%
- Percentage of females in farming, fishing, and forestry occupations:
Here: 2.7% city: 0.4%
- Percentage of females in construction, extraction, and maintenance occupations:
Here: 6.4% city: 0.8%
- Percentage of females in production occupations:
Here: 8.0% city: 3.4%
- Percentage of females in material moving occupations:
Here: 1.5% city: 2.8%
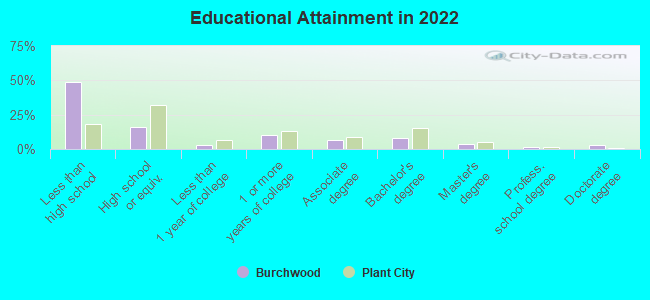
Education in this neighborhood (subdivision or community):
- Percentage of people 3 years and older in K-12 schools:
Burchwood: 17.8% Plant City: 19.1%
- Percentage of people 3 years and older in undergraduate colleges:
Burchwood: 3.0% Plant City: 3.7%
- Percentage of people 3 years and older in grad. or professional schools:
Burchwood: 0.7% Plant City: 1.0%
- Percentage of students K-12 enrolled in private schools:
Burchwood: 8.3% Plant City: 9.7%
Percentage of population below poverty level:
| Burchwood: | 20.7% |
| Plant City: | 15.4% |
Median year owner moved in (as recorded in 2022):
| Burchwood: | 2002 |
| Plant City: | 2010 |
Percentage of married-couple families with both working:
| Burchwood: | 51.3% |
| Plant City: | 65.1% |
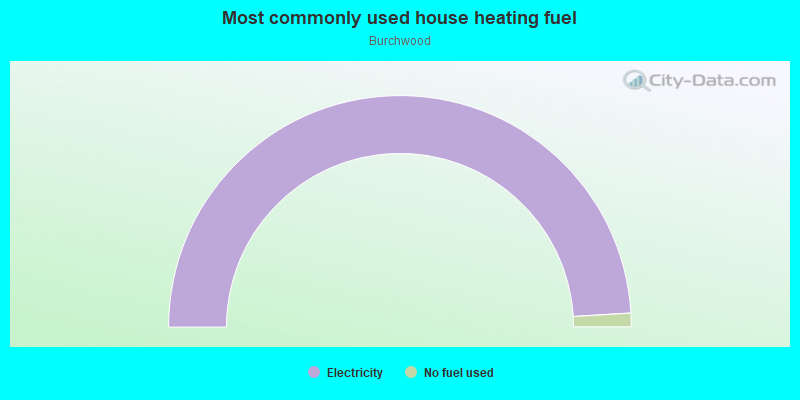
- 98.1%Electricity
- 1.9%No fuel used
Highways in this neighborhood:
State Hwy 574 (Reynolds St)
Length: 0.20 miles
Direction: SW-NE
Address range: 3105 to 3124
Direction: SW-NE
Address range: 3105 to 3124
Roads and streets:
Euclid Dr
Length: 0.21 miles
Directions: E-W, N-S, SE-NW, SW-NE
Address range: 2 to 99
Directions: E-W, N-S, SE-NW, SW-NE
Address range: 2 to 99
Drake St
Length: 0.07 miles
Direction: SW-NE
Direction: SW-NE
Lake Blvd
Length: 0.07 miles
Directions: N-S, SE-NW, SW-NE
Address range: 18 to 99
Directions: N-S, SE-NW, SW-NE
Address range: 18 to 99
Lake Ave
Length: 0.06 miles
Direction: E-W
Direction: E-W
E Lake Ave
Length: 0.06 miles
Direction: SE-NW
Direction: SE-NW
Geneva Cir
Length: 0.05 miles
Directions: E-W, SE-NW
Address range: 3200 to 3298
Directions: E-W, SE-NW
Address range: 3200 to 3298