Colonial Village neighborhood in Durham, North Carolina (NC), 27704 detailed profile
Settings
X

Business Search - 14 Million verified businesses
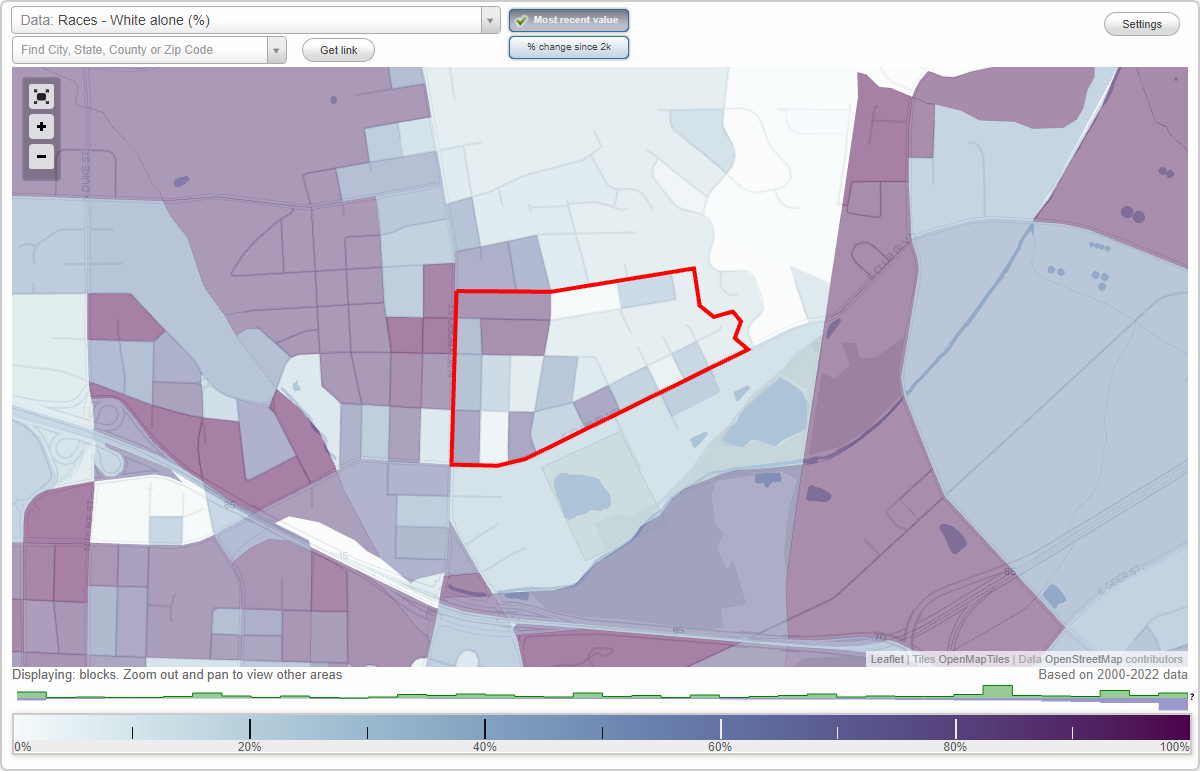
Area: 0.217 square miles
Population: 729
Population density:
| Colonial Village: | 3,364 people per square mile |
| Durham: | 3,084 people per square mile |

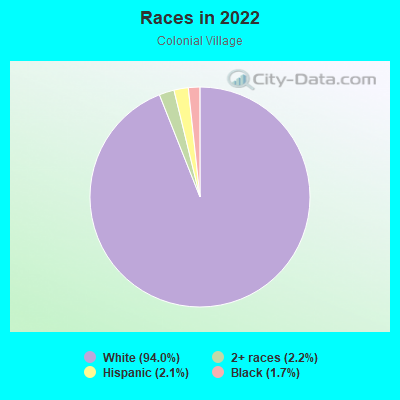
- 43859.8%Black
- 18725.5%White
- 8010.9%Hispanic or Latino
- 182.5%Two or more races
- 60.8%Asian
- 30.4%American Indian
Median household income in 2022:
| Colonial Village: | $74,652 |
| Durham: | $78,105 |
Distribution of median household income
![Distribution of median household income]()
- 23Less than $10,000
- 27$10,000 to $19,999
- 10$20,000 to $29,999
- 12$30,000 to $39,999
- 30$40,000 to $49,999
- 15$50,000 to $59,999
- 20$60,000 to $74,999
- 37$75,000 to $99,999
- 28$100,000 to $124,999
- 23$125,000 to $149,999
- 26$150,000 to $199,999
- 22$200,000 or more

Distribution of owner-occupied house/condo value
![Distribution of owner-occupied house/condo value]()
- 12Less than $50,000
- 20$50,000 to $99,999
- 15$100,000 to $149,999
- 47$150,000 to $199,999
- 52$200,000 to $249,999
- 25$250,000 to $299,999
- 31$300,000 to $399,999
- 7$400,000 to $499,999
- 5$500,000 to $749,999

Distribution of rent paid by renters
![Distribution of rent paid by renters]()
- 15Less than $100
- 2$200 to $299
- 8$500 to $599
- 10$600 to $699
- 7$800 to $899
- 15$900 to $999
- 16$1,000 to $1,249
- 14$1,250 to $1,499
- 9$1,500 to $1,999
- 5$2,000 or more

Median rent in 2022:
| Colonial Village: | $1,005 |
| Durham: | $1,246 |
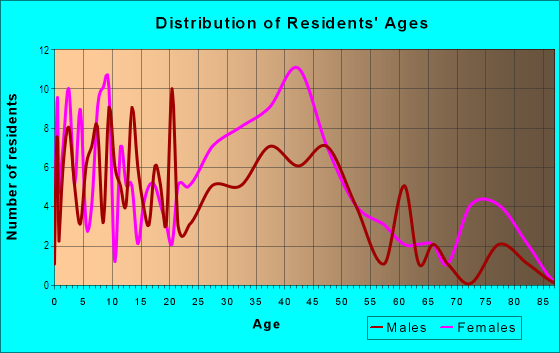
| Males: | 340 |
| Females: | 389 |
Males:
| This neighborhood: | 35.4 years |
| Whole city: | 34.3 years |
| This neighborhood: | 34.7 years |
| Whole city: | 35.8 years |
Average household size:
| Colonial Village: | 20.6 people |
| Durham: | 2.3 people |
Percentage of family households:
| Colonial Village: | 52.5% |
| Durham: | 41.2% |
| Here: | 45.8% |
| Durham: | 36.4% |
Percentage of married-couple families with children (among all households):
| Colonial Village: | 14.1% |
| Durham: | 27.1% |
Percentage of single-mother households (among all households):
| Colonial Village: | 20.2% |
| Durham: | 12.7% |
Percentage of never married males 15 years old and over:
Percentage of never married females 15 years old and over:
| Colonial Village: | 22.0% |
| Durham: | 20.9% |
Percentage of never married females 15 years old and over:
| Colonial Village: | 27.0% |
| city: | 23.2% |
Percentage of people that speak English not well or not at all:
| Colonial Village: | 2.5% |
| Durham: | 4.9% |
Percentage of people born in this state:
Percentage of people born in another U.S. state:
Percentage of native residents but born outside the U.S.:
Percentage of foreign born residents:
| Here: | 61.1% |
| Durham: | 45.4% |
Percentage of people born in another U.S. state:
| Colonial Village: | 33.0% |
| Durham: | 38.2% |
Percentage of native residents but born outside the U.S.:
| Here: | 0.4% |
| city: | 1.6% |
Percentage of foreign born residents:
| Here: | 5.6% |
| Durham: | 14.8% |
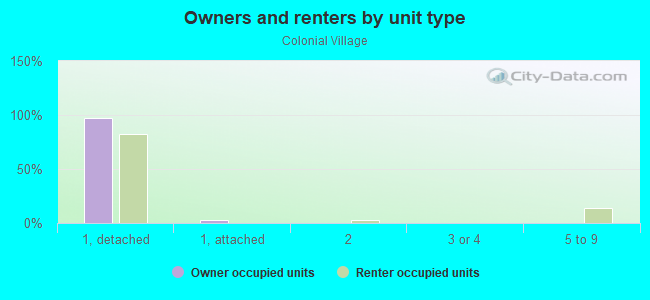
Owner-occupied
Renter-occupied

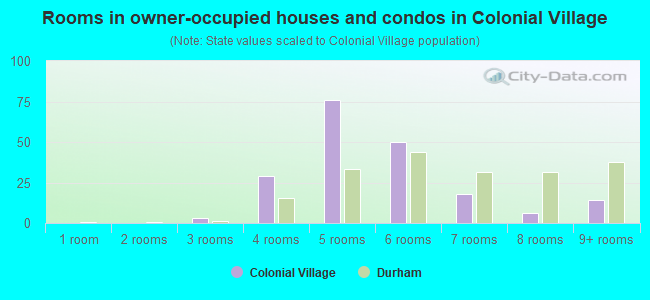
- Rooms in owner-occupied houses and condos in Colonial Village
- 01 room
- 02 rooms
- 33 rooms
- 294 rooms
- 765 rooms
- 506 rooms
- 187 rooms
- 68 rooms
- 149+ rooms
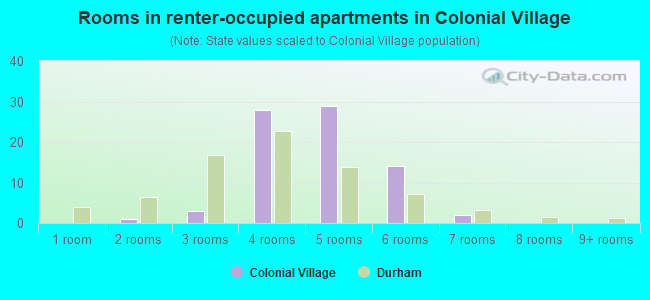
- Rooms in renter-occupied apartments in Colonial Village
- 01 room
- 12 rooms
- 33 rooms
- 284 rooms
- 295 rooms
- 146 rooms
- 27 rooms
- 08 rooms
- 09+ rooms
Owner-occupied
Renter-occupied
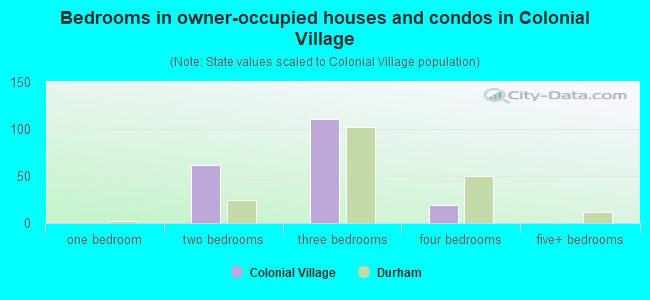
- Bedrooms in owner-occupied houses and condos in Colonial Village
- 0no bedroom
- 01 bedroom
- 622 bedrooms
- 1113 bedrooms
- 194 bedrooms
- 05+ bedrooms
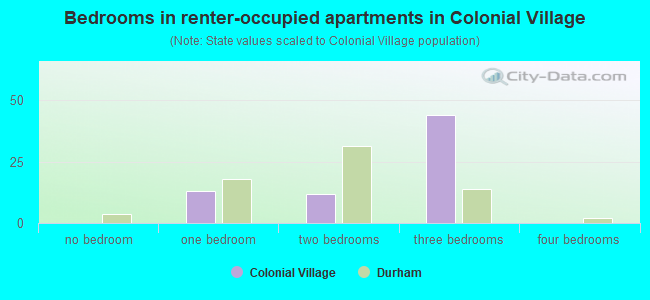
- Bedrooms in renter-occupied apartments in Colonial Village
- 0no bedroom
- 131 bedroom
- 122 bedrooms
- 443 bedrooms
- 04 bedrooms
- 05+ bedrooms
Average number of cars or other vehicles available in houses/condos:
Average number of cars or other vehicles available in apartments:
| This neighborhood: | 2.0 |
| Durham: | 1.9 |
Average number of cars or other vehicles available in apartments:
| Here: | 1.1 |
| city: | 1.3 |
Percentage of units with a mortgage:
| Colonial Village: | 76.3% |
| Durham: | 74.8% |
Average estimated value of detached houses in 2022 (95.8% of all units):
| Colonial Village: | $270,037 |
| Durham: | $359,544 |
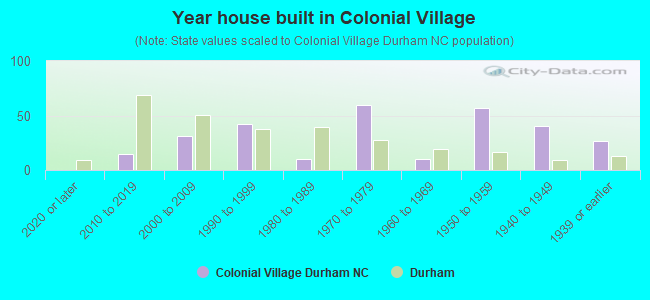
- Year house built in Colonial Village
- 02020 or later
- 152010 to 2019
- 312000 to 2009
- 421990 to 1999
- 101980 to 1989
- 601970 to 1979
- 101960 to 1969
- 571950 to 1959
- 401940 to 1949
- 271939 or earlier
City-data.com crime index for city in 2020 (higher means more crime):
| City: | 425.9 |
| U.S. average: | 219.5 |
Travel time to work (commute)
![Travel time to work (commute)]()
- 235 to 9 minutes
- 8410 to 14 minutes
- 12515 to 19 minutes
- 3920 to 24 minutes
- 1325 to 29 minutes
- 2430 to 34 minutes
- 335 to 39 minutes
- 840 to 44 minutes
- 1345 to 59 minutes
- 1060 to 89 minutes
- 590 or more minutes

Means of transportation to work
![Means of transportation to work]()
- 73.6%313Drove a car alone
- 9.6%41Carpooled
- 4.0%17Bus
- 0.5%2Motorcycle
- 1.6%7Bicycle
- 1.9%8Walked
- 10.6%45Worked at home

Time leaving home to go to work
![Time leaving home to go to work]()
- 1212:00 a.m. to 4:59 a.m.
- 175:30 a.m. to 5:59 a.m.
- 336:00 a.m. to 6:29 a.m.
- 56:30 a.m. to 6:59 a.m.
- 637:00 a.m. to 7:29 a.m.
- 657:30 a.m. to 7:59 a.m.
- 538:00 a.m. to 8:29 a.m.
- 168:30 a.m. to 8:59 a.m.
- 189:00 a.m. to 9:59 a.m.
- 1210:00 a.m. to 10:59 a.m.
- 511:00 a.m. to 11:59 a.m.
- 2012:00 p.m. to 3:59 p.m.
- 234:00 p.m. to 11:59 p.m.

Occupations of males:
- Percentage of males in management occupations (except farmers):
Here: 11.2% city: 13.6%
- Percentage of males in computer and mathematical occupations:
Here: 4.2% city: 9.2%
- Percentage of males in architecture and engineering occupations:
Here: 2.4% city: 2.7%
- Percentage of males in community and social services occupations:
Here: 1.9% city: 1.3%
- Percentage of males in education, training, and library occupations:
Here: 5.8% city: 6.0%
- Percentage of males in arts, design, entertainment, sports, and media occupations:
Here: 1.3% city: 2.2%
- Percentage of males in healthcare practitioners and technical occupations:
Here: 2.4% city: 5.3%
- Percentage of males in service occupations:
Here: 5.9% city: 13.7%
- Percentage of males in sales and office occupations:
Here: 11.8% city: 12.9%
- Percentage of males in construction, extraction, and maintenance occupations:
Here: 18.7% city: 8.8%
- Percentage of males in transportation occupations:
Here: 8.4% city: 3.3%
- Percentage of males in material moving occupations:
Here: 22.1% city: 4.1%
Occupations of females:
- Percentage of females in management occupations (except farmers):
Here: 3.0% city: 11.0%
- Percentage of females in business and financial operations occupations:
Here: 2.0% city: 8.1%
- Percentage of females in computer and mathematical occupations:
Here: 2.6% city: 2.8%
- Percentage of females in architecture and engineering occupations:
Here: 1.1% city: 0.8%
- Percentage of females in life, physical, and social science occupations:
Here: 3.8% city: 4.4%
- Percentage of females in community and social services occupations:
Here: 3.4% city: 3.3%
- Percentage of females in education, training, and library occupations:
Here: 11.8% city: 11.8%
- Percentage of females in arts, design, entertainment, sports, and media occupations:
Here: 1.2% city: 2.1%
- Percentage of females in healthcare practitioners and technical occupations:
Here: 10.5% city: 13.6%
- Percentage of females in service occupations:
Here: 22.8% city: 16.8%
- Percentage of females in sales and office occupations:
Here: 24.0% city: 19.6%
- Percentage of females in construction, extraction, and maintenance occupations:
Here: 6.0% city: 0.3%
- Percentage of females in transportation occupations:
Here: 6.3% city: 0.6%
- Percentage of females in material moving occupations:
Here: 1.1% city: 1.3%
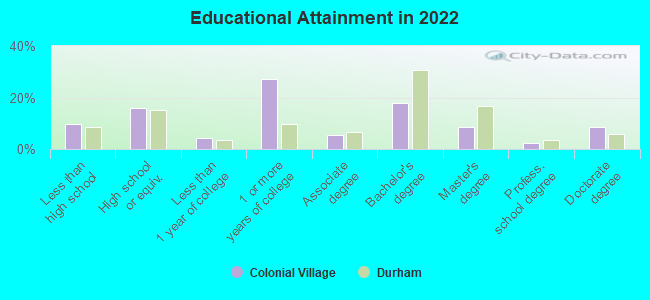
Education in this neighborhood (subdivision or community):
- Percentage of people 3 years and older in K-12 schools:
Colonial Village: 11.0% Durham: 14.4%
- Percentage of people 3 years and older in undergraduate colleges:
Colonial Village: 3.7% Durham: 5.8%
- Percentage of people 3 years and older in grad. or professional schools:
Colonial Village: 2.7% Durham: 4.6%
- Percentage of students K-12 enrolled in private schools:
Colonial Village: 0.0% Durham: 16.9%
Percentage of population below poverty level:
| Colonial Village: | 16.5% |
| Durham: | 11.2% |
Median year owner moved in (as recorded in 2022):
Median year renter moved in (as recorded in 2022):
| Colonial Village: | 2008 |
| Durham: | 2013 |
Median year renter moved in (as recorded in 2022):
| Colonial Village: | 2019 |
| Durham: | 2020 |
Percentage of married-couple families with both working:
| Colonial Village: | 64.4% |
| Durham: | 68.9% |
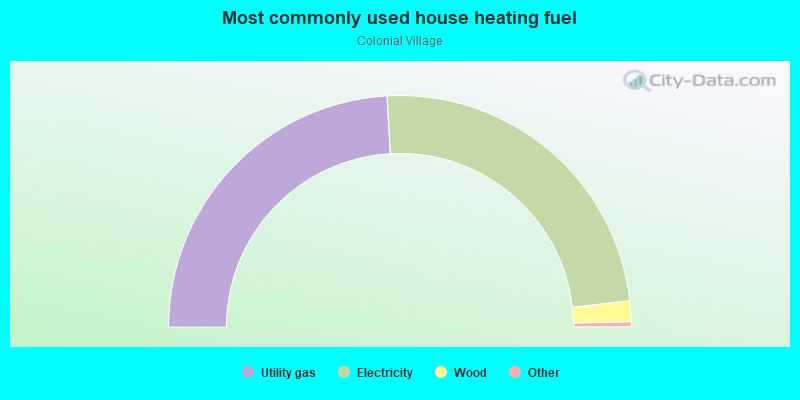
- 48.3%Utility gas
- 48.2%Electricity
- 2.9%Wood
Roads and streets:
E Ellerbee St
Length: 0.74 miles
Direction: E-W
Address range: 400 to 1199
Direction: E-W
Address range: 400 to 1199
E Club Blvd
Length: 0.72 miles
Directions: E-W, SW-NE
Address range: 301 to 1098
Directions: E-W, SW-NE
Address range: 301 to 1098
E Hammond St
Length: 0.58 miles
Direction: E-W
Address range: 400 to 799
Direction: E-W
Address range: 400 to 799
Banner St
Length: 0.35 miles
Direction: N-S
Address range: 2400 to 2699
Direction: N-S
Address range: 2400 to 2699
Cascadilla St
Length: 0.33 miles
Directions: N-S, SE-NW
Address range: 2400 to 2707
Directions: N-S, SE-NW
Address range: 2400 to 2707
E Lavender Ave
Length: 0.33 miles
Direction: E-W
Address range: 400 to 705
Direction: E-W
Address range: 400 to 705
State St
Length: 0.26 miles
Direction: N-S
Address range: 2400 to 2599
Direction: N-S
Address range: 2400 to 2599
Dominion St
Length: 0.20 miles
Directions: N-S, SE-NW
Address range: 2400 to 2699
Directions: N-S, SE-NW
Address range: 2400 to 2699
Thorne St
Length: 0.19 miles
Directions: N-S, SE-NW
Address range: 2400 to 2599
Directions: N-S, SE-NW
Address range: 2400 to 2599
Stephenson St
Length: 0.16 miles
Directions: E-W, SE-NW
Address range: 2400 to 2599
Directions: E-W, SE-NW
Address range: 2400 to 2599
Lindbergh St
Length: 0.11 miles
Direction: SE-NW
Address range: 2400 to 2599
Direction: SE-NW
Address range: 2400 to 2599
Drexall Ave
Length: 0.07 miles
Direction: SE-NW
Address range: 2400 to 2499
Direction: SE-NW
Address range: 2400 to 2499