Harwood neighborhood in Baltimore, Maryland (MD), 21218 detailed profile
Settings
X

Business Search - 14 Million verified businesses
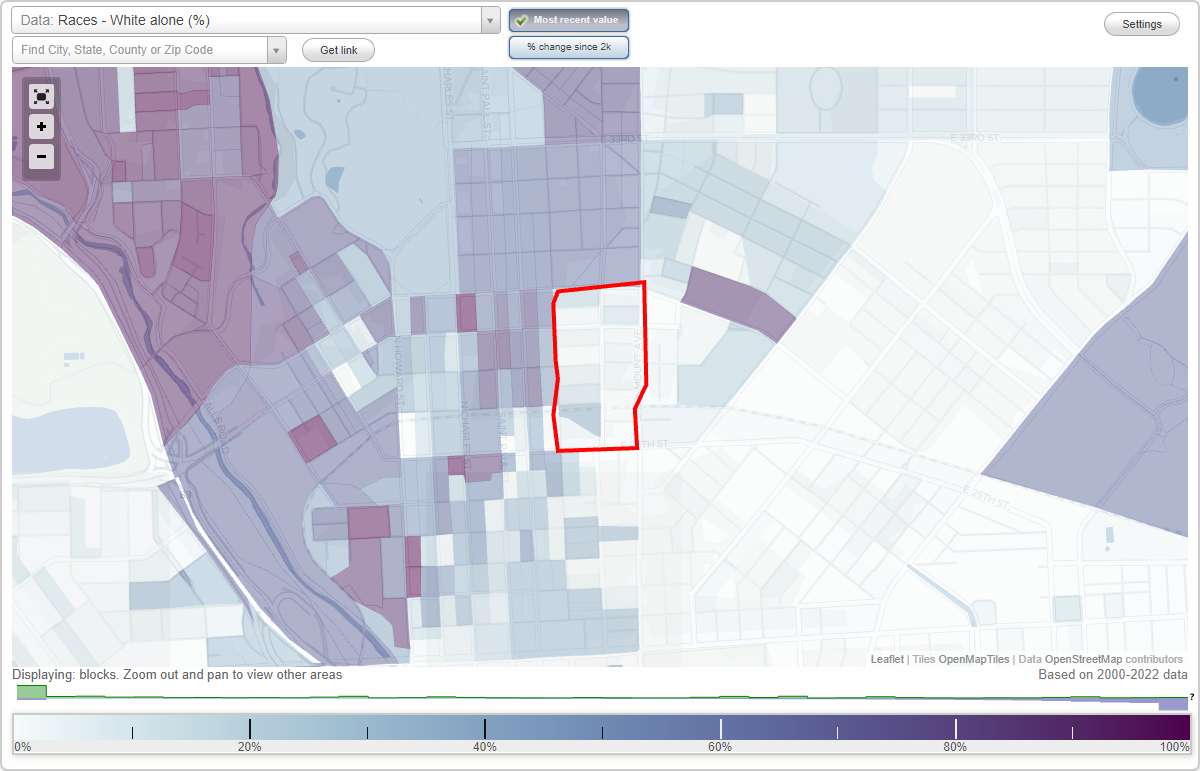
Area: 0.074 square miles
Population: 1,946
Population density:
| Harwood: | 26,169 people per square mile |
| Baltimore: | 7,053 people per square mile |

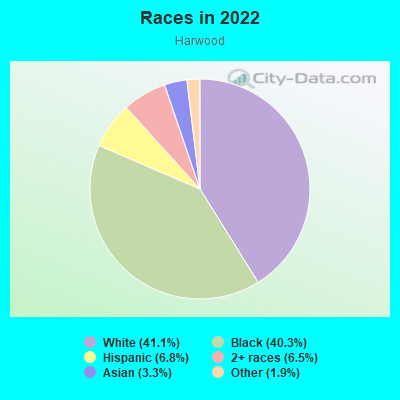
- 82541.1%White
- 80840.3%Black
- 1366.8%Hispanic or Latino
- 1316.5%Two or more races
- 673.3%Asian
- 381.9%Some other race
Distribution of median household income
![Distribution of median household income]()
- 48Less than $10,000
- 169$10,000 to $19,999
- 70$20,000 to $29,999
- 124$30,000 to $39,999
- 135$40,000 to $49,999
- 100$50,000 to $59,999
- 49$60,000 to $74,999
- 68$75,000 to $99,999
- 98$100,000 to $124,999
- 41$125,000 to $149,999
- 100$150,000 to $199,999
- 88$200,000 or more

Distribution of owner-occupied house/condo value
![Distribution of owner-occupied house/condo value]()
- 49Less than $50,000
- 116$50,000 to $99,999
- 66$100,000 to $149,999
- 137$150,000 to $199,999
- 49$200,000 to $249,999
- 74$250,000 to $299,999
- 101$300,000 to $399,999
- 32$400,000 to $499,999
- 33$500,000 to $749,999

Distribution of rent paid by renters
![Distribution of rent paid by renters]()
- 40$100 to $199
- 32$200 to $299
- 91$300 to $399
- 53$400 to $499
- 26$500 to $599
- 181$600 to $699
- 87$700 to $799
- 55$800 to $899
- 66$900 to $999
- 129$1,000 to $1,249
- 93$1,250 to $1,499
- 108$1,500 to $1,999
- 11$2,000 or more

Median rent in 2022:
| Harwood: | $1,025 |
| Baltimore: | $1,043 |
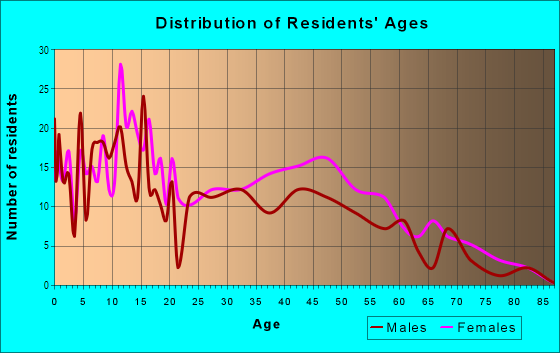
| Males: | 1,125 |
| Females: | 821 |
Males:
| This neighborhood: | 34.4 years |
| Whole city: | 35.0 years |
| This neighborhood: | 37.7 years |
| Whole city: | 38.2 years |
Average household size:
| Harwood: | 2.3 people |
| Baltimore: | 2.2 people |
Percentage of family households:
| Harwood: | 38.3% |
| Baltimore: | 34.2% |
| Here: | 26.7% |
| Baltimore: | 23.3% |
Percentage of married-couple families with children (among all households):
| Harwood: | 21.7% |
| Baltimore: | 22.4% |
Percentage of single-mother households (among all households):
| Harwood: | 21.1% |
| Baltimore: | 18.7% |
Percentage of never married males 15 years old and over:
Percentage of never married females 15 years old and over:
| Harwood: | 32.1% |
| Baltimore: | 25.1% |
Percentage of never married females 15 years old and over:
| Harwood: | 23.7% |
| city: | 27.5% |
Percentage of people that speak English not well or not at all:
| Harwood: | 0.6% |
| Baltimore: | 2.3% |
Percentage of people born in this state:
Percentage of people born in another U.S. state:
Percentage of native residents but born outside the U.S.:
Percentage of foreign born residents:
| Here: | 63.5% |
| Baltimore: | 64.4% |
Percentage of people born in another U.S. state:
| Harwood: | 29.8% |
| Baltimore: | 25.0% |
Percentage of native residents but born outside the U.S.:
| Here: | 0.8% |
| city: | 0.9% |
Percentage of foreign born residents:
| Here: | 5.9% |
| Baltimore: | 9.7% |
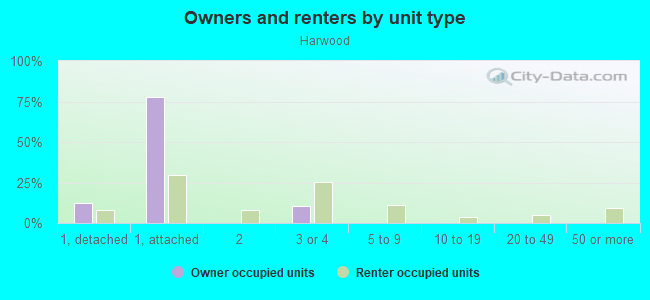
Owner-occupied
Renter-occupied

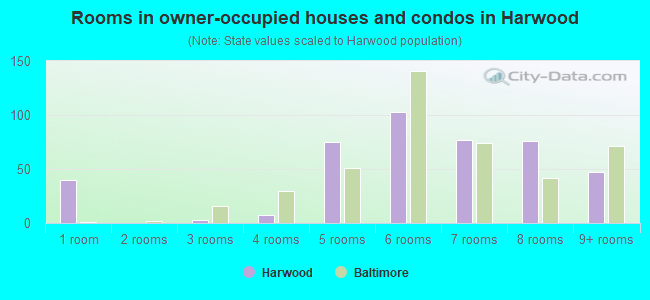
- Rooms in owner-occupied houses and condos in Harwood
- 401 room
- 02 rooms
- 33 rooms
- 74 rooms
- 755 rooms
- 1036 rooms
- 777 rooms
- 768 rooms
- 479+ rooms
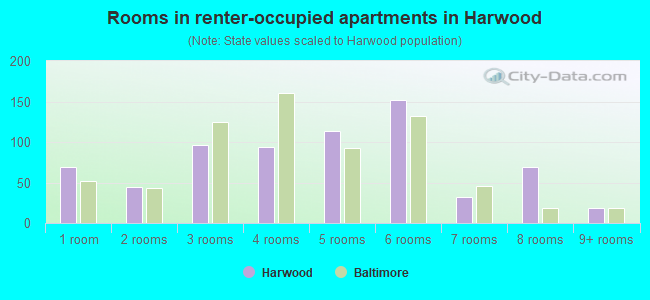
- Rooms in renter-occupied apartments in Harwood
- 691 room
- 452 rooms
- 963 rooms
- 944 rooms
- 1135 rooms
- 1526 rooms
- 327 rooms
- 698 rooms
- 199+ rooms
Owner-occupied
Renter-occupied
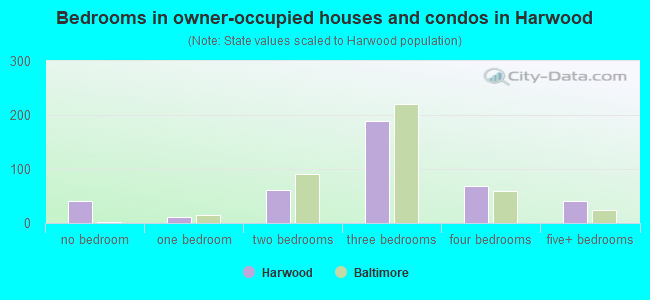
- Bedrooms in owner-occupied houses and condos in Harwood
- 40no bedroom
- 121 bedroom
- 622 bedrooms
- 1893 bedrooms
- 694 bedrooms
- 415+ bedrooms
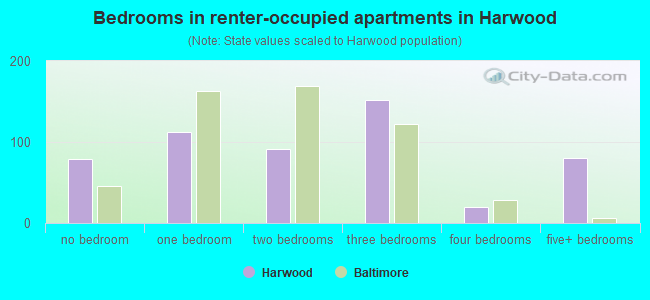
- Bedrooms in renter-occupied apartments in Harwood
- 79no bedroom
- 1121 bedroom
- 912 bedrooms
- 1523 bedrooms
- 204 bedrooms
- 805+ bedrooms
Average number of cars or other vehicles available in houses/condos:
Average number of cars or other vehicles available in apartments:
| This neighborhood: | 1.7 |
| Baltimore: | 1.5 |
Average number of cars or other vehicles available in apartments:
| Here: | 0.9 |
| city: | 0.8 |
Percentage of units with a mortgage:
| Harwood: | 83.7% |
| Baltimore: | 64.3% |
Average estimated value of townhouses or other attached units in 2022 (63.0% of all units):
| This neighborhood: | $272,063 |
| city: | $206,258 |
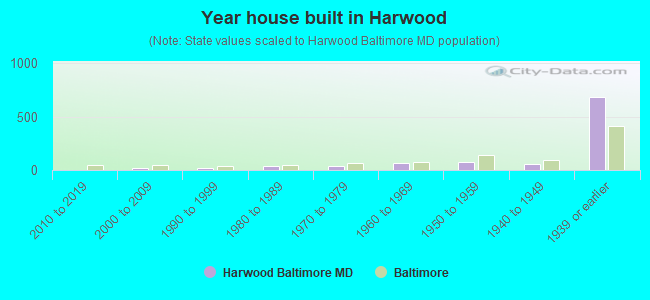
- Year house built in Harwood
- 02020 or later
- 02010 to 2019
- 162000 to 2009
- 171990 to 1999
- 341980 to 1989
- 341970 to 1979
- 661960 to 1969
- 781950 to 1959
- 581940 to 1949
- 6801939 or earlier
Travel time to work (commute)
![Travel time to work (commute)]()
- 1625 to 9 minutes
- 7710 to 14 minutes
- 13315 to 19 minutes
- 17820 to 24 minutes
- 425 to 29 minutes
- 10530 to 34 minutes
- 5135 to 39 minutes
- 2040 to 44 minutes
- 9945 to 59 minutes
- 8360 to 89 minutes
- 10090 or more minutes

Means of transportation to work
![Means of transportation to work]()
- 55.7%639Drove a car alone
- 7.2%83Carpooled
- 12.5%143Bus
- 3.3%38Subway or elevated rail
- 3.0%34Long-distance train or commuter rail
- 5.2%60Taxi
- 5.9%68Bicycle
- 6.9%79Walked
- 9.8%113Worked at home

Time leaving home to go to work
![Time leaving home to go to work]()
- 1212:00 a.m. to 4:59 a.m.
- 105:00 a.m. to 5:29 a.m.
- 435:30 a.m. to 5:59 a.m.
- 1046:00 a.m. to 6:29 a.m.
- 226:30 a.m. to 6:59 a.m.
- 297:00 a.m. to 7:29 a.m.
- 1497:30 a.m. to 7:59 a.m.
- 2348:00 a.m. to 8:29 a.m.
- 488:30 a.m. to 8:59 a.m.
- 1199:00 a.m. to 9:59 a.m.
- 1210:00 a.m. to 10:59 a.m.
- 8011:00 a.m. to 11:59 a.m.
- 10612:00 p.m. to 3:59 p.m.
- 154:00 p.m. to 11:59 p.m.

Occupations of males:
- Percentage of males in management occupations (except farmers):
Here: 18.0% city: 10.7%
- Percentage of males in business and financial operations occupations:
Here: 8.5% city: 5.9%
- Percentage of males in computer and mathematical occupations:
Here: 9.5% city: 6.1%
- Percentage of males in architecture and engineering occupations:
Here: 1.2% city: 2.9%
- Percentage of males in life, physical, and social science occupations:
Here: 9.1% city: 2.3%
- Percentage of males in education, training, and library occupations:
Here: 7.0% city: 5.4%
- Percentage of males in arts, design, entertainment, sports, and media occupations:
Here: 5.2% city: 2.8%
- Percentage of males in healthcare practitioners and technical occupations:
Here: 2.2% city: 4.0%
- Percentage of males in service occupations:
Here: 14.2% city: 14.7%
- Percentage of males in sales and office occupations:
Here: 9.0% city: 14.2%
- Percentage of males in construction, extraction, and maintenance occupations:
Here: 1.9% city: 5.6%
- Percentage of males in production occupations:
Here: 4.1% city: 4.2%
- Percentage of males in transportation occupations:
Here: 5.3% city: 6.8%
- Percentage of males in material moving occupations:
Here: 2.9% city: 7.0%
Occupations of females:
- Percentage of females in management occupations (except farmers):
Here: 4.7% city: 10.1%
- Percentage of females in business and financial operations occupations:
Here: 14.9% city: 6.6%
- Percentage of females in life, physical, and social science occupations:
Here: 5.4% city: 2.5%
- Percentage of females in community and social services occupations:
Here: 4.4% city: 3.6%
- Percentage of females in legal occupations:
Here: 1.8% city: 1.8%
- Percentage of females in education, training, and library occupations:
Here: 9.8% city: 10.7%
- Percentage of females in arts, design, entertainment, sports, and media occupations:
Here: 6.7% city: 2.4%
- Percentage of females in healthcare practitioners and technical occupations:
Here: 6.8% city: 9.8%
- Percentage of females in service occupations:
Here: 12.3% city: 20.4%
- Percentage of females in sales and office occupations:
Here: 26.7% city: 22.3%
- Percentage of females in production occupations:
Here: 6.5% city: 2.3%
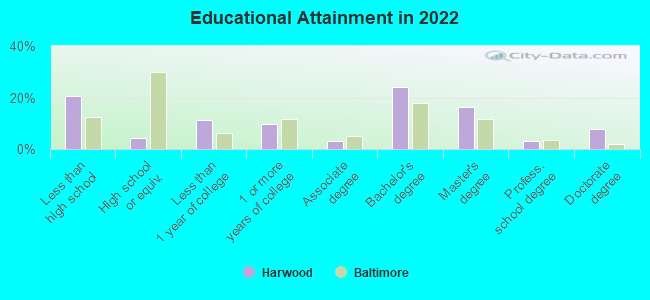
Education in this neighborhood (subdivision or community):
- Percentage of people 3 years and older in K-12 schools:
Harwood: 25.2% Baltimore: 14.7%
- Percentage of people 3 years and older in undergraduate colleges:
Harwood: 4.4% Baltimore: 6.0%
- Percentage of people 3 years and older in grad. or professional schools:
Harwood: 10.7% Baltimore: 2.8%
- Percentage of students K-12 enrolled in private schools:
Harwood: 11.7% Baltimore: 12.7%
Percentage of population below poverty level:
| Harwood: | 21.5% |
| Baltimore: | 18.5% |
Median year renter moved in (as recorded in 2022):
| Harwood: | 2018 |
| Baltimore: | 2019 |
Percentage of married-couple families with both working:
| Harwood: | 125.3% |
| Baltimore: | 79.2% |
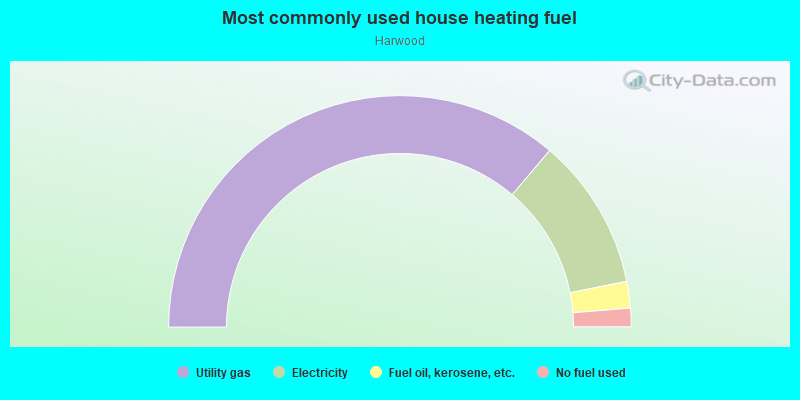
- 72.4%Utility gas
- 21.3%Electricity
- 3.7%Fuel oil, kerosene, etc.
- 2.6%No fuel used
Highways in this neighborhood:
State Hwy 45 (Greenmount Ave)
Length: 0.27 miles
Direction: N-S
Address range: 2547 to 2862
Direction: N-S
Address range: 2547 to 2862
Roads and streets:
Barclay St
Length: 0.33 miles
Direction: N-S
Address range: 2500 to 2816
Direction: N-S
Address range: 2500 to 2816
E 25th St
Length: 0.17 miles
Direction: E-W
Address range: 300 to 425
Direction: E-W
Address range: 300 to 425
E 25th 1/2 St
Length: 0.13 miles
Directions: E-W, SE-NW
Address range: 300 to 399
Directions: E-W, SE-NW
Address range: 300 to 399
E 26th St
Length: 0.12 miles
Direction: E-W
Address range: 300 to 399
Direction: E-W
Address range: 300 to 399
Ilchester Ave
Length: 0.12 miles
Direction: E-W
Address range: 400 to 499
Direction: E-W
Address range: 400 to 499
E 28th St
Length: 0.11 miles
Direction: E-W
Address range: 400 to 499
Direction: E-W
Address range: 400 to 499
Whitridge Ave
Length: 0.11 miles
Direction: E-W
Address range: 403 to 499
Direction: E-W
Address range: 403 to 499
E Lorraine Ave
Length: 0.11 miles
Direction: E-W
Address range: 400 to 2431
Direction: E-W
Address range: 400 to 2431
E 27th St
Length: 0.11 miles
Direction: E-W
Address range: 400 to 499
Direction: E-W
Address range: 400 to 499
Guilford Ave
Length: 0.10 miles
Direction: N-S
Address range: 2500 to 2605
Direction: N-S
Address range: 2500 to 2605
Railroad features:
Baltimore and Ohio RR
Length: 0.24 miles
Direction: E-W
Direction: E-W