Historic District (Downtown) neighborhood in Batavia, Illinois (IL), 60510 detailed profile
Settings
X

Business Search - 14 Million verified businesses
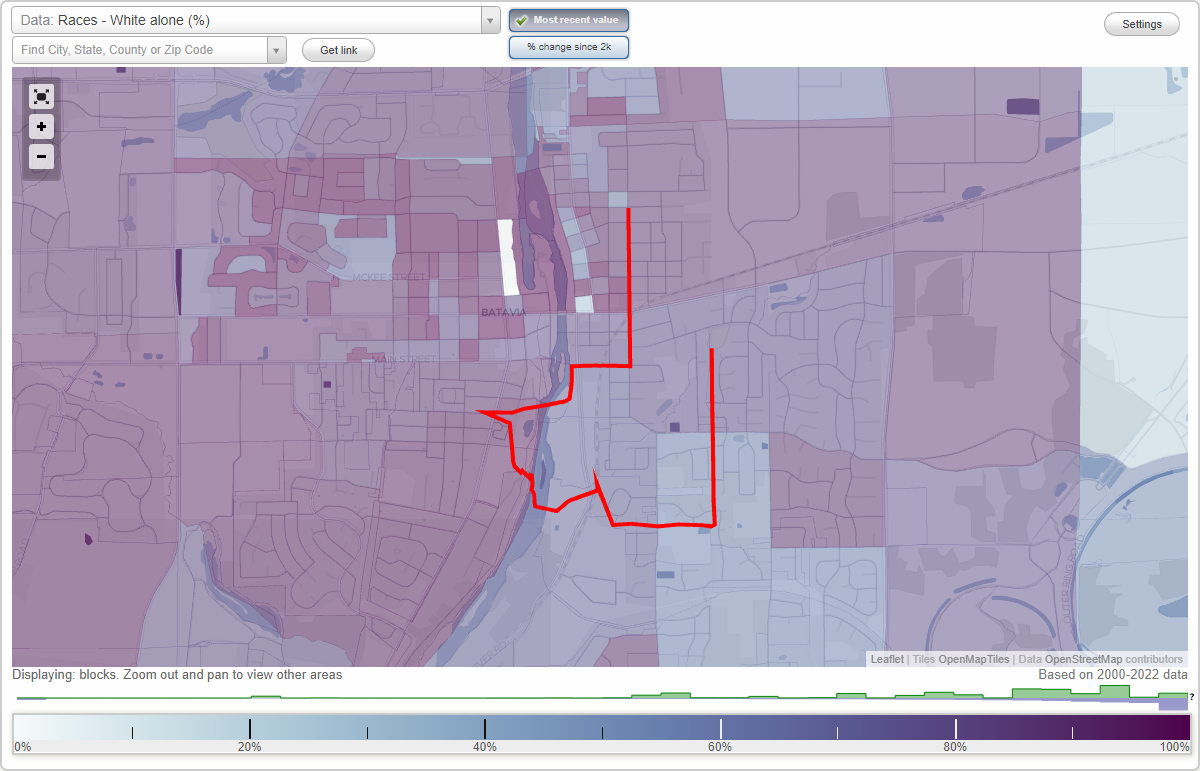
Area: 0.622 square miles
Population: 2,536
Population density:
| Historic District (Downtown): | 4,075 people per square mile |
| Batavia: | 2,914 people per square mile |

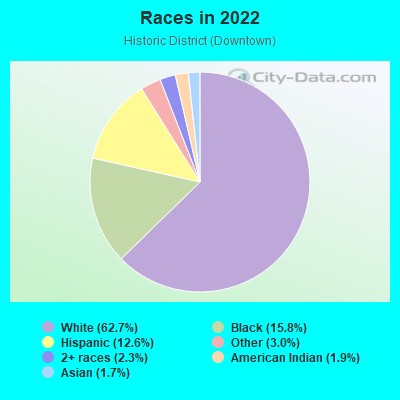
- 1,98562.7%White
- 50015.8%Black
- 40012.6%Hispanic or Latino
- 943.0%Some other race
- 732.3%Two or more races
- 591.9%American Indian
- 551.7%Asian
Median household income in 2022:
| Historic District (Downtown): | $88,949 |
| Batavia: | $113,824 |
Distribution of median household income
![Distribution of median household income]()
- 85Less than $10,000
- 299$10,000 to $19,999
- 158$20,000 to $29,999
- 171$30,000 to $39,999
- 120$40,000 to $49,999
- 80$50,000 to $59,999
- 461$60,000 to $74,999
- 100$75,000 to $99,999
- 65$100,000 to $124,999
- 81$125,000 to $149,999
- 123$150,000 to $199,999
- 163$200,000 or more

Distribution of owner-occupied house/condo value
![Distribution of owner-occupied house/condo value]()
- 93Less than $50,000
- 247$50,000 to $99,999
- 101$100,000 to $149,999
- 101$150,000 to $199,999
- 139$200,000 to $249,999
- 69$250,000 to $299,999
- 237$300,000 to $399,999
- 113$400,000 to $499,999
- 11$500,000 to $749,999
- 6$750,000 to $999,999
- 53$1,000,000 or more

Distribution of rent paid by renters
![Distribution of rent paid by renters]()
- 43$100 to $199
- 80$200 to $299
- 40$300 to $399
- 47$500 to $599
- 38$600 to $699
- 108$700 to $799
- 78$800 to $899
- 146$900 to $999
- 131$1,000 to $1,249
- 146$1,250 to $1,499
- 79$1,500 to $1,999
- 157$2,000 or more

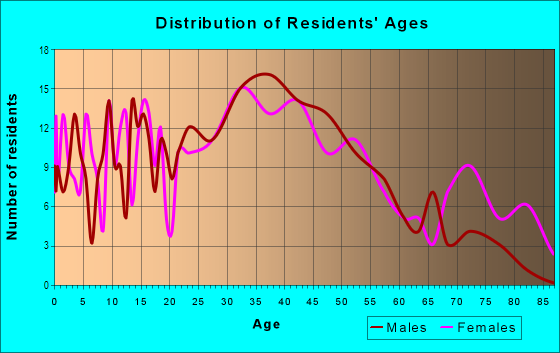
| Males: | 1,205 |
| Females: | 1,330 |
Males:
| This neighborhood: | 37.0 years |
| Whole city: | 37.4 years |
| This neighborhood: | 42.7 years |
| Whole city: | 41.2 years |
Average household size:
| Historic District (Downtown): | 6.9 people |
| Batavia: | 2.7 people |
Percentage of family households:
| Historic District (Downtown): | 33.3% |
| Batavia: | 54.4% |
| Here: | 41.3% |
| Batavia: | 59.7% |
Percentage of married-couple families with children (among all households):
| Historic District (Downtown): | 31.3% |
| Batavia: | 31.6% |
Percentage of single-mother households (among all households):
| Historic District (Downtown): | 33.1% |
| Batavia: | 3.3% |
Percentage of never married males 15 years old and over:
Percentage of never married females 15 years old and over:
| Historic District (Downtown): | 13.2% |
| Batavia: | 13.1% |
Percentage of never married females 15 years old and over:
| Historic District (Downtown): | 9.5% |
| city: | 12.3% |
Percentage of people that speak English not well or not at all:
| Historic District (Downtown): | 0.2% |
| Batavia: | 0.8% |
Percentage of people born in this state:
Percentage of people born in another U.S. state:
Percentage of native residents but born outside the U.S.:
Percentage of foreign born residents:
| Here: | 69.9% |
| Batavia: | 71.3% |
Percentage of people born in another U.S. state:
| Historic District (Downtown): | 22.2% |
| Batavia: | 21.4% |
Percentage of native residents but born outside the U.S.:
| Here: | 1.9% |
| city: | 1.9% |
Percentage of foreign born residents:
| Here: | 6.0% |
| Batavia: | 5.4% |
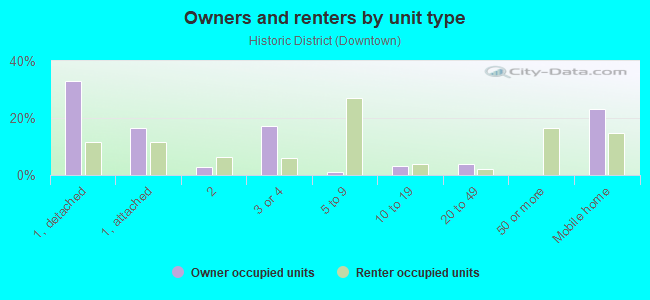
Owner-occupied
Renter-occupied

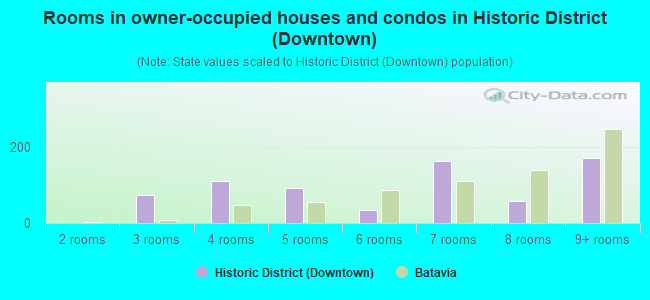
- Rooms in owner-occupied houses and condos in Historic District <
> - 01 room
- 02 rooms
- 733 rooms
- 1104 rooms
- 935 rooms
- 346 rooms
- 1627 rooms
- 588 rooms
- 1719+ rooms
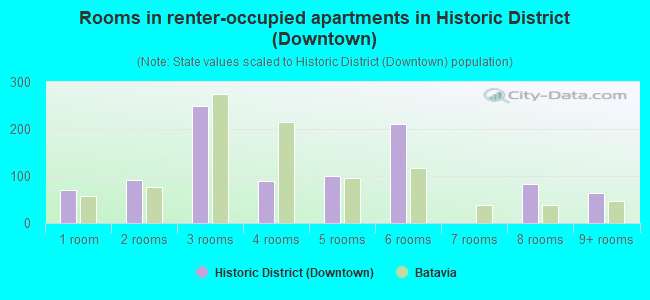
- Rooms in renter-occupied apartments in Historic District <
> - 711 room
- 922 rooms
- 2493 rooms
- 904 rooms
- 1005 rooms
- 2116 rooms
- 07 rooms
- 838 rooms
- 639+ rooms
Owner-occupied
Renter-occupied
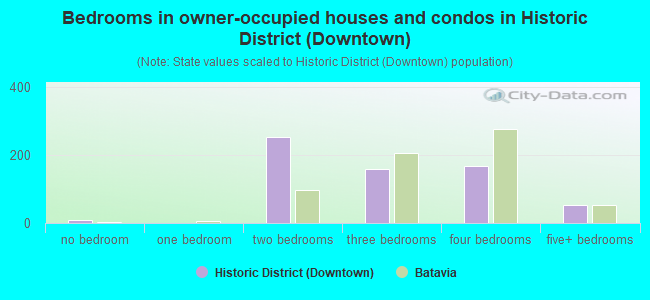
- Bedrooms in owner-occupied houses and condos in Historic District <
> - 8no bedroom
- 01 bedroom
- 2522 bedrooms
- 1603 bedrooms
- 1674 bedrooms
- 545+ bedrooms
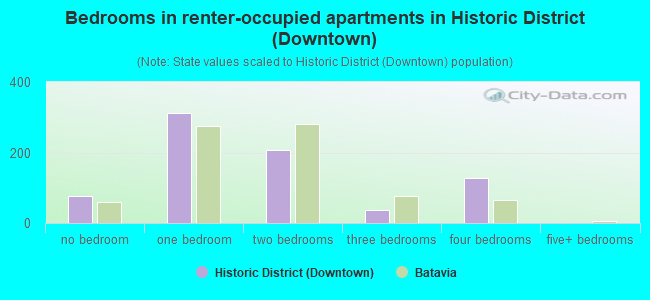
- Bedrooms in renter-occupied apartments in Historic District <
> - 77no bedroom
- 3121 bedroom
- 2082 bedrooms
- 373 bedrooms
- 1284 bedrooms
- 05+ bedrooms
Average number of cars or other vehicles available in houses/condos:
Average number of cars or other vehicles available in apartments:
| This neighborhood: | 2.1 |
| Batavia: | 2.2 |
Average number of cars or other vehicles available in apartments:
| Here: | 1.2 |
| city: | 1.2 |
Percentage of units with a mortgage:
| Historic District (Downtown): | 71.5% |
| Batavia: | 74.0% |
Average estimated value of detached houses in 2022 (37.6% of all units):
| Historic District (Downtown): | $260,209 |
| Batavia: | $378,561 |
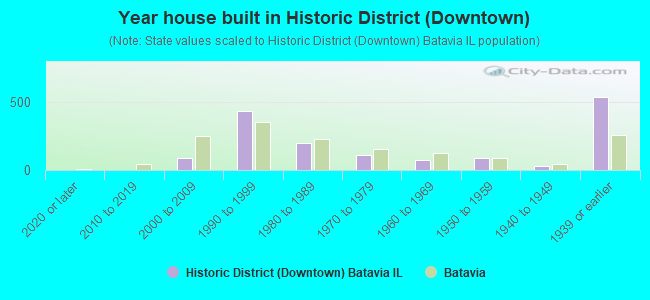
- Year house built in Historic District <
> - 02020 or later
- 02010 to 2019
- 852000 to 2009
- 4301990 to 1999
- 2011980 to 1989
- 1131970 to 1979
- 751960 to 1969
- 881950 to 1959
- 301940 to 1949
- 5331939 or earlier
City-data.com crime index for city in 2020 (higher means more crime):
| City: | 75.5 |
| U.S. average: | 219.5 |
Travel time to work (commute)
![Travel time to work (commute)]()
- 2205 to 9 minutes
- 24510 to 14 minutes
- 15515 to 19 minutes
- 13720 to 24 minutes
- 7225 to 29 minutes
- 18830 to 34 minutes
- 1735 to 39 minutes
- 6440 to 44 minutes
- 16545 to 59 minutes
- 5360 to 89 minutes
- 3290 or more minutes

Means of transportation to work
![Means of transportation to work]()
- 65.2%837Drove a car alone
- 16.1%207Carpooled
- 0.9%11Long-distance train or commuter rail
- 3.3%42Walked
- 15.6%201Worked at home

Time leaving home to go to work
![Time leaving home to go to work]()
- 12512:00 a.m. to 4:59 a.m.
- 265:00 a.m. to 5:29 a.m.
- 1045:30 a.m. to 5:59 a.m.
- 1886:00 a.m. to 6:29 a.m.
- 1346:30 a.m. to 6:59 a.m.
- 1497:00 a.m. to 7:29 a.m.
- 1757:30 a.m. to 7:59 a.m.
- 868:00 a.m. to 8:29 a.m.
- 1518:30 a.m. to 8:59 a.m.
- 499:00 a.m. to 9:59 a.m.
- 2610:00 a.m. to 10:59 a.m.
- 1711:00 a.m. to 11:59 a.m.
- 8412:00 p.m. to 3:59 p.m.
- 644:00 p.m. to 11:59 p.m.

Occupations of males:
- Percentage of males in management occupations (except farmers):
Here: 15.9% city: 16.8%
- Percentage of males in business and financial operations occupations:
Here: 7.5% city: 8.9%
- Percentage of males in computer and mathematical occupations:
Here: 1.1% city: 6.4%
- Percentage of males in education, training, and library occupations:
Here: 17.5% city: 4.3%
- Percentage of males in arts, design, entertainment, sports, and media occupations:
Here: 1.5% city: 3.2%
- Percentage of males in service occupations:
Here: 20.9% city: 9.1%
- Percentage of males in sales and office occupations:
Here: 12.0% city: 19.9%
- Percentage of males in production occupations:
Here: 7.1% city: 4.2%
- Percentage of males in transportation occupations:
Here: 7.8% city: 6.0%
- Percentage of males in material moving occupations:
Here: 4.7% city: 4.3%
Occupations of females:
- Percentage of females in management occupations (except farmers):
Here: 7.8% city: 12.0%
- Percentage of females in business and financial operations occupations:
Here: 11.5% city: 4.3%
- Percentage of females in education, training, and library occupations:
Here: 12.6% city: 13.6%
- Percentage of females in healthcare practitioners and technical occupations:
Here: 10.3% city: 10.6%
- Percentage of females in service occupations:
Here: 24.3% city: 15.1%
- Percentage of females in sales and office occupations:
Here: 28.7% city: 28.7%
- Percentage of females in production occupations:
Here: 3.1% city: 1.0%
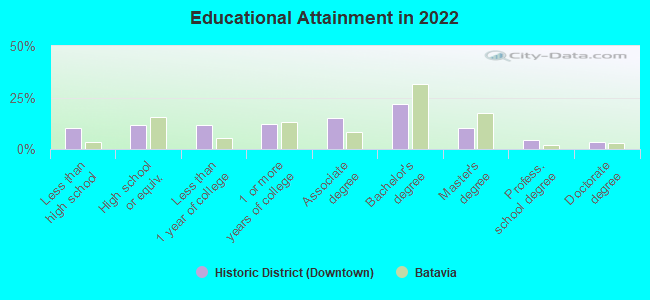
Education in this neighborhood (subdivision or community):
- Percentage of people 3 years and older in K-12 schools:
Historic District (Downtown): 22.9% Batavia: 19.6%
- Percentage of people 3 years and older in undergraduate colleges:
Historic District (Downtown): 12.5% Batavia: 4.7%
- Percentage of people 3 years and older in grad. or professional schools:
Historic District (Downtown): 5.2% Batavia: 1.1%
- Percentage of students K-12 enrolled in private schools:
Historic District (Downtown): 12.4% Batavia: 5.5%
Percentage of population below poverty level:
| Historic District (Downtown): | 9.9% |
| Batavia: | 4.9% |
Median year owner moved in (as recorded in 2022):
Median year renter moved in (as recorded in 2022):
| Historic District (Downtown): | 2005 |
| Batavia: | 2008 |
Median year renter moved in (as recorded in 2022):
| Historic District (Downtown): | 2014 |
| Batavia: | 2016 |
Percentage of married-couple families with both working:
| Historic District (Downtown): | 124.0% |
| Batavia: | 83.5% |
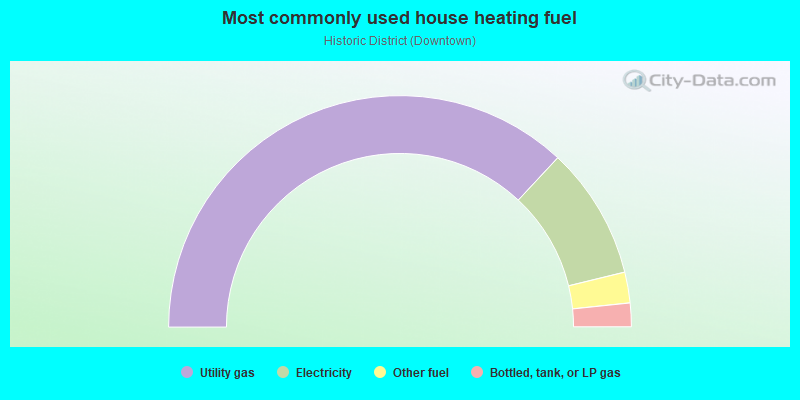
- 73.9%Utility gas
- 18.5%Electricity
- 4.3%Other fuel
- 3.3%Bottled, tank, or LP gas
Highways in this neighborhood:
N Batavia Ave (State Rte 31)
Length: 0.48 miles
Direction: N-S
Address range: 1 to 499
Direction: N-S
Address range: 1 to 499
N Washington Ave (State Rte 25)
Length: 0.43 miles
Directions: N-S, SE-NW
Address range: 1 to 528
Directions: N-S, SE-NW
Address range: 1 to 528
S River St (State Rte 25)
Length: 0.23 miles
Direction: N-S
Address range: 1 to 299
Direction: N-S
Address range: 1 to 299
State Rte 31 (S Batavia Ave)
Length: 0.21 miles
Direction: N-S
Address range: 1 to 199
Direction: N-S
Address range: 1 to 199
Roads and streets:
S Water St
Length: 0.47 miles
Directions: N-S, SW-NE
Address range: 1 to 599
Directions: N-S, SW-NE
Address range: 1 to 599
W Wilson St
Length: 0.47 miles
Direction: E-W
Address range: 1 to 399
Direction: E-W
Address range: 1 to 399
Houston St
Length: 0.41 miles
Direction: E-W
Address range: 100 to 399
Direction: E-W
Address range: 100 to 399
N Water St
Length: 0.41 miles
Directions: N-S, SE-NW, SW-NE
Address range: 1 to 399
Directions: N-S, SE-NW, SW-NE
Address range: 1 to 399
N River St
Length: 0.41 miles
Directions: N-S, SE-NW
Address range: 1 to 549
Directions: N-S, SE-NW
Address range: 1 to 549
E Wilson St
Length: 0.41 miles
Direction: E-W
Address range: 1 to 399
Direction: E-W
Address range: 1 to 399
N Prairie St
Length: 0.40 miles
Direction: N-S
Address range: 1 to 499
Direction: N-S
Address range: 1 to 499
N Van Buren St
Length: 0.40 miles
Direction: N-S
Address range: 1 to 499
Direction: N-S
Address range: 1 to 499
E Church St
Length: 0.38 miles
Direction: E-W
Address range: 100 to 399
Direction: E-W
Address range: 100 to 399
Pamarco Dr
Length: 0.37 miles
Directions: N-S, SE-NW, SW-NE
Directions: N-S, SE-NW, SW-NE
Main St
Length: 0.35 miles
Direction: E-W
Address range: 200 to 399
Direction: E-W
Address range: 200 to 399
Webster St
Length: 0.35 miles
Direction: E-W
Address range: 1 to 399
Direction: E-W
Address range: 1 to 399
E Franklin St
Length: 0.33 miles
Direction: E-W
Address range: 100 to 399
Direction: E-W
Address range: 100 to 399
E Spring St
Length: 0.32 miles
Direction: E-W
Address range: 100 to 399
Direction: E-W
Address range: 100 to 399
E State St
Length: 0.32 miles
Direction: E-W
Address range: 100 to 399
Direction: E-W
Address range: 100 to 399
E Laurel St
Length: 0.30 miles
Direction: E-W
Address range: 100 to 399
Direction: E-W
Address range: 100 to 399
N Island Ave
Length: 0.27 miles
Directions: N-S, SE-NW
Address range: 1 to 299
Directions: N-S, SE-NW
Address range: 1 to 299
1st St
Length: 0.26 miles
Directions: E-W, SW-NE
Address range: 100 to 299
Directions: E-W, SW-NE
Address range: 100 to 299
Shumway Ave
Length: 0.24 miles
Directions: E-W, N-S
Address range: 1 to 411
Directions: E-W, N-S
Address range: 1 to 411
S Prairie St
Length: 0.23 miles
Direction: N-S
Address range: 1 to 299
Direction: N-S
Address range: 1 to 299
S Van Buren St
Length: 0.23 miles
Direction: N-S
Address range: 1 to 299
Direction: N-S
Address range: 1 to 299
Adams St
Length: 0.22 miles
Direction: E-W
Address range: 100 to 249
Direction: E-W
Address range: 100 to 249
Fayette St
Length: 0.18 miles
Direction: E-W
Address range: 100 to 299
Direction: E-W
Address range: 100 to 299
Columbia St
Length: 0.17 miles
Direction: E-W
Address range: 100 to 299
Direction: E-W
Address range: 100 to 299
S Washington Ave
Length: 0.15 miles
Direction: N-S
Address range: 1 to 199
Direction: N-S
Address range: 1 to 199
N Park St
Length: 0.14 miles
Directions: E-W, N-S, SE-NW
Address range: 400 to 548
Directions: E-W, N-S, SE-NW
Address range: 400 to 548
W North Ave (North Ave)
Length: 0.11 miles
Directions: E-W, N-S, SE-NW
Address range: 200 to 299
Directions: E-W, N-S, SE-NW
Address range: 200 to 299
W Union Ave
Length: 0.10 miles
Directions: E-W, SE-NW
Address range: 100 to 199
Directions: E-W, SE-NW
Address range: 100 to 199
Flinn St
Length: 0.08 miles
Directions: E-W, SW-NE
Address range: 100 to 199
Directions: E-W, SW-NE
Address range: 100 to 199
N Lincoln St
Length: 0.08 miles
Direction: N-S
Address range: 1 to 99
Direction: N-S
Address range: 1 to 99
Laurel St
Length: 0.03 miles
Direction: E-W
Direction: E-W
Railroad features:
Chicago Burlington and Quincy RR
Length: 0.28 miles
Directions: N-S, SW-NE
Directions: N-S, SW-NE
Other features:
Mahonne Crk
Length: 0.01 miles
Direction: E-W
Direction: E-W