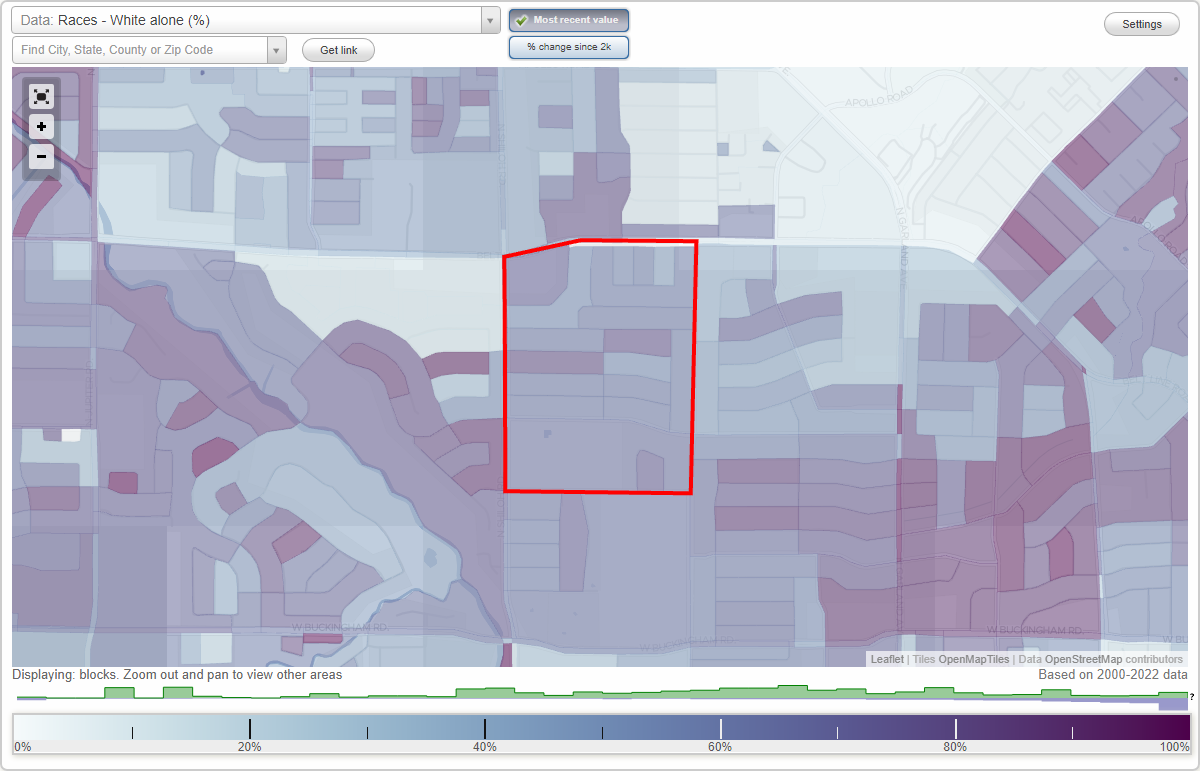
Holford neighborhood in Garland, Texas (TX), 75044 detailed profile
Settings
X

Business Search - 14 Million verified businesses
Area: 0.290 square miles
Population: 2,143
Population density:
| Holford: | 7,388 people per square mile |
| Garland: | 4,214 people per square mile |

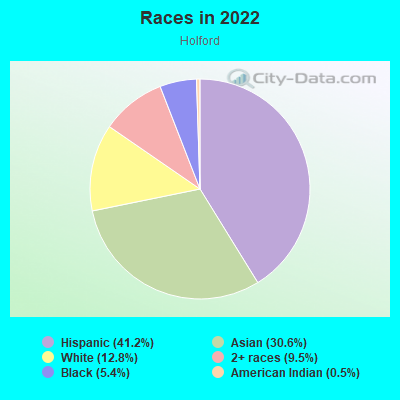
- 88341.2%Hispanic or Latino
- 65630.6%Asian
- 27312.8%White
- 2049.5%Two or more races
- 1155.4%Black
- 100.5%American Indian
Median household income in 2022:
| Holford: | $45,745 |
| Garland: | $71,191 |
Distribution of median household income
![Distribution of median household income]()
- 16Less than $10,000
- 9$10,000 to $19,999
- 53$20,000 to $29,999
- 89$30,000 to $39,999
- 187$40,000 to $49,999
- 33$50,000 to $59,999
- 49$60,000 to $74,999
- 59$75,000 to $99,999
- 71$100,000 to $124,999
- 18$125,000 to $149,999
- 59$150,000 to $199,999
- 27$200,000 or more

Distribution of owner-occupied house/condo value
![Distribution of owner-occupied house/condo value]()
- 66$100,000 to $149,999
- 156$150,000 to $199,999
- 105$200,000 to $249,999
- 16$250,000 to $299,999
- 23$300,000 to $399,999
- 2$500,000 to $749,999

Distribution of rent paid by renters
![Distribution of rent paid by renters]()
- 13$500 to $599
- 3$600 to $699
- 15$800 to $899
- 6$900 to $999
- 27$1,000 to $1,249
- 91$1,250 to $1,499
- 17$1,500 to $1,999
- 20$2,000 or more

Median rent in 2022:
| Holford: | $1,358 |
| Garland: | $1,257 |
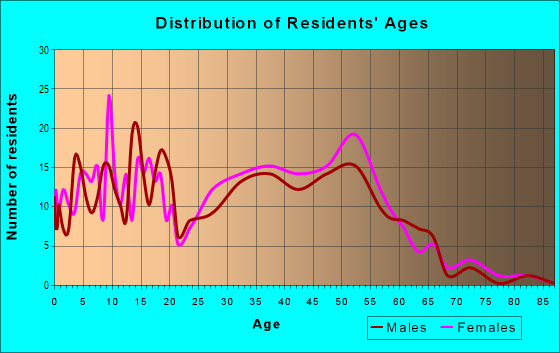
| Males: | 1,088 |
| Females: | 1,054 |
Males:
| This neighborhood: | 35.4 years |
| Whole city: | 33.8 years |
| This neighborhood: | 36.9 years |
| Whole city: | 35.1 years |
Average household size:
| Holford: | 4.0 people |
| Garland: | 2.9 people |
Percentage of family households:
| Holford: | 62.5% |
| Garland: | 56.1% |
| Here: | 59.1% |
| Garland: | 49.3% |
Percentage of married-couple families with children (among all households):
| Holford: | 18.3% |
| Garland: | 23.5% |
Percentage of single-mother households (among all households):
| Holford: | 2.4% |
| Garland: | 7.8% |
Percentage of never married males 15 years old and over:
Percentage of never married females 15 years old and over:
| Holford: | 18.2% |
| Garland: | 19.1% |
Percentage of never married females 15 years old and over:
| Holford: | 10.5% |
| city: | 15.9% |
Percentage of people that speak English not well or not at all:
| Holford: | 5.3% |
| Garland: | 9.6% |
Percentage of people born in this state:
Percentage of people born in another U.S. state:
Percentage of native residents but born outside the U.S.:
Percentage of foreign born residents:
| Here: | 43.3% |
| Garland: | 50.2% |
Percentage of people born in another U.S. state:
| Holford: | 12.9% |
| Garland: | 18.8% |
Percentage of native residents but born outside the U.S.:
| Here: | 0.4% |
| city: | 0.8% |
Percentage of foreign born residents:
| Here: | 43.4% |
| Garland: | 30.2% |
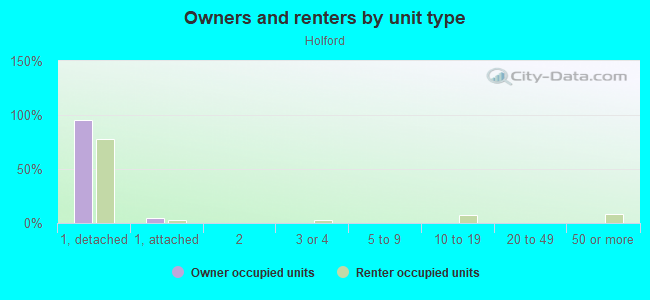
Owner-occupied
Renter-occupied

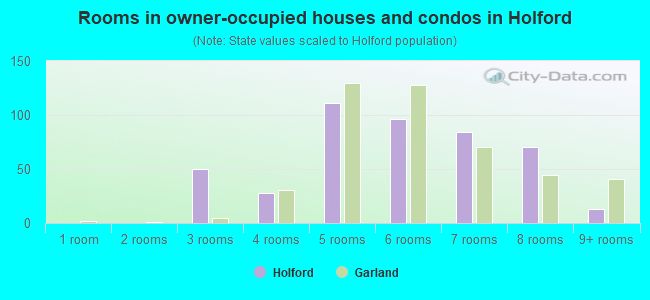
- Rooms in owner-occupied houses and condos in Holford
- 01 room
- 02 rooms
- 503 rooms
- 284 rooms
- 1115 rooms
- 966 rooms
- 847 rooms
- 708 rooms
- 139+ rooms
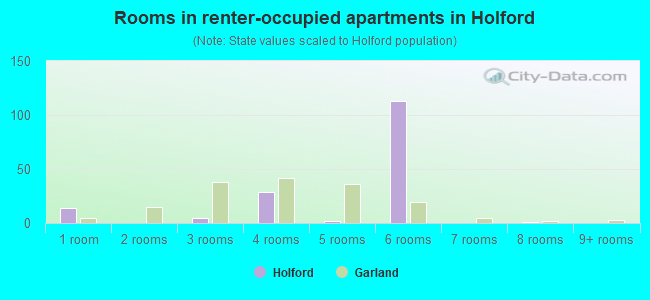
- Rooms in renter-occupied apartments in Holford
- 141 room
- 02 rooms
- 53 rooms
- 294 rooms
- 25 rooms
- 1136 rooms
- 07 rooms
- 18 rooms
- 09+ rooms
Owner-occupied
Renter-occupied
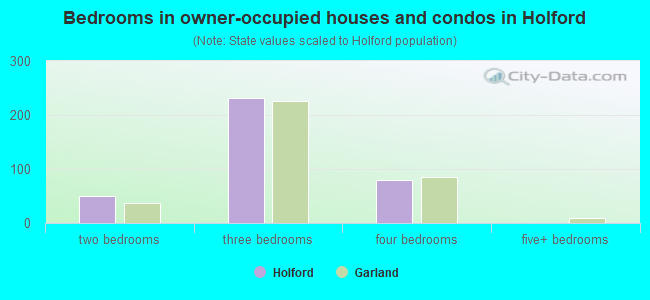
- Bedrooms in owner-occupied houses and condos in Holford
- 0no bedroom
- 01 bedroom
- 502 bedrooms
- 2323 bedrooms
- 794 bedrooms
- 05+ bedrooms
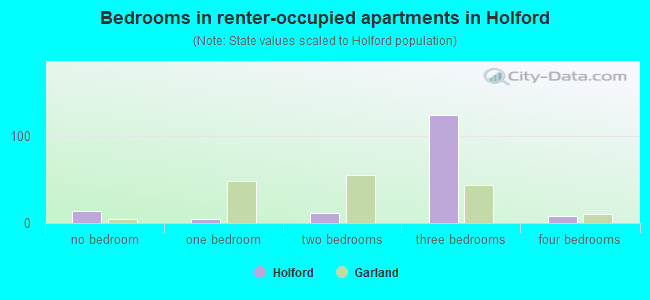
- Bedrooms in renter-occupied apartments in Holford
- 14no bedroom
- 51 bedroom
- 122 bedrooms
- 1243 bedrooms
- 84 bedrooms
- 05+ bedrooms
Average number of cars or other vehicles available in houses/condos:
Average number of cars or other vehicles available in apartments:
| This neighborhood: | 2.2 |
| Garland: | 2.2 |
Average number of cars or other vehicles available in apartments:
| Here: | 1.7 |
| city: | 1.6 |
Percentage of units with a mortgage:
| Holford: | 65.2% |
| Garland: | 59.5% |
Housing prices:
- Average estimated value of detached houses in 2022 (81.9% of all units):
Holford: $211,802 Garland: $265,641
- Average estimated value of townhouses or other attached units in 2022 (2.4% of all units):
This neighborhood: $776,435 city: $166,199
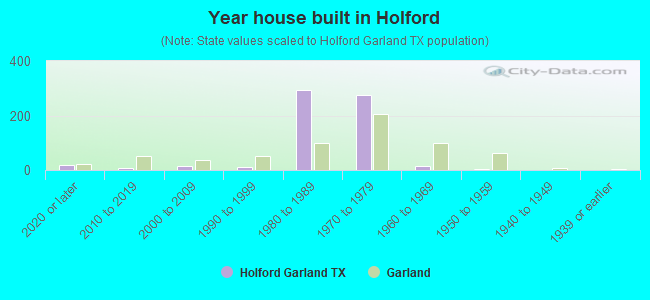
- Year house built in Holford
- 202020 or later
- 82010 to 2019
- 142000 to 2009
- 111990 to 1999
- 2941980 to 1989
- 2741970 to 1979
- 141960 to 1969
- 31950 to 1959
- 01940 to 1949
- 01939 or earlier
City-data.com crime index for city in 2020 (higher means more crime):
| City: | 222.1 |
| U.S. average: | 219.5 |
Travel time to work (commute)
![Travel time to work (commute)]()
- 13Less than 5 minutes
- 215 to 9 minutes
- 9310 to 14 minutes
- 7315 to 19 minutes
- 4720 to 24 minutes
- 9225 to 29 minutes
- 12530 to 34 minutes
- 4635 to 39 minutes
- 2640 to 44 minutes
- 3645 to 59 minutes
- 2060 to 89 minutes
- 1590 or more minutes

Means of transportation to work
![Means of transportation to work]()
- 82.0%564Drove a car alone
- 11.6%80Carpooled
- 0.6%4Subway or elevated rail
- 6.1%42Worked at home

Time leaving home to go to work
![Time leaving home to go to work]()
- 3212:00 a.m. to 4:59 a.m.
- 295:00 a.m. to 5:29 a.m.
- 176:00 a.m. to 6:29 a.m.
- 526:30 a.m. to 6:59 a.m.
- 697:00 a.m. to 7:29 a.m.
- 1287:30 a.m. to 7:59 a.m.
- 578:00 a.m. to 8:29 a.m.
- 368:30 a.m. to 8:59 a.m.
- 429:00 a.m. to 9:59 a.m.
- 6010:00 a.m. to 10:59 a.m.
- 3511:00 a.m. to 11:59 a.m.
- 912:00 p.m. to 3:59 p.m.
- 464:00 p.m. to 11:59 p.m.

Occupations of males:
- Percentage of males in management occupations (except farmers):
Here: 12.1% city: 7.6%
- Percentage of males in business and financial operations occupations:
Here: 2.4% city: 2.9%
- Percentage of males in computer and mathematical occupations:
Here: 6.4% city: 4.3%
- Percentage of males in architecture and engineering occupations:
Here: 9.7% city: 2.6%
- Percentage of males in community and social services occupations:
Here: 1.5% city: 1.2%
- Percentage of males in arts, design, entertainment, sports, and media occupations:
Here: 1.2% city: 1.7%
- Percentage of males in healthcare practitioners and technical occupations:
Here: 7.3% city: 2.3%
- Percentage of males in service occupations:
Here: 21.8% city: 14.0%
- Percentage of males in sales and office occupations:
Here: 10.2% city: 15.2%
- Percentage of males in construction, extraction, and maintenance occupations:
Here: 6.2% city: 17.9%
- Percentage of males in production occupations:
Here: 20.3% city: 8.4%
- Percentage of males in transportation occupations:
Here: 2.1% city: 6.5%
Occupations of females:
- Percentage of females in management occupations (except farmers):
Here: 3.8% city: 6.9%
- Percentage of females in business and financial operations occupations:
Here: 12.0% city: 6.2%
- Percentage of females in computer and mathematical occupations:
Here: 1.2% city: 3.2%
- Percentage of females in legal occupations:
Here: 1.0% city: 0.8%
- Percentage of females in education, training, and library occupations:
Here: 3.8% city: 7.8%
- Percentage of females in arts, design, entertainment, sports, and media occupations:
Here: 4.1% city: 1.6%
- Percentage of females in healthcare practitioners and technical occupations:
Here: 7.2% city: 6.3%
- Percentage of females in service occupations:
Here: 40.4% city: 25.4%
- Percentage of females in sales and office occupations:
Here: 31.7% city: 30.7%
- Percentage of females in production occupations:
Here: 1.8% city: 4.6%
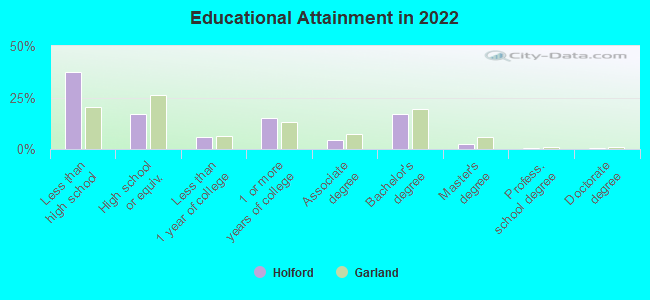
Education in this neighborhood (subdivision or community):
- Percentage of people 3 years and older in K-12 schools:
Holford: 30.9% Garland: 20.3%
- Percentage of people 3 years and older in undergraduate colleges:
Holford: 12.8% Garland: 3.5%
- Percentage of people 3 years and older in grad. or professional schools:
Holford: 1.5% Garland: 1.0%
- Percentage of students K-12 enrolled in private schools:
Holford: 1.9% Garland: 4.8%
Percentage of population below poverty level:
| Holford: | 15.2% |
| Garland: | 12.1% |
Median year owner moved in (as recorded in 2022):
Median year renter moved in (as recorded in 2022):
| Holford: | 2004 |
| Garland: | 2008 |
Median year renter moved in (as recorded in 2022):
| Holford: | 2008 |
| Garland: | 2020 |
Percentage of married-couple families with both working:
| Holford: | 50.2% |
| Garland: | 64.6% |
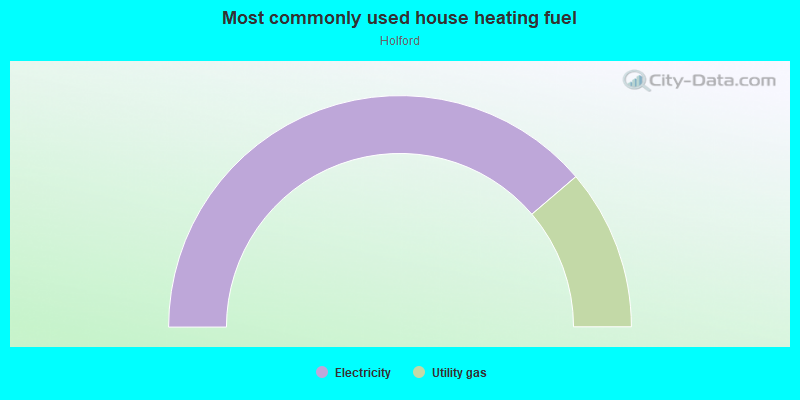
- 77.5%Electricity
- 22.5%Utility gas
Roads and streets:
Sam Houston Dr
Length: 0.59 miles
Direction: N-S
Address range: 2400 to 3099
Direction: N-S
Address range: 2400 to 3099
Village Green Dr
Length: 0.55 miles
Direction: E-W
Address range: 2000 to 2487
Direction: E-W
Address range: 2000 to 2487
Homestead Pl
Length: 0.55 miles
Direction: E-W
Address range: 2000 to 2487
Direction: E-W
Address range: 2000 to 2487
Richland Dr
Length: 0.49 miles
Direction: E-W
Address range: 2100 to 2485
Direction: E-W
Address range: 2100 to 2485
Richbrook Dr
Length: 0.48 miles
Direction: E-W
Address range: 2100 to 2485
Direction: E-W
Address range: 2100 to 2485
Richwood Dr
Length: 0.48 miles
Direction: E-W
Address range: 2100 to 2487
Direction: E-W
Address range: 2100 to 2487
Village Crest Dr
Length: 0.39 miles
Directions: E-W, N-S, SW-NE
Address range: 2000 to 2333
Directions: E-W, N-S, SW-NE
Address range: 2000 to 2333
Rich Oak Dr
Length: 0.38 miles
Direction: E-W
Address range: 2000 to 2414
Direction: E-W
Address range: 2000 to 2414
Deer Meadow Dr
Length: 0.38 miles
Directions: E-W, SW-NE
Address range: 1900 to 2399
Directions: E-W, SW-NE
Address range: 1900 to 2399
Richview Ct
Length: 0.27 miles
Directions: E-W, N-S, SW-NE
Address range: 2400 to 2499
Directions: E-W, N-S, SW-NE
Address range: 2400 to 2499
Richcreek Dr
Length: 0.25 miles
Direction: N-S
Address range: 2500 to 2699
Direction: N-S
Address range: 2500 to 2699
Highview Dr
Length: 0.22 miles
Direction: N-S
Address range: 2500 to 2899
Direction: N-S
Address range: 2500 to 2899
N Shiloh Rd
Length: 0.22 miles
Direction: N-S
Direction: N-S
Belt Line Rd
Length: 0.22 miles
Direction: E-W
Address range: 2000 to 2199
Direction: E-W
Address range: 2000 to 2199
Meadowglen Dr
Length: 0.18 miles
Direction: E-W
Address range: 2100 to 2242
Direction: E-W
Address range: 2100 to 2242
Rustic Meadow Dr
Length: 0.10 miles
Direction: N-S
Address range: 2900 to 2999
Direction: N-S
Address range: 2900 to 2999
Green Meadow Dr
Length: 0.10 miles
Direction: N-S
Address range: 2900 to 2999
Direction: N-S
Address range: 2900 to 2999
Fairmeadow Dr
Length: 0.10 miles
Direction: N-S
Address range: 2900 to 2932
Direction: N-S
Address range: 2900 to 2932
Golden Meadow Dr
Length: 0.09 miles
Direction: N-S
Address range: 2900 to 2999
Direction: N-S
Address range: 2900 to 2999
Village Crest Cir
Length: 0.09 miles
Direction: N-S
Address range: 2800 to 2999
Direction: N-S
Address range: 2800 to 2999