Horespoint Farm neighborhood in Newport News, Virginia (VA), 23602 detailed profile
Settings
X

Business Search - 14 Million verified businesses
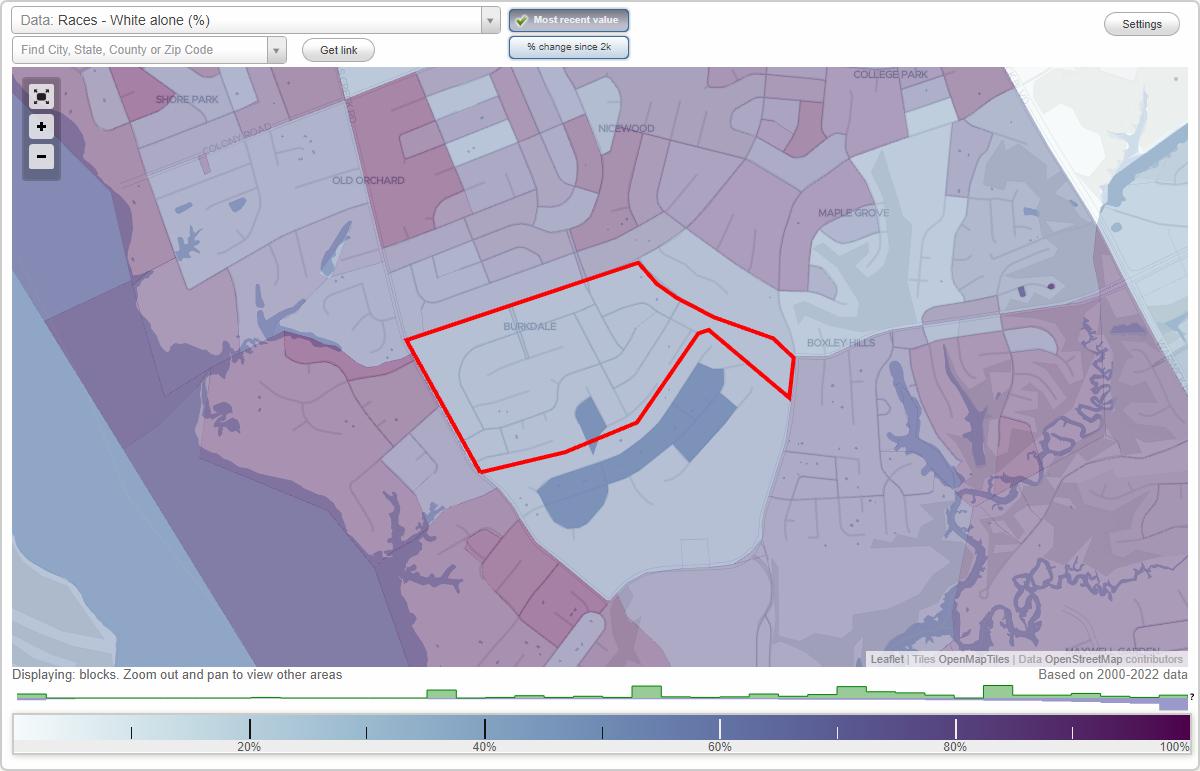
Area: 0.221 square miles
Population: 116
Population density:
| Horespoint Farm: | 525 people per square mile |
| Newport News: | 2,699 people per square mile |

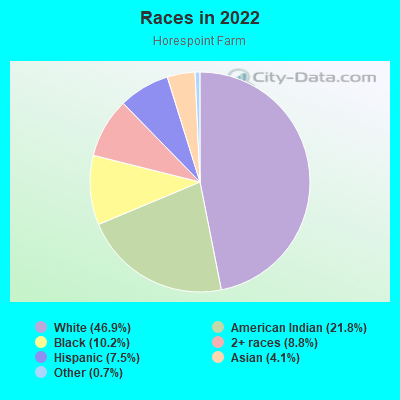
- 6946.9%White
- 3221.8%American Indian
- 1510.2%Black
- 138.8%Two or more races
- 117.5%Hispanic or Latino
- 64.1%Asian
- 10.7%Some other race
Median household income in 2022:
| Horespoint Farm: | $82,342 |
| Newport News: | $64,102 |
Distribution of median household income
![Distribution of median household income]()
- 6Less than $10,000
- 31$10,000 to $19,999
- 12$20,000 to $29,999
- 7$30,000 to $39,999
- 22$40,000 to $49,999
- 10$50,000 to $59,999
- 3$60,000 to $74,999
- 15$75,000 to $99,999
- 5$100,000 to $124,999
- 12$125,000 to $149,999
- 8$150,000 to $199,999
- 2$200,000 or more

Distribution of owner-occupied house/condo value
![Distribution of owner-occupied house/condo value]()
- 3Less than $50,000
- 2$50,000 to $99,999
- 19$100,000 to $149,999
- 19$150,000 to $199,999
- 11$200,000 to $249,999
- 20$250,000 to $299,999
- 7$300,000 to $399,999
- 3$400,000 to $499,999
- 14$500,000 to $749,999
- 5$1,000,000 or more

Distribution of rent paid by renters
![Distribution of rent paid by renters]()
- 2$400 to $499
- 3$700 to $799
- 6$900 to $999
- 2$1,000 to $1,249
- 10$1,250 to $1,499
- 3$1,500 to $1,999

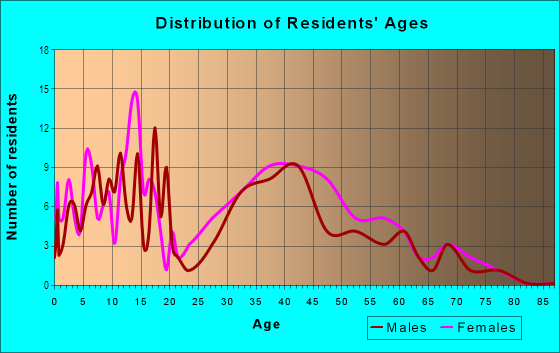
| Males: | 48 |
| Females: | 67 |
Males:
| This neighborhood: | 47.9 years |
| Whole city: | 32.8 years |
| This neighborhood: | 45.8 years |
| Whole city: | 35.9 years |
Average household size:
| Horespoint Farm: | 14.2 people |
| Newport News: | 2.4 people |
Percentage of family households:
| Horespoint Farm: | 45.0% |
| Newport News: | 43.1% |
| Here: | 34.9% |
| Newport News: | 36.0% |
Percentage of married-couple families with children (among all households):
| Horespoint Farm: | 23.3% |
| Newport News: | 23.0% |
Percentage of single-mother households (among all households):
| Horespoint Farm: | 3.0% |
| Newport News: | 14.6% |
Percentage of never married males 15 years old and over:
Percentage of never married females 15 years old and over:
| Horespoint Farm: | 12.0% |
| Newport News: | 21.4% |
Percentage of never married females 15 years old and over:
| Horespoint Farm: | 29.0% |
| city: | 19.2% |
Percentage of people that speak English not well or not at all:
| Horespoint Farm: | 1.8% |
| Newport News: | 1.4% |
Percentage of people born in this state:
Percentage of people born in another U.S. state:
Percentage of native residents but born outside the U.S.:
Percentage of foreign born residents:
| Here: | 43.6% |
| Newport News: | 52.5% |
Percentage of people born in another U.S. state:
| Horespoint Farm: | 40.1% |
| Newport News: | 36.1% |
Percentage of native residents but born outside the U.S.:
| Here: | 3.0% |
| city: | 3.4% |
Percentage of foreign born residents:
| Here: | 13.2% |
| Newport News: | 8.1% |
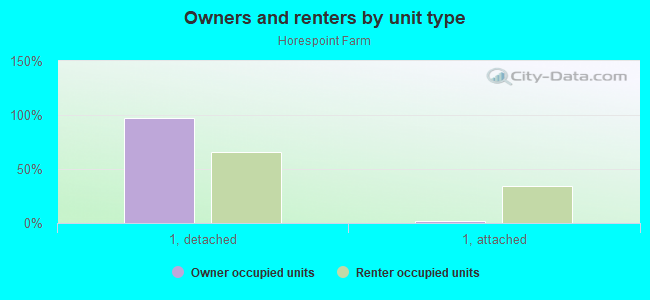
Owner-occupied
Renter-occupied

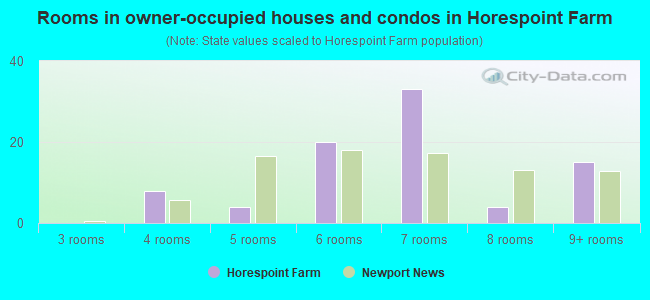
- Rooms in owner-occupied houses and condos in Horespoint Farm
- 01 room
- 02 rooms
- 03 rooms
- 84 rooms
- 45 rooms
- 206 rooms
- 337 rooms
- 48 rooms
- 159+ rooms
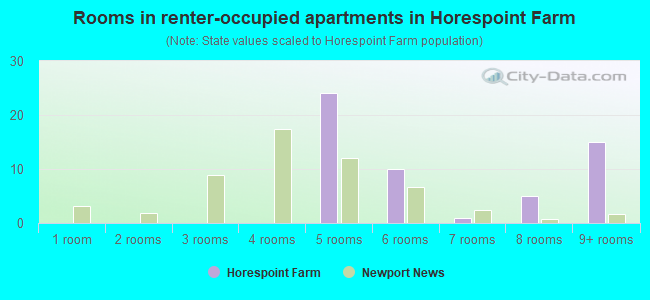
- Rooms in renter-occupied apartments in Horespoint Farm
- 01 room
- 02 rooms
- 03 rooms
- 04 rooms
- 245 rooms
- 106 rooms
- 17 rooms
- 58 rooms
- 159+ rooms
Owner-occupied
Renter-occupied
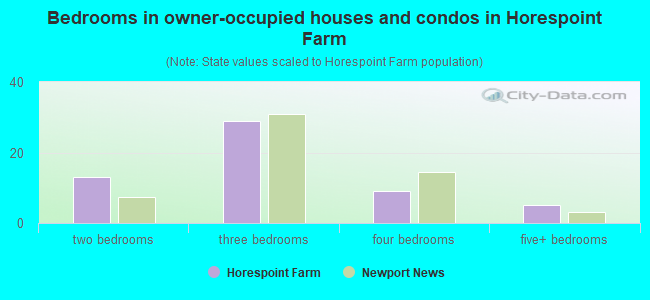
- Bedrooms in owner-occupied houses and condos in Horespoint Farm
- 0no bedroom
- 01 bedroom
- 132 bedrooms
- 293 bedrooms
- 94 bedrooms
- 55+ bedrooms
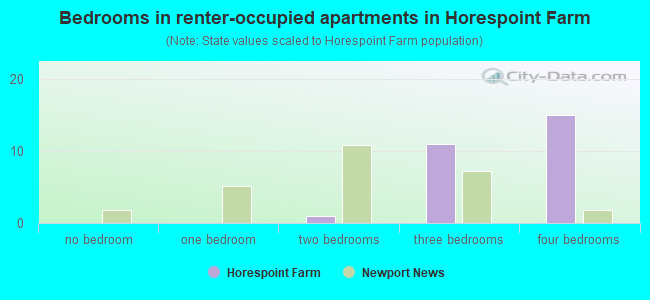
- Bedrooms in renter-occupied apartments in Horespoint Farm
- 0no bedroom
- 01 bedroom
- 12 bedrooms
- 113 bedrooms
- 154 bedrooms
- 05+ bedrooms
Average number of cars or other vehicles available in houses/condos:
Average number of cars or other vehicles available in apartments:
| This neighborhood: | 2.1 |
| Newport News: | 2.1 |
Average number of cars or other vehicles available in apartments:
| Here: | 1.8 |
| city: | 1.3 |
Percentage of units with a mortgage:
| Horespoint Farm: | 70.2% |
| Newport News: | 70.0% |
Average estimated value of detached houses in 2022 (93.1% of all units):
| Horespoint Farm: | $281,696 |
| Newport News: | $282,487 |
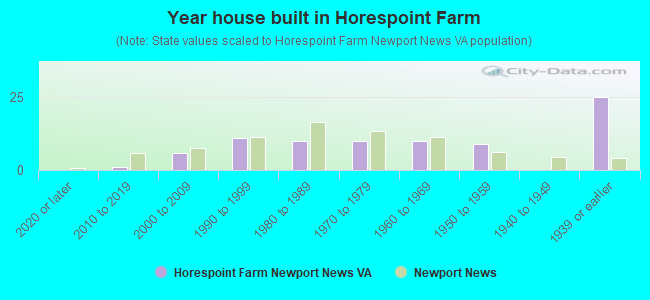
- Year house built in Horespoint Farm
- 02020 or later
- 12010 to 2019
- 62000 to 2009
- 111990 to 1999
- 101980 to 1989
- 101970 to 1979
- 101960 to 1969
- 91950 to 1959
- 01940 to 1949
- 251939 or earlier
City-data.com crime index for city in 2020 (higher means more crime):
| City: | 274.6 |
| U.S. average: | 219.5 |
Travel time to work (commute)
![Travel time to work (commute)]()
- 45 to 9 minutes
- 2210 to 14 minutes
- 1715 to 19 minutes
- 1120 to 24 minutes
- 725 to 29 minutes
- 1530 to 34 minutes
- 135 to 39 minutes
- 640 to 44 minutes
- 245 to 59 minutes
- 360 to 89 minutes
- 290 or more minutes

Means of transportation to work
![Means of transportation to work]()
- 91.8%61Drove a car alone
- 6.0%4Carpooled
- 27.1%18Bicycle
- 54.2%36Worked at home

Time leaving home to go to work
![Time leaving home to go to work]()
- 712:00 a.m. to 4:59 a.m.
- 45:00 a.m. to 5:29 a.m.
- 55:30 a.m. to 5:59 a.m.
- 66:00 a.m. to 6:29 a.m.
- 76:30 a.m. to 6:59 a.m.
- 187:00 a.m. to 7:29 a.m.
- 157:30 a.m. to 7:59 a.m.
- 108:00 a.m. to 8:29 a.m.
- 78:30 a.m. to 8:59 a.m.
- 39:00 a.m. to 9:59 a.m.
- 112:00 p.m. to 3:59 p.m.
- 104:00 p.m. to 11:59 p.m.

Occupations of males:
- Percentage of males in management occupations (except farmers):
Here: 20.6% city: 8.6%
- Percentage of males in business and financial operations occupations:
Here: 11.5% city: 3.5%
- Percentage of males in computer and mathematical occupations:
Here: 7.4% city: 5.6%
- Percentage of males in arts, design, entertainment, sports, and media occupations:
Here: 4.1% city: 1.6%
- Percentage of males in healthcare practitioners and technical occupations:
Here: 4.1% city: 1.2%
- Percentage of males in service occupations:
Here: 9.9% city: 15.8%
- Percentage of males in sales and office occupations:
Here: 39.5% city: 13.9%
- Percentage of males in production occupations:
Here: 7.4% city: 9.7%
- Percentage of males in transportation occupations:
Here: 10.0% city: 6.0%
Occupations of females:
- Percentage of females in management occupations (except farmers):
Here: 19.0% city: 8.1%
- Percentage of females in business and financial operations occupations:
Here: 17.6% city: 4.7%
- Percentage of females in computer and mathematical occupations:
Here: 12.0% city: 2.2%
- Percentage of females in community and social services occupations:
Here: 4.8% city: 3.9%
- Percentage of females in arts, design, entertainment, sports, and media occupations:
Here: 7.9% city: 1.6%
- Percentage of females in healthcare practitioners and technical occupations:
Here: 10.0% city: 7.8%
- Percentage of females in service occupations:
Here: 22.4% city: 22.8%
- Percentage of females in sales and office occupations:
Here: 3.8% city: 27.1%
- Percentage of females in production occupations:
Here: 7.2% city: 4.7%
Percentage of people 16-64 in Armed Forces:
| Horespoint Farm: | 4.5% |
| Newport News: | 8.2% |
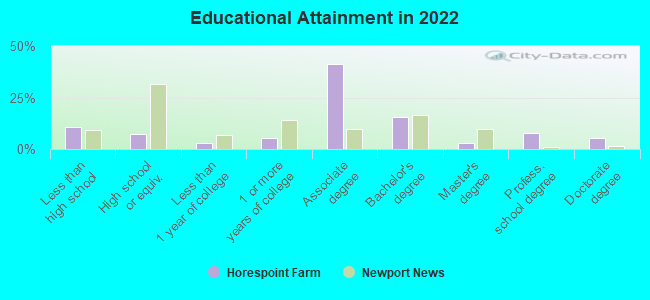
Education in this neighborhood (subdivision or community):
- Percentage of people 3 years and older in K-12 schools:
Horespoint Farm: 34.5% Newport News: 17.3%
- Percentage of people 3 years and older in undergraduate colleges:
Horespoint Farm: 29.2% Newport News: 5.4%
- Percentage of people 3 years and older in grad. or professional schools:
Horespoint Farm: 4.4% Newport News: 1.6%
- Percentage of students K-12 enrolled in private schools:
Horespoint Farm: 2.6% Newport News: 9.9%
Percentage of population below poverty level:
| Horespoint Farm: | 2.6% |
| Newport News: | 16.9% |
Median year owner moved in (as recorded in 2022):
| Horespoint Farm: | 2001 |
| Newport News: | 2009 |
Percentage of married-couple families with both working:
| Horespoint Farm: | 1296.2% |
| Newport News: | 67.5% |
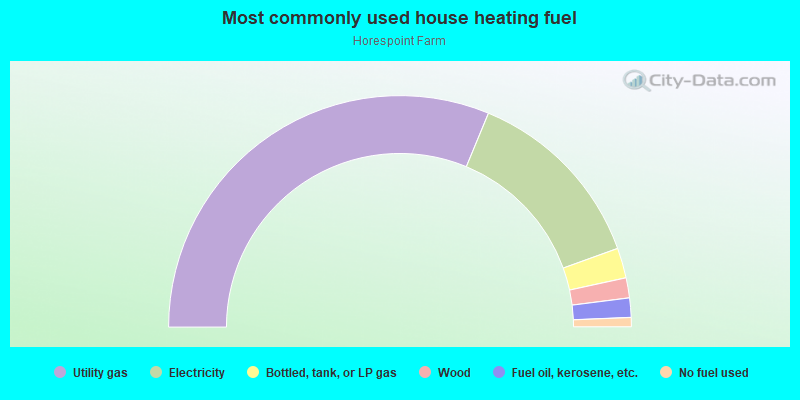
- 62.5%Utility gas
- 26.5%Electricity
- 4.2%Bottled, tank, or LP gas
- 2.8%Wood
- 2.7%Fuel oil, kerosene, etc.
- 1.3%No fuel used
Roads and streets:
Dellwood Dr
Length: 0.60 miles
Directions: E-W, N-S, SE-NW, SW-NE
Address range: 500 to 699
Directions: E-W, N-S, SE-NW, SW-NE
Address range: 500 to 699
Nottingham Trl
Length: 0.55 miles
Directions: E-W, N-S, SW-NE
Address range: 109 to 182
Directions: E-W, N-S, SW-NE
Address range: 109 to 182
Coventry Ln
Length: 0.29 miles
Direction: SE-NW
Address range: 100 to 199
Direction: SE-NW
Address range: 100 to 199
Kensington Dr
Length: 0.28 miles
Directions: E-W, SE-NW
Address range: 700 to 799
Directions: E-W, SE-NW
Address range: 700 to 799
Little John Pl
Length: 0.24 miles
Directions: E-W, SW-NE
Address range: 160 to 186
Directions: E-W, SW-NE
Address range: 160 to 186
Shadywood Dr
Length: 0.23 miles
Directions: E-W, SW-NE
Address range: 200 to 299
Directions: E-W, SW-NE
Address range: 200 to 299
Robinhood Ln
Length: 0.20 miles
Directions: E-W, SW-NE
Address range: 140 to 180
Directions: E-W, SW-NE
Address range: 140 to 180
Hahn Pl
Length: 0.17 miles
Direction: E-W
Address range: 200 to 299
Direction: E-W
Address range: 200 to 299
Gate St
Length: 0.17 miles
Direction: SE-NW
Address range: 100 to 195
Direction: SE-NW
Address range: 100 to 195
Brookfield Dr
Length: 0.14 miles
Directions: N-S, SE-NW
Address range: 101 to 111
Directions: N-S, SE-NW
Address range: 101 to 111
Saddle Dr
Length: 0.13 miles
Direction: E-W
Address range: 140 to 199
Direction: E-W
Address range: 140 to 199
King Richard Pl
Length: 0.11 miles
Direction: SE-NW
Address range: 151 to 175
Direction: SE-NW
Address range: 151 to 175
Abbey Ct
Length: 0.10 miles
Direction: SW-NE
Address range: 173 to 198
Direction: SW-NE
Address range: 173 to 198
Sir Arthur Ct
Length: 0.09 miles
Directions: N-S, SE-NW, SW-NE
Address range: 100 to 199
Directions: N-S, SE-NW, SW-NE
Address range: 100 to 199
Green Glen Dr
Length: 0.06 miles
Directions: N-S, SE-NW
Address range: 89 to 99
Directions: N-S, SE-NW
Address range: 89 to 99
Round Table Ct
Length: 0.02 miles
Direction: SE-NW
Address range: 1 to 8
Direction: SE-NW
Address range: 1 to 8
Lancelot Ct
Length: 0.02 miles
Direction: N-S
Address range: 1 to 10
Direction: N-S
Address range: 1 to 10