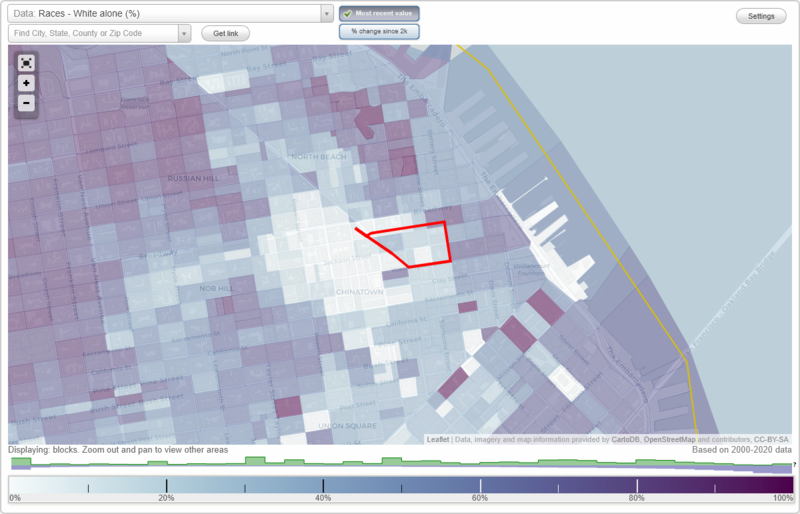
Jackson Square neighborhood in San Francisco, California (CA), 94111, 94133 detailed profile
Settings
X

Business Search - 14 Million verified businesses
Area: 0.029 square miles
Population: 702
Population density:
| Jackson Square: | 24,361 people per square mile |
| San Francisco: | 17,313 people per square mile |

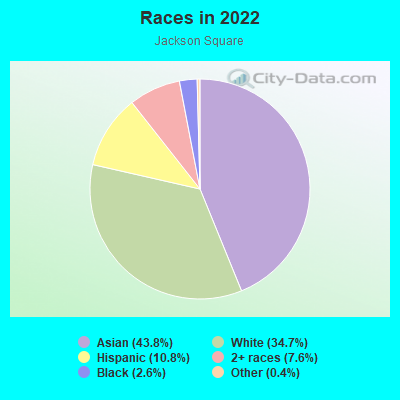
- 31543.8%Asian
- 25034.7%White
- 7810.8%Hispanic or Latino
- 557.6%Two or more races
- 192.6%Black
- 30.4%Some other race
Distribution of median household income
![Distribution of median household income]()
- 10Less than $10,000
- 64$10,000 to $19,999
- 45$20,000 to $29,999
- 56$30,000 to $39,999
- 61$40,000 to $49,999
- 6$50,000 to $59,999
- 2$60,000 to $74,999
- 11$75,000 to $99,999
- 41$100,000 to $124,999
- 49$125,000 to $149,999
- 49$150,000 to $199,999
- 52$200,000 or more

Distribution of owner-occupied house/condo value
![Distribution of owner-occupied house/condo value]()
- 4Less than $50,000
- 5$100,000 to $149,999
- 5$750,000 to $999,999
- 30$1,000,000 or more

Distribution of rent paid by renters
![Distribution of rent paid by renters]()
- 48$200 to $299
- 34$300 to $399
- 14$400 to $499
- 7$500 to $599
- 43$600 to $699
- 81$700 to $799
- 27$800 to $899
- 36$900 to $999
- 15$1,000 to $1,249
- 15$1,250 to $1,499
- 44$1,500 to $1,999
- 131$2,000 or more

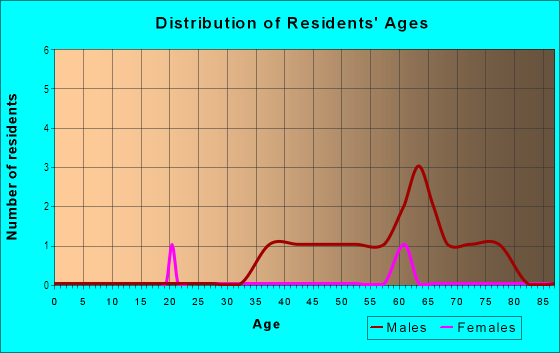
| Males: | 349 |
| Females: | 352 |
Males:
| This neighborhood: | 52.4 years |
| Whole city: | 40.3 years |
| This neighborhood: | 54.6 years |
| Whole city: | 40.5 years |
Average household size:
| Jackson Square: | 1.7 people |
| San Francisco: | 2.2 people |
Percentage of family households:
| Jackson Square: | 16.3% |
| San Francisco: | 30.3% |
| Here: | 19.3% |
| San Francisco: | 35.3% |
Percentage of married-couple families with children (among all households):
| Jackson Square: | 58.1% |
| San Francisco: | 35.9% |
Percentage of single-mother households (among all households):
| Jackson Square: | 15.5% |
| San Francisco: | 6.0% |
Percentage of never married males 15 years old and over:
Percentage of never married females 15 years old and over:
| Jackson Square: | 21.0% |
| San Francisco: | 24.6% |
Percentage of never married females 15 years old and over:
| Jackson Square: | 26.1% |
| city: | 19.9% |
Percentage of people that speak English not well or not at all:
| Jackson Square: | 18.8% |
| San Francisco: | 10.9% |
Percentage of people born in this state:
Percentage of people born in another U.S. state:
Percentage of native residents but born outside the U.S.:
Percentage of foreign born residents:
| Here: | 43.0% |
| San Francisco: | 40.8% |
Percentage of people born in another U.S. state:
| Jackson Square: | 18.1% |
| San Francisco: | 23.4% |
Percentage of native residents but born outside the U.S.:
| Here: | 2.9% |
| city: | 2.6% |
Percentage of foreign born residents:
| Here: | 36.0% |
| San Francisco: | 33.2% |
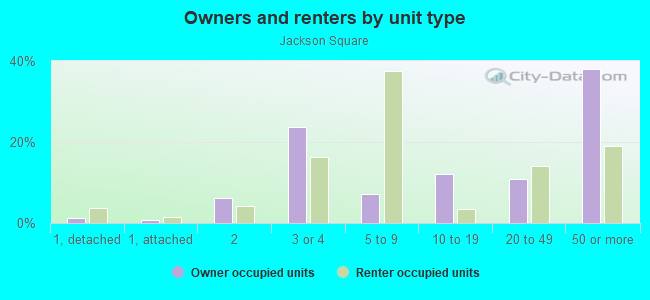
Owner-occupied
Renter-occupied

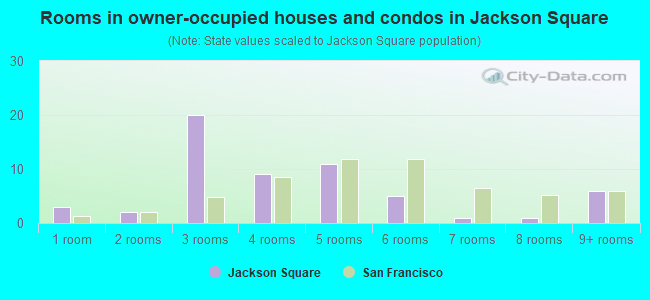
- Rooms in owner-occupied houses and condos in Jackson Square
- 31 room
- 22 rooms
- 203 rooms
- 94 rooms
- 115 rooms
- 56 rooms
- 17 rooms
- 18 rooms
- 69+ rooms
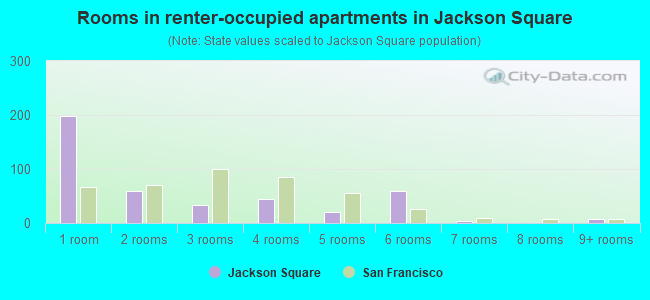
- Rooms in renter-occupied apartments in Jackson Square
- 1981 room
- 602 rooms
- 343 rooms
- 444 rooms
- 205 rooms
- 606 rooms
- 47 rooms
- 08 rooms
- 89+ rooms
Owner-occupied
Renter-occupied
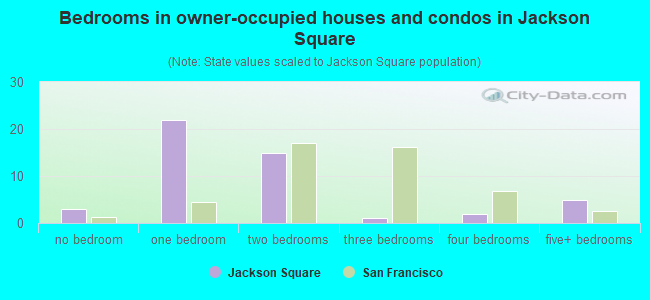
- Bedrooms in owner-occupied houses and condos in Jackson Square
- 3no bedroom
- 221 bedroom
- 152 bedrooms
- 13 bedrooms
- 24 bedrooms
- 55+ bedrooms
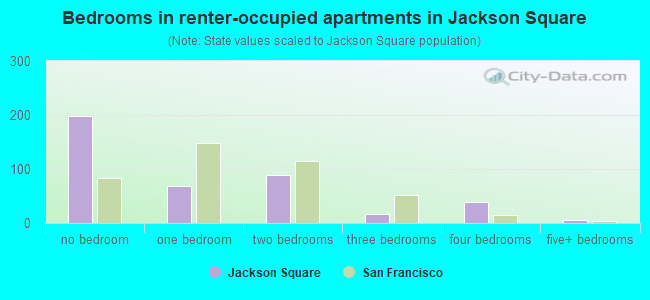
- Bedrooms in renter-occupied apartments in Jackson Square
- 198no bedroom
- 691 bedroom
- 892 bedrooms
- 173 bedrooms
- 384 bedrooms
- 55+ bedrooms
Average number of cars or other vehicles available in houses/condos:
Average number of cars or other vehicles available in apartments:
| This neighborhood: | 1.6 |
| San Francisco: | 1.5 |
Average number of cars or other vehicles available in apartments:
| Here: | 0.1 |
| city: | 0.8 |
Percentage of units with a mortgage:
| Jackson Square: | 62.6% |
| San Francisco: | 62.3% |
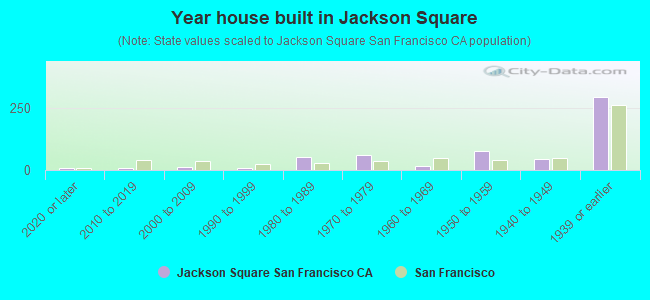
- Year house built in Jackson Square
- 82020 or later
- 82010 to 2019
- 142000 to 2009
- 81990 to 1999
- 531980 to 1989
- 601970 to 1979
- 151960 to 1969
- 771950 to 1959
- 431940 to 1949
- 2931939 or earlier
City-data.com crime index for city in 2020 (higher means more crime):
| City: | 387.4 |
| U.S. average: | 219.5 |
Travel time to work (commute)
![Travel time to work (commute)]()
- 7Less than 5 minutes
- 235 to 9 minutes
- 4710 to 14 minutes
- 5615 to 19 minutes
- 8820 to 24 minutes
- 1825 to 29 minutes
- 7630 to 34 minutes
- 1435 to 39 minutes
- 2140 to 44 minutes
- 2145 to 59 minutes
- 1960 to 89 minutes
- 890 or more minutes

Means of transportation to work
![Means of transportation to work]()
- 12.2%59Drove a car alone
- 0.2%1Carpooled
- 17.4%84Bus
- 1.2%6Subway or elevated rail
- 0.2%1Light rail, streetcar or trolley
- 4.4%21Ferryboat
- 7.7%37Taxi
- 1.9%9Bicycle
- 39.4%190Walked
- 3.7%18Other means
- 14.9%72Worked at home

Time leaving home to go to work
![Time leaving home to go to work]()
- 512:00 a.m. to 4:59 a.m.
- 85:00 a.m. to 5:29 a.m.
- 35:30 a.m. to 5:59 a.m.
- 336:00 a.m. to 6:29 a.m.
- 206:30 a.m. to 6:59 a.m.
- 367:00 a.m. to 7:29 a.m.
- 467:30 a.m. to 7:59 a.m.
- 708:00 a.m. to 8:29 a.m.
- 488:30 a.m. to 8:59 a.m.
- 449:00 a.m. to 9:59 a.m.
- 3210:00 a.m. to 10:59 a.m.
- 1611:00 a.m. to 11:59 a.m.
- 6512:00 p.m. to 3:59 p.m.
- 114:00 p.m. to 11:59 p.m.

Occupations of males:
- Percentage of males in business and financial operations occupations:
Here: 12.6% city: 8.9%
- Percentage of males in computer and mathematical occupations:
Here: 2.9% city: 14.6%
- Percentage of males in architecture and engineering occupations:
Here: 1.9% city: 4.0%
- Percentage of males in life, physical, and social science occupations:
Here: 10.7% city: 2.4%
- Percentage of males in legal occupations:
Here: 3.2% city: 2.5%
- Percentage of males in arts, design, entertainment, sports, and media occupations:
Here: 3.9% city: 4.9%
- Percentage of males in healthcare practitioners and technical occupations:
Here: 1.1% city: 3.2%
- Percentage of males in service occupations:
Here: 9.3% city: 11.8%
- Percentage of males in sales and office occupations:
Here: 26.3% city: 13.5%
- Percentage of males in construction, extraction, and maintenance occupations:
Here: 14.0% city: 3.1%
- Percentage of males in transportation occupations:
Here: 14.6% city: 3.4%
- Percentage of males in material moving occupations:
Here: 2.2% city: 1.8%
Occupations of females:
- Percentage of females in management occupations (except farmers):
Here: 30.3% city: 15.8%
- Percentage of females in business and financial operations occupations:
Here: 9.7% city: 11.5%
- Percentage of females in computer and mathematical occupations:
Here: 1.2% city: 5.1%
- Percentage of females in architecture and engineering occupations:
Here: 2.0% city: 1.6%
- Percentage of females in life, physical, and social science occupations:
Here: 1.2% city: 2.9%
- Percentage of females in education, training, and library occupations:
Here: 1.5% city: 7.1%
- Percentage of females in arts, design, entertainment, sports, and media occupations:
Here: 19.6% city: 5.1%
- Percentage of females in healthcare practitioners and technical occupations:
Here: 4.7% city: 8.4%
- Percentage of females in service occupations:
Here: 22.9% city: 15.4%
- Percentage of females in sales and office occupations:
Here: 15.9% city: 19.3%
- Percentage of females in production occupations:
Here: 2.0% city: 1.5%
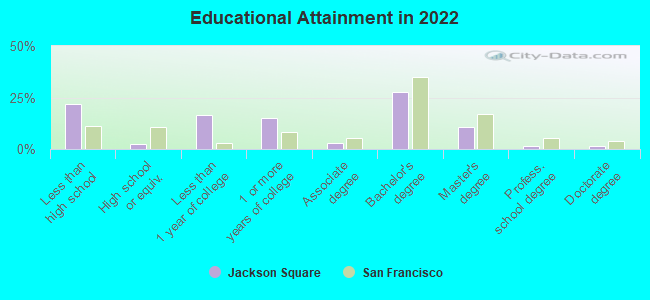
Education in this neighborhood (subdivision or community):
- Percentage of people 3 years and older in K-12 schools:
Jackson Square: 6.6% San Francisco: 9.7%
- Percentage of people 3 years and older in undergraduate colleges:
Jackson Square: 4.8% San Francisco: 4.8%
- Percentage of people 3 years and older in grad. or professional schools:
Jackson Square: 1.6% San Francisco: 2.6%
- Percentage of students K-12 enrolled in private schools:
Jackson Square: 73.9% San Francisco: 36.5%
Percentage of population below poverty level:
| Jackson Square: | 13.1% |
| San Francisco: | 10.4% |
Median year renter moved in (as recorded in 2022):
| Jackson Square: | 2014 |
| San Francisco: | 2019 |
Percentage of married-couple families with both working:
| Jackson Square: | 150.4% |
| San Francisco: | 75.9% |
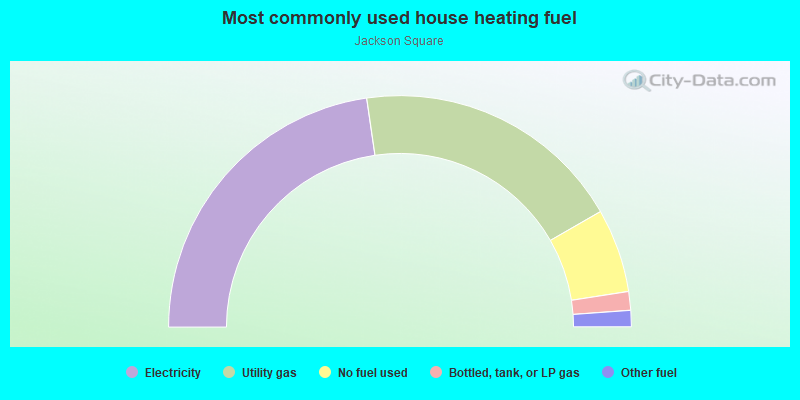
- 45.4%Electricity
- 38.0%Utility gas
- 11.7%No fuel used
- 2.6%Bottled, tank, or LP gas
- 2.3%Other fuel
Roads and streets:
Pacific Ave
Length: 0.31 miles
Direction: E-W
Address range: 300 to 599
Direction: E-W
Address range: 300 to 599
Jackson St
Length: 0.20 miles
Direction: E-W
Address range: 300 to 499
Direction: E-W
Address range: 300 to 499
Sansome St
Length: 0.13 miles
Direction: N-S
Address range: 600 to 799
Direction: N-S
Address range: 600 to 799
Battery St
Length: 0.13 miles
Direction: N-S
Address range: 500 to 699
Direction: N-S
Address range: 500 to 699
Gold St
Length: 0.11 miles
Direction: E-W
Address range: 1 to 99
Direction: E-W
Address range: 1 to 99
Washington St
Length: 0.11 miles
Direction: E-W
Address range: 432 to 549
Direction: E-W
Address range: 432 to 549
Custom House Pl
Length: 0.06 miles
Direction: N-S
Address range: 1 to 99
Direction: N-S
Address range: 1 to 99
Hotaling Pl (Hotaling St)
Length: 0.06 miles
Direction: N-S
Address range: 1 to 99
Direction: N-S
Address range: 1 to 99
Montgomery St
Length: 0.06 miles
Direction: N-S
Address range: 800 to 899
Direction: N-S
Address range: 800 to 899
Hinckley Walk (Hinckle Walk, Washington St)
Length: 0.04 miles
Direction: E-W
Address range: 400 to 449
Direction: E-W
Address range: 400 to 449
Jerome Aly
Length: 0.02 miles
Direction: N-S
Address range: 1 to 99
Direction: N-S
Address range: 1 to 99