Jefferson Gardens neighborhood in Greensboro, North Carolina (NC), 27410 detailed profile
Settings
X

Business Search - 14 Million verified businesses
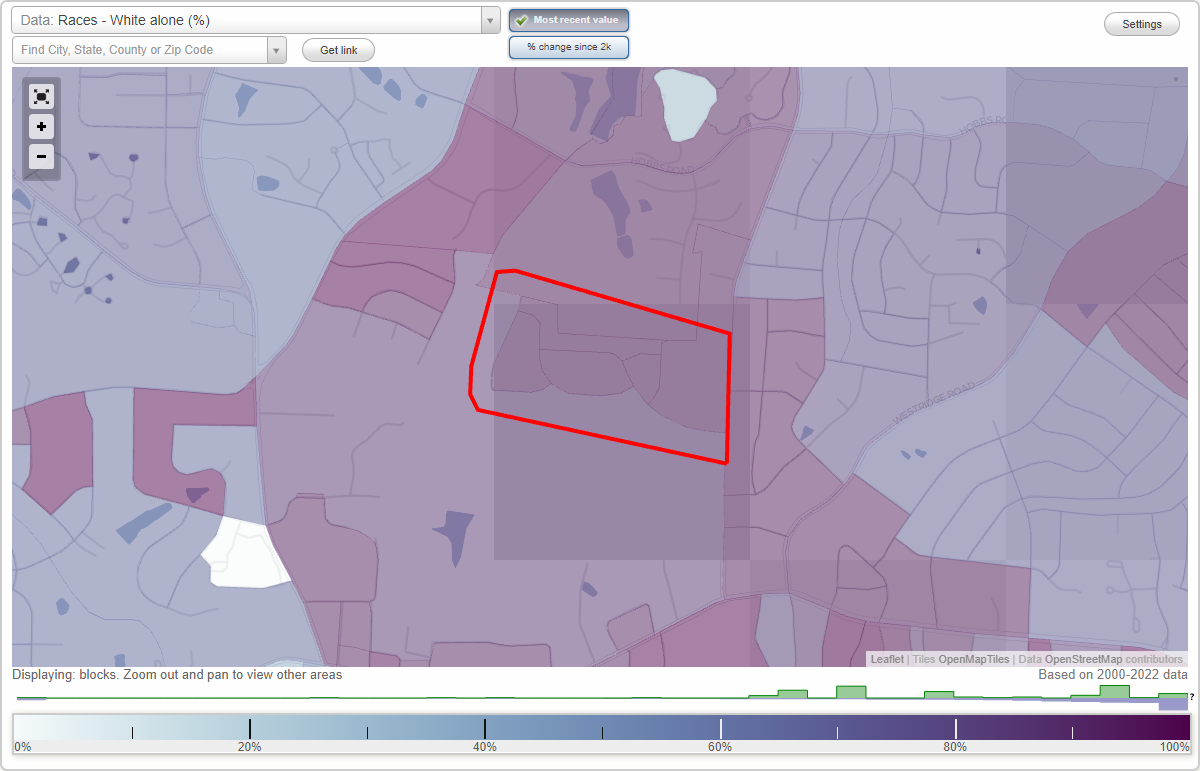
Area: 0.199 square miles
Population: 268
Population density:
| Jefferson Gardens: | 1,349 people per square mile |
| Greensboro: | 2,876 people per square mile |

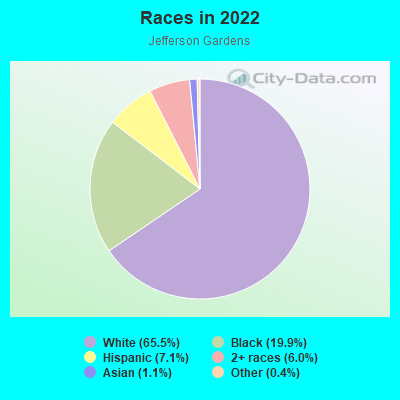
- 17565.5%White
- 5319.9%Black
- 197.1%Hispanic or Latino
- 166.0%Two or more races
- 31.1%Asian
- 10.4%Some other race
Median household income in 2022:
| Jefferson Gardens: | $117,886 |
| Greensboro: | $55,120 |
Distribution of median household income
![Distribution of median household income]()
- 4Less than $10,000
- 14$10,000 to $19,999
- 4$20,000 to $29,999
- 24$30,000 to $39,999
- 5$40,000 to $49,999
- 4$50,000 to $59,999
- 8$60,000 to $74,999
- 8$75,000 to $99,999
- 12$100,000 to $124,999
- 9$125,000 to $149,999
- 6$150,000 to $199,999
- 2$200,000 or more

Distribution of owner-occupied house/condo value
![Distribution of owner-occupied house/condo value]()
- 2Less than $50,000
- 3$50,000 to $99,999
- 16$100,000 to $149,999
- 11$150,000 to $199,999
- 10$200,000 to $249,999
- 5$250,000 to $299,999
- 14$300,000 to $399,999
- 1$400,000 to $499,999
- 5$750,000 to $999,999
- 2$1,000,000 or more

Distribution of rent paid by renters
![Distribution of rent paid by renters]()
- 3$1,000 to $1,249
- 2$1,250 to $1,499
- 7$1,500 to $1,999
- 14$2,000 or more

Median rent in 2022:
| Jefferson Gardens: | $1,810 |
| Greensboro: | $915 |
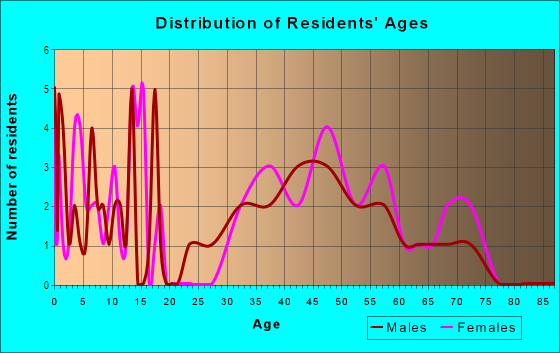
| Males: | 116 |
| Females: | 151 |
Males:
| This neighborhood: | 20.6 years |
| Whole city: | 32.4 years |
| This neighborhood: | 21.1 years |
| Whole city: | 35.3 years |
Average household size:
| Jefferson Gardens: | 2.9 people |
| Greensboro: | 2.3 people |
Percentage of family households:
| Jefferson Gardens: | 50.7% |
| Greensboro: | 43.6% |
| Here: | 63.8% |
| Greensboro: | 36.2% |
Percentage of married-couple families with children (among all households):
| Jefferson Gardens: | 16.2% |
| Greensboro: | 22.4% |
Percentage of single-mother households (among all households):
| Jefferson Gardens: | 1.9% |
| Greensboro: | 15.5% |
Percentage of never married males 15 years old and over:
Percentage of never married females 15 years old and over:
| Jefferson Gardens: | 22.2% |
| Greensboro: | 20.8% |
Percentage of never married females 15 years old and over:
| Jefferson Gardens: | 37.5% |
| city: | 23.9% |
Percentage of people that speak English not well or not at all:
| Jefferson Gardens: | 4.2% |
| Greensboro: | 2.7% |
Percentage of people born in this state:
Percentage of people born in another U.S. state:
Percentage of native residents but born outside the U.S.:
Percentage of foreign born residents:
| Here: | 52.2% |
| Greensboro: | 52.7% |
Percentage of people born in another U.S. state:
| Jefferson Gardens: | 37.6% |
| Greensboro: | 33.7% |
Percentage of native residents but born outside the U.S.:
| Here: | 0.2% |
| city: | 1.6% |
Percentage of foreign born residents:
| Here: | 10.0% |
| Greensboro: | 12.0% |
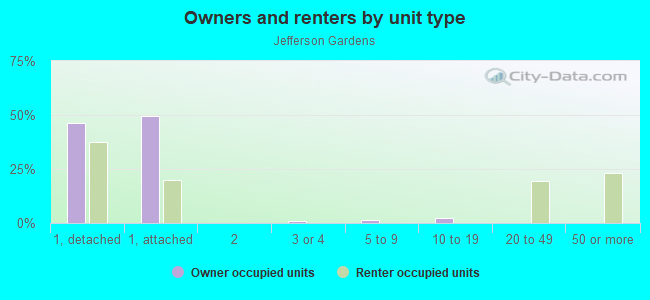
Owner-occupied
Renter-occupied

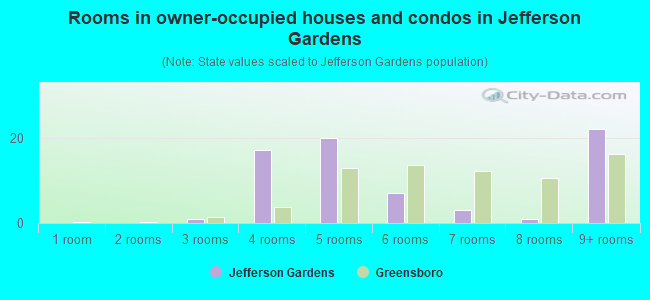
- Rooms in owner-occupied houses and condos in Jefferson Gardens
- 01 room
- 02 rooms
- 13 rooms
- 174 rooms
- 205 rooms
- 76 rooms
- 37 rooms
- 18 rooms
- 229+ rooms
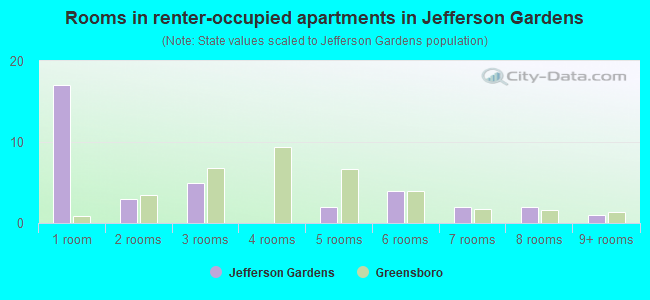
- Rooms in renter-occupied apartments in Jefferson Gardens
- 171 room
- 32 rooms
- 53 rooms
- 04 rooms
- 25 rooms
- 46 rooms
- 27 rooms
- 28 rooms
- 19+ rooms
Owner-occupied
Renter-occupied
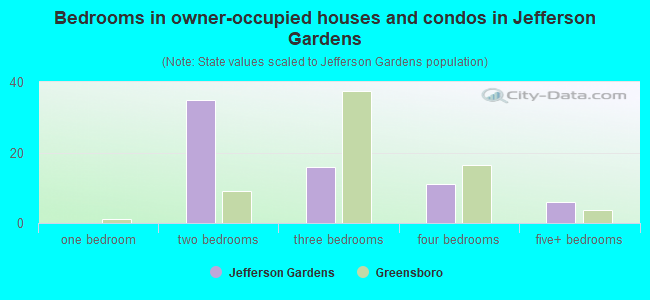
- Bedrooms in owner-occupied houses and condos in Jefferson Gardens
- 0no bedroom
- 01 bedroom
- 352 bedrooms
- 163 bedrooms
- 114 bedrooms
- 65+ bedrooms
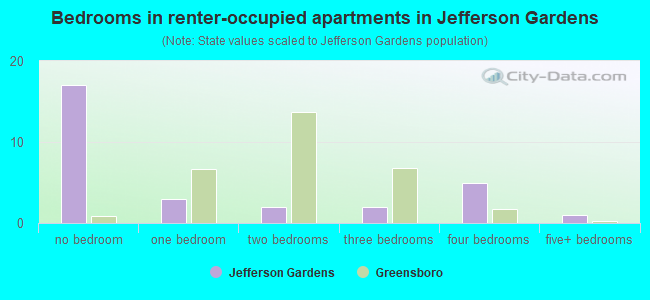
- Bedrooms in renter-occupied apartments in Jefferson Gardens
- 17no bedroom
- 31 bedroom
- 22 bedrooms
- 23 bedrooms
- 54 bedrooms
- 15+ bedrooms
Average number of cars or other vehicles available in houses/condos:
Average number of cars or other vehicles available in apartments:
| This neighborhood: | 2.4 |
| Greensboro: | 2.0 |
Average number of cars or other vehicles available in apartments:
| Here: | 2.0 |
| city: | 1.4 |
Percentage of units with a mortgage:
| Jefferson Gardens: | 76.6% |
| Greensboro: | 67.4% |
Average estimated value of detached houses in 2022 (81.0% of all units):
| Jefferson Gardens: | $338,603 |
| Greensboro: | $297,193 |
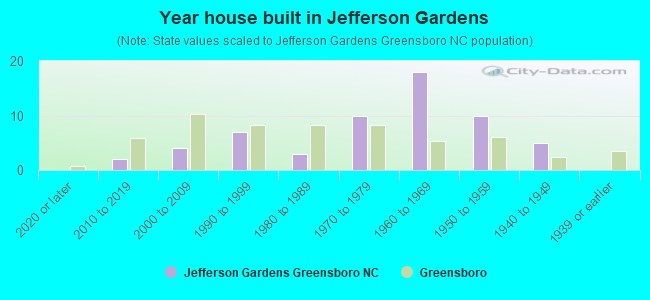
- Year house built in Jefferson Gardens
- 02020 or later
- 22010 to 2019
- 42000 to 2009
- 71990 to 1999
- 31980 to 1989
- 101970 to 1979
- 181960 to 1969
- 101950 to 1959
- 51940 to 1949
- 01939 or earlier
City-data.com crime index for city in 2020 (higher means more crime):
| City: | 435.6 |
| U.S. average: | 219.5 |
Travel time to work (commute)
![Travel time to work (commute)]()
- 7Less than 5 minutes
- 295 to 9 minutes
- 1010 to 14 minutes
- 2815 to 19 minutes
- 1720 to 24 minutes
- 625 to 29 minutes
- 630 to 34 minutes
- 435 to 39 minutes
- 145 to 59 minutes

Means of transportation to work
![Means of transportation to work]()
- 61.2%60Drove a car alone
- 7.1%7Carpooled
- 1.0%1Bicycle
- 13.3%13Walked
- 1.0%1Other means
- 13.3%13Worked at home

Time leaving home to go to work
![Time leaving home to go to work]()
- 25:00 a.m. to 5:29 a.m.
- 15:30 a.m. to 5:59 a.m.
- 116:00 a.m. to 6:29 a.m.
- 76:30 a.m. to 6:59 a.m.
- 107:00 a.m. to 7:29 a.m.
- 137:30 a.m. to 7:59 a.m.
- 168:00 a.m. to 8:29 a.m.
- 98:30 a.m. to 8:59 a.m.
- 159:00 a.m. to 9:59 a.m.
- 310:00 a.m. to 10:59 a.m.
- 2112:00 p.m. to 3:59 p.m.
- 84:00 p.m. to 11:59 p.m.

Occupations of males:
- Percentage of males in management occupations (except farmers):
Here: 19.0% city: 10.2%
- Percentage of males in business and financial operations occupations:
Here: 4.0% city: 4.8%
- Percentage of males in computer and mathematical occupations:
Here: 2.2% city: 3.9%
- Percentage of males in education, training, and library occupations:
Here: 9.7% city: 4.0%
- Percentage of males in arts, design, entertainment, sports, and media occupations:
Here: 9.2% city: 1.5%
- Percentage of males in service occupations:
Here: 25.2% city: 14.3%
- Percentage of males in sales and office occupations:
Here: 6.7% city: 17.1%
- Percentage of males in farming, fishing, and forestry occupations:
Here: 22.4% city: 0.4%
- Percentage of males in construction, extraction, and maintenance occupations:
Here: 1.5% city: 6.0%
- Percentage of males in production occupations:
Here: 28.2% city: 7.5%
- Percentage of males in transportation occupations:
Here: 1.5% city: 6.8%
- Percentage of males in material moving occupations:
Here: 2.5% city: 9.6%
Occupations of females:
- Percentage of females in management occupations (except farmers):
Here: 6.5% city: 7.8%
- Percentage of females in business and financial operations occupations:
Here: 5.4% city: 5.5%
- Percentage of females in community and social services occupations:
Here: 8.0% city: 3.2%
- Percentage of females in education, training, and library occupations:
Here: 30.1% city: 10.3%
- Percentage of females in arts, design, entertainment, sports, and media occupations:
Here: 2.0% city: 1.8%
- Percentage of females in healthcare practitioners and technical occupations:
Here: 17.8% city: 8.6%
- Percentage of females in service occupations:
Here: 15.7% city: 19.4%
- Percentage of females in sales and office occupations:
Here: 20.0% city: 29.0%
- Percentage of females in transportation occupations:
Here: 1.5% city: 1.5%
- Percentage of females in material moving occupations:
Here: 11.2% city: 2.7%
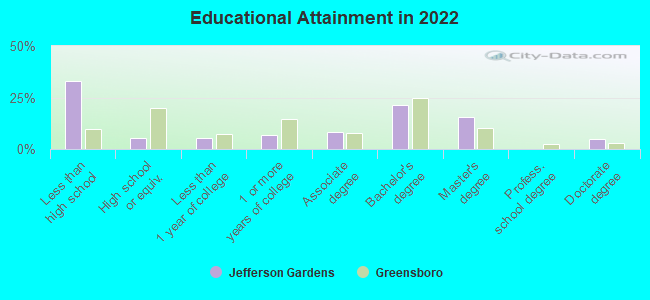
Education in this neighborhood (subdivision or community):
- Percentage of people 3 years and older in K-12 schools:
Jefferson Gardens: 15.2% Greensboro: 17.6%
- Percentage of people 3 years and older in undergraduate colleges:
Jefferson Gardens: 43.6% Greensboro: 11.2%
- Percentage of people 3 years and older in grad. or professional schools:
Jefferson Gardens: 1.1% Greensboro: 2.6%
- Percentage of students K-12 enrolled in private schools:
Jefferson Gardens: 0.0% Greensboro: 13.3%
Percentage of population below poverty level:
| Jefferson Gardens: | 13.4% |
| Greensboro: | 21.9% |
Median year owner moved in (as recorded in 2022):
Median year renter moved in (as recorded in 2022):
| Jefferson Gardens: | 2013 |
| Greensboro: | 2010 |
Median year renter moved in (as recorded in 2022):
| Jefferson Gardens: | 2015 |
| Greensboro: | 2020 |
Percentage of married-couple families with both working:
| Jefferson Gardens: | 75.2% |
| Greensboro: | 70.9% |
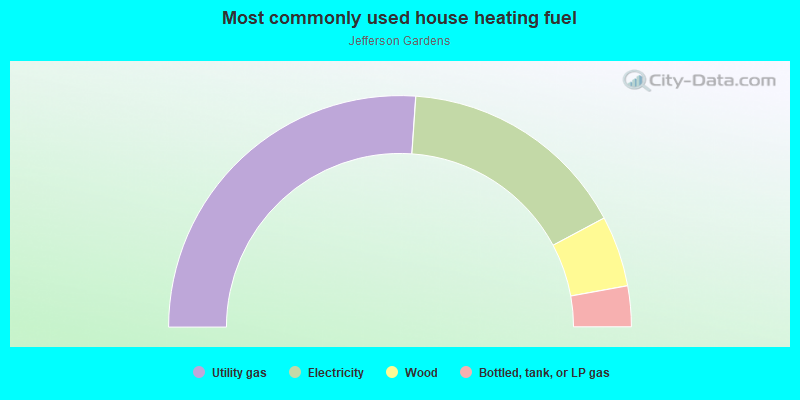
- 52.2%Utility gas
- 32.2%Electricity
- 9.9%Wood
- 5.7%Bottled, tank, or LP gas
Roads and streets:
Bennington Dr
Length: 0.63 miles
Directions: E-W, SE-NW
Address range: 4900 to 5399
Directions: E-W, SE-NW
Address range: 4900 to 5399
Ainsworth Dr
Length: 0.48 miles
Directions: E-W, N-S, SE-NW, SW-NE
Address range: 5100 to 5499
Directions: E-W, N-S, SE-NW, SW-NE
Address range: 5100 to 5499
Hayfield Ln
Length: 0.24 miles
Directions: N-S, SE-NW, SW-NE
Address range: 1000 to 1199
Directions: N-S, SE-NW, SW-NE
Address range: 1000 to 1199
Broadmoor Pl
Length: 0.18 miles
Directions: E-W, SW-NE
Address range: 5300 to 5399
Directions: E-W, SW-NE
Address range: 5300 to 5399
Elderwood Pl
Length: 0.16 miles
Directions: N-S, SW-NE
Address range: 1000 to 1199
Directions: N-S, SW-NE
Address range: 1000 to 1199
Thorncliff Dr
Length: 0.12 miles
Directions: E-W, SW-NE
Address range: 5300 to 5399
Directions: E-W, SW-NE
Address range: 5300 to 5399
Jefferson Rd
Length: 0.10 miles
Direction: N-S
Address range: 1000 to 1005
Direction: N-S
Address range: 1000 to 1005
Deer Glade Ct
Length: 0.04 miles
Direction: E-W
Address range: 1 to 99
Direction: E-W
Address range: 1 to 99
Ainsworth Ct
Length: 0.04 miles
Direction: N-S
Address range: 1000 to 1099
Direction: N-S
Address range: 1000 to 1099
Waterford Ln
Length: 0.03 miles
Direction: SW-NE
Address range: 900 to 999
Direction: SW-NE
Address range: 900 to 999
Bennington Ct
Length: 0.03 miles
Direction: N-S
Address range: 1 to 99
Direction: N-S
Address range: 1 to 99