Johns Hopkins Homewood neighborhood in Baltimore, Maryland (MD), 21218, 21211 detailed profile
Settings
X

Business Search - 14 Million verified businesses
Area: 0.249 square miles
Population: 3,001
Population density:
| Johns Hopkins Homewood: | 12,058 people per square mile |
| Baltimore: | 7,053 people per square mile |

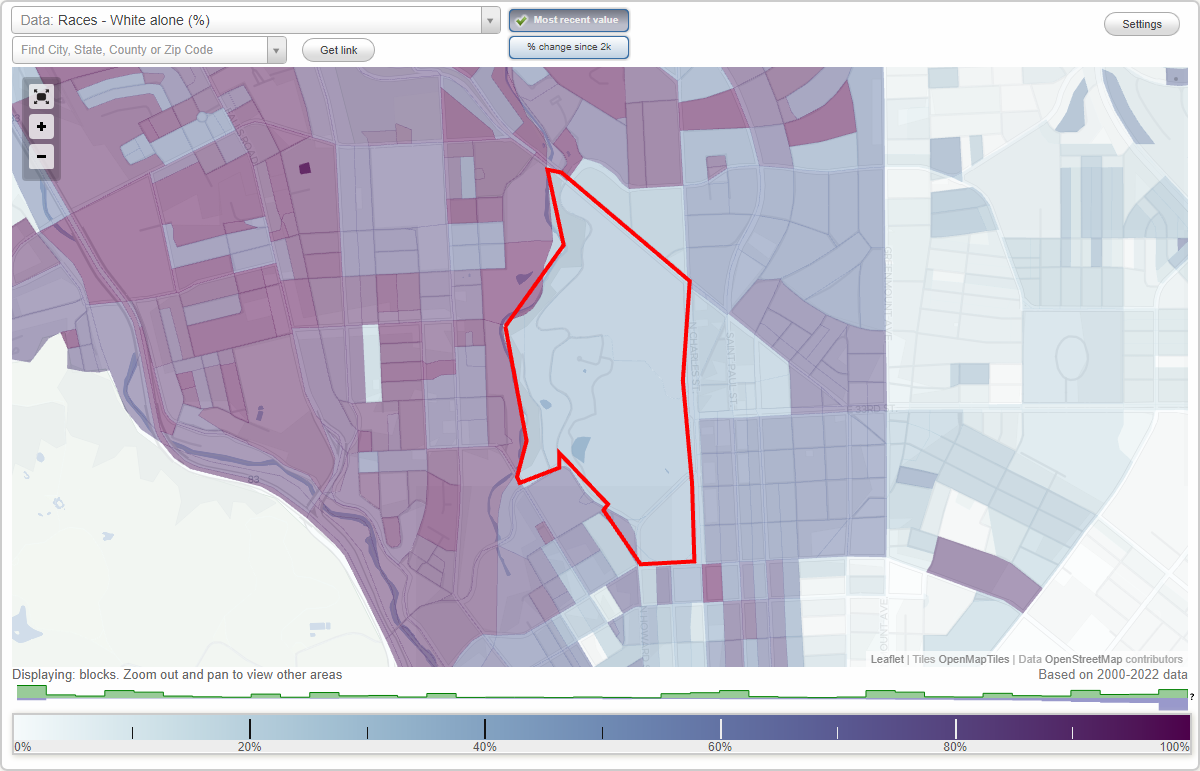
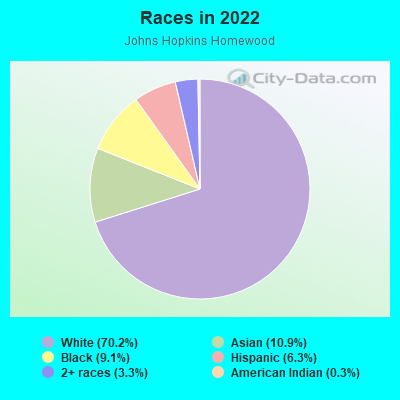
- 2,13970.2%White
- 33110.9%Asian
- 2769.1%Black
- 1916.3%Hispanic or Latino
- 1003.3%Two or more races
- 80.3%American Indian
- 10.03%Some other race
Median household income in 2022:
| Johns Hopkins Homewood: | $103,891 |
| Baltimore: | $55,198 |
Distribution of median household income
![Distribution of median household income]()
- 173Less than $10,000
- 90$10,000 to $19,999
- 118$20,000 to $29,999
- 119$30,000 to $39,999
- 209$40,000 to $49,999
- 94$50,000 to $59,999
- 241$60,000 to $74,999
- 273$75,000 to $99,999
- 513$100,000 to $124,999
- 119$125,000 to $149,999
- 134$150,000 to $199,999
- 247$200,000 or more

Distribution of owner-occupied house/condo value
![Distribution of owner-occupied house/condo value]()
- 38Less than $50,000
- 97$50,000 to $99,999
- 34$100,000 to $149,999
- 301$150,000 to $199,999
- 241$200,000 to $249,999
- 73$250,000 to $299,999
- 250$300,000 to $399,999
- 303$400,000 to $499,999
- 42$500,000 to $749,999
- 45$750,000 to $999,999
- 87$1,000,000 or more

Distribution of rent paid by renters
![Distribution of rent paid by renters]()
- 2$200 to $299
- 1$300 to $399
- 22$500 to $599
- 3$600 to $699
- 23$700 to $799
- 27$800 to $899
- 40$900 to $999
- 667$1,000 to $1,249
- 264$1,250 to $1,499
- 173$1,500 to $1,999
- 284$2,000 or more

Median rent in 2022:
| Johns Hopkins Homewood: | $1,612 |
| Baltimore: | $1,043 |
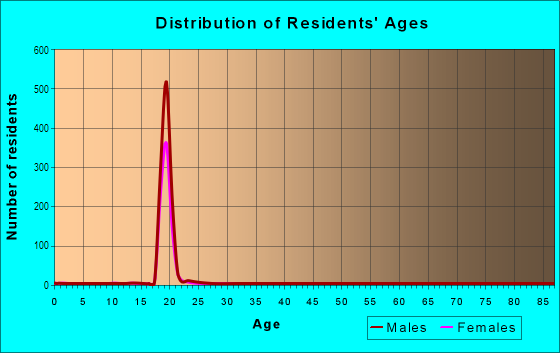
| Males: | 1,307 |
| Females: | 1,693 |
Males:
| This neighborhood: | 46.4 years |
| Whole city: | 35.0 years |
| This neighborhood: | 46.7 years |
| Whole city: | 38.2 years |
Average household size:
| Johns Hopkins Homewood: | 4.2 people |
| Baltimore: | 2.2 people |
Percentage of family households:
| Johns Hopkins Homewood: | 30.1% |
| Baltimore: | 34.2% |
| Here: | 29.7% |
| Baltimore: | 23.3% |
Percentage of married-couple families with children (among all households):
| Johns Hopkins Homewood: | 42.4% |
| Baltimore: | 22.4% |
Percentage of single-mother households (among all households):
| Johns Hopkins Homewood: | 11.6% |
| Baltimore: | 18.7% |
Percentage of never married males 15 years old and over:
Percentage of never married females 15 years old and over:
| Johns Hopkins Homewood: | 20.9% |
| Baltimore: | 25.1% |
Percentage of never married females 15 years old and over:
| Johns Hopkins Homewood: | 29.1% |
| city: | 27.5% |
Percentage of people that speak English not well or not at all:
| Johns Hopkins Homewood: | 0.0% |
| Baltimore: | 2.3% |
Percentage of people born in this state:
Percentage of people born in another U.S. state:
Percentage of native residents but born outside the U.S.:
Percentage of foreign born residents:
| Here: | 47.5% |
| Baltimore: | 64.4% |
Percentage of people born in another U.S. state:
| Johns Hopkins Homewood: | 41.2% |
| Baltimore: | 25.0% |
Percentage of native residents but born outside the U.S.:
| Here: | 1.6% |
| city: | 0.9% |
Percentage of foreign born residents:
| Here: | 9.7% |
| Baltimore: | 9.7% |
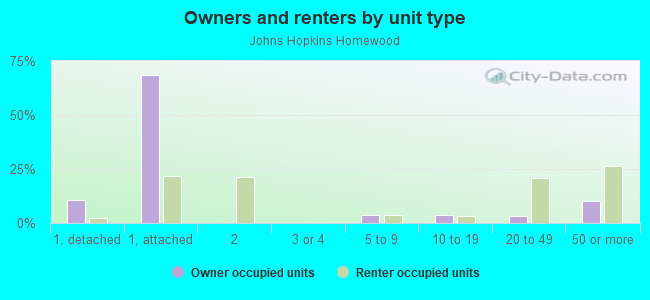
Owner-occupied
Renter-occupied

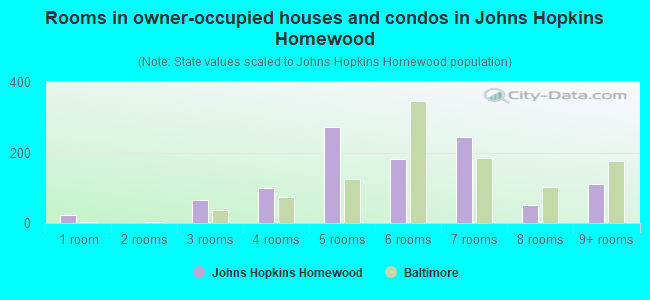
- Rooms in owner-occupied houses and condos in Johns Hopkins Homewood
- 231 room
- 02 rooms
- 663 rooms
- 1004 rooms
- 2735 rooms
- 1826 rooms
- 2447 rooms
- 518 rooms
- 1119+ rooms
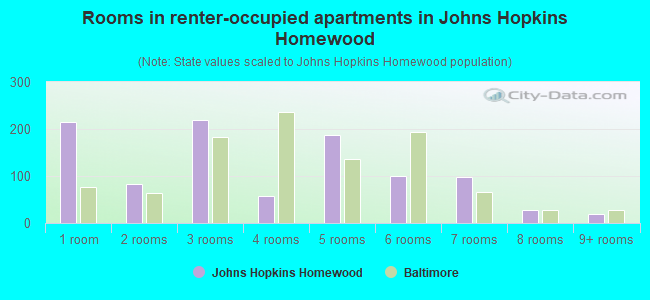
- Rooms in renter-occupied apartments in Johns Hopkins Homewood
- 2141 room
- 842 rooms
- 2203 rooms
- 584 rooms
- 1875 rooms
- 1006 rooms
- 987 rooms
- 278 rooms
- 209+ rooms
Owner-occupied
Renter-occupied
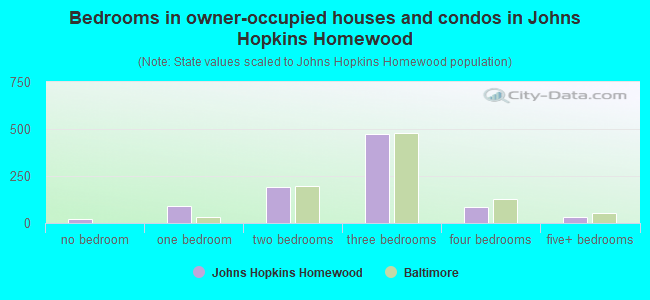
- Bedrooms in owner-occupied houses and condos in Johns Hopkins Homewood
- 23no bedroom
- 931 bedroom
- 1892 bedrooms
- 4733 bedrooms
- 834 bedrooms
- 345+ bedrooms
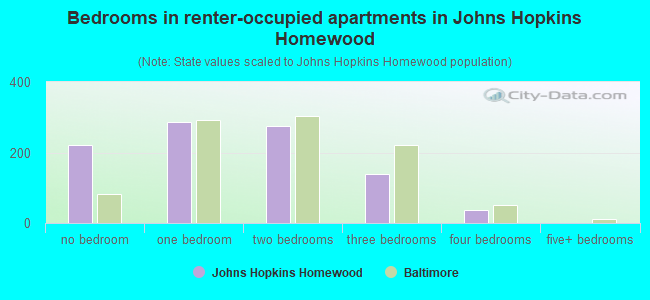
- Bedrooms in renter-occupied apartments in Johns Hopkins Homewood
- 221no bedroom
- 2871 bedroom
- 2762 bedrooms
- 1393 bedrooms
- 364 bedrooms
- 05+ bedrooms
Average number of cars or other vehicles available in houses/condos:
Average number of cars or other vehicles available in apartments:
| This neighborhood: | 1.4 |
| Baltimore: | 1.5 |
Average number of cars or other vehicles available in apartments:
| Here: | 1.2 |
| city: | 0.8 |
Percentage of units with a mortgage:
| Johns Hopkins Homewood: | 73.4% |
| Baltimore: | 64.3% |
Housing prices:
- Average estimated value of detached houses in 2022 (6.3% of all units):
Johns Hopkins Homewood: $415,093 Baltimore: $350,815
- Average estimated value of townhouses or other attached units in 2022 (58.2% of all units):
This neighborhood: $296,735 city: $206,258
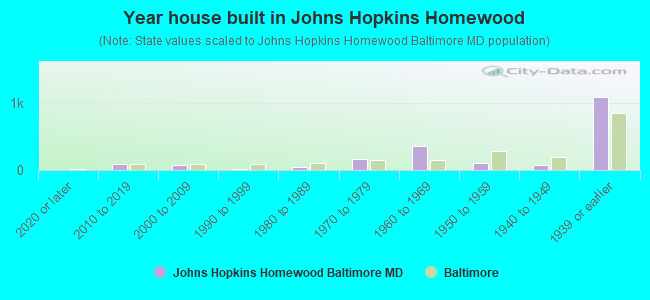
- Year house built in Johns Hopkins Homewood
- 02020 or later
- 862010 to 2019
- 732000 to 2009
- 131990 to 1999
- 501980 to 1989
- 1601970 to 1979
- 3601960 to 1969
- 1061950 to 1959
- 741940 to 1949
- 1,0811939 or earlier
Travel time to work (commute)
![Travel time to work (commute)]()
- 4Less than 5 minutes
- 65 to 9 minutes
- 1810 to 14 minutes
- 2315 to 19 minutes
- 2220 to 24 minutes
- 1025 to 29 minutes
- 2330 to 34 minutes
- 635 to 39 minutes
- 340 to 44 minutes
- 11345 to 59 minutes
- 660 to 89 minutes
- 290 or more minutes

Means of transportation to work
![Means of transportation to work]()
- 53.7%1,043Drove a car alone
- 5.7%110Carpooled
- 9.5%184Bus
- 1.8%35Subway or elevated rail
- 2.4%47Long-distance train or commuter rail
- 2.4%47Motorcycle
- 4.5%88Bicycle
- 6.3%122Walked
- 0.2%3Other means
- 22.5%438Worked at home

Time leaving home to go to work
![Time leaving home to go to work]()
- 212:00 a.m. to 4:59 a.m.
- 35:00 a.m. to 5:29 a.m.
- 15:30 a.m. to 5:59 a.m.
- 46:00 a.m. to 6:29 a.m.
- 76:30 a.m. to 6:59 a.m.
- 187:00 a.m. to 7:29 a.m.
- 137:30 a.m. to 7:59 a.m.
- 258:00 a.m. to 8:29 a.m.
- 208:30 a.m. to 8:59 a.m.
- 209:00 a.m. to 9:59 a.m.
- 210:00 a.m. to 10:59 a.m.
- 211:00 a.m. to 11:59 a.m.
- 512:00 p.m. to 3:59 p.m.
- 64:00 p.m. to 11:59 p.m.

Occupations of males:
- Percentage of males in management occupations (except farmers):
Here: 21.3% city: 10.7%
- Percentage of males in business and financial operations occupations:
Here: 4.8% city: 5.9%
- Percentage of males in computer and mathematical occupations:
Here: 8.5% city: 6.1%
- Percentage of males in architecture and engineering occupations:
Here: 1.8% city: 2.9%
- Percentage of males in life, physical, and social science occupations:
Here: 5.2% city: 2.3%
- Percentage of males in community and social services occupations:
Here: 1.9% city: 1.6%
- Percentage of males in education, training, and library occupations:
Here: 23.0% city: 5.4%
- Percentage of males in arts, design, entertainment, sports, and media occupations:
Here: 5.0% city: 2.8%
- Percentage of males in healthcare practitioners and technical occupations:
Here: 4.4% city: 4.0%
- Percentage of males in service occupations:
Here: 6.1% city: 14.7%
- Percentage of males in sales and office occupations:
Here: 10.8% city: 14.2%
- Percentage of males in construction, extraction, and maintenance occupations:
Here: 1.7% city: 5.6%
- Percentage of males in production occupations:
Here: 4.2% city: 4.2%
Occupations of females:
- Percentage of females in management occupations (except farmers):
Here: 14.2% city: 10.1%
- Percentage of females in business and financial operations occupations:
Here: 6.4% city: 6.6%
- Percentage of females in computer and mathematical occupations:
Here: 3.3% city: 2.4%
- Percentage of females in life, physical, and social science occupations:
Here: 7.0% city: 2.5%
- Percentage of females in community and social services occupations:
Here: 2.0% city: 3.6%
- Percentage of females in legal occupations:
Here: 6.9% city: 1.8%
- Percentage of females in education, training, and library occupations:
Here: 27.0% city: 10.7%
- Percentage of females in arts, design, entertainment, sports, and media occupations:
Here: 3.0% city: 2.4%
- Percentage of females in healthcare practitioners and technical occupations:
Here: 14.0% city: 9.8%
- Percentage of females in service occupations:
Here: 3.4% city: 20.4%
- Percentage of females in sales and office occupations:
Here: 10.8% city: 22.3%
- Percentage of females in transportation occupations:
Here: 1.4% city: 1.7%
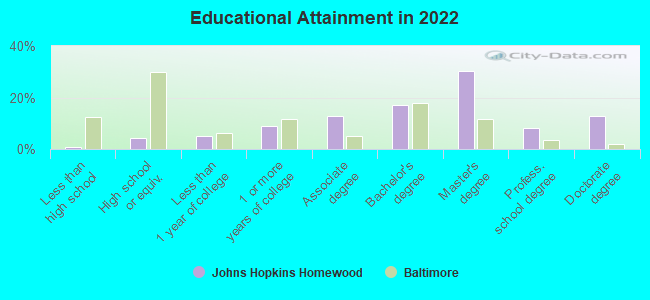
Education in this neighborhood (subdivision or community):
- Percentage of people 3 years and older in K-12 schools:
Johns Hopkins Homewood: 8.5% Baltimore: 14.7%
- Percentage of people 3 years and older in undergraduate colleges:
Johns Hopkins Homewood: 4.3% Baltimore: 6.0%
- Percentage of people 3 years and older in grad. or professional schools:
Johns Hopkins Homewood: 19.1% Baltimore: 2.8%
- Percentage of students K-12 enrolled in private schools:
Johns Hopkins Homewood: 49.2% Baltimore: 12.7%
Percentage of population below poverty level:
| Johns Hopkins Homewood: | 11.0% |
| Baltimore: | 18.5% |
Median year owner moved in (as recorded in 2022):
Median year renter moved in (as recorded in 2022):
| Johns Hopkins Homewood: | 2007 |
| Baltimore: | 2009 |
Median year renter moved in (as recorded in 2022):
| Johns Hopkins Homewood: | 2016 |
| Baltimore: | 2019 |
Percentage of married-couple families with both working:
| Johns Hopkins Homewood: | 68.5% |
| Baltimore: | 79.2% |
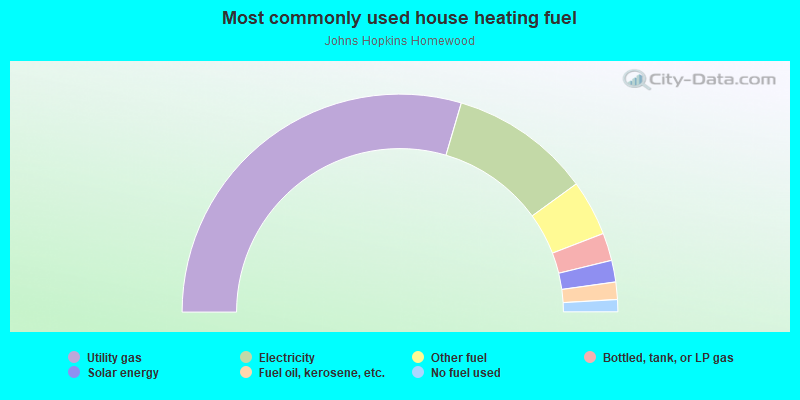
- 59.1%Utility gas
- 20.9%Electricity
- 8.3%Other fuel
- 4.1%Bottled, tank, or LP gas
- 3.2%Solar energy
- 2.6%Fuel oil, kerosene, etc.
- 1.8%No fuel used
Roads and streets:
San Martin Dr
Length: 0.97 miles
Directions: E-W, N-S, SE-NW, SW-NE
Address range: 3300 to 3795
Directions: E-W, N-S, SE-NW, SW-NE
Address range: 3300 to 3795
W University Pkwy
Length: 0.65 miles
Direction: SE-NW
Direction: SE-NW
Wyman Park Dr
Length: 0.14 miles
Directions: N-S, SE-NW, SW-NE
Directions: N-S, SE-NW, SW-NE
Art Museum Dr
Length: 0.12 miles
Directions: E-W, N-S, SW-NE
Directions: E-W, N-S, SW-NE