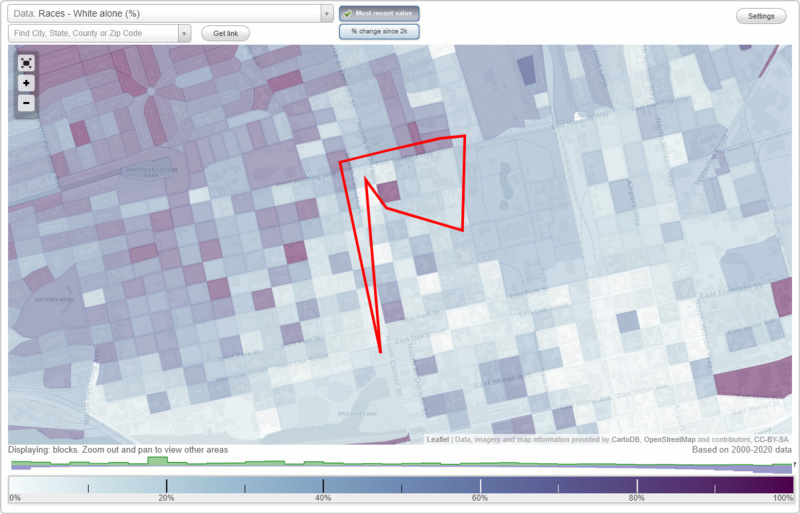
Magnolia neighborhood in Stockton, California (CA), 95202 detailed profile
Settings
X

Business Search - 14 Million verified businesses
Area: 0.305 square miles
Population: 3,767
Population density:
| Magnolia: | 12,345 people per square mile |
| Stockton: | 5,882 people per square mile |

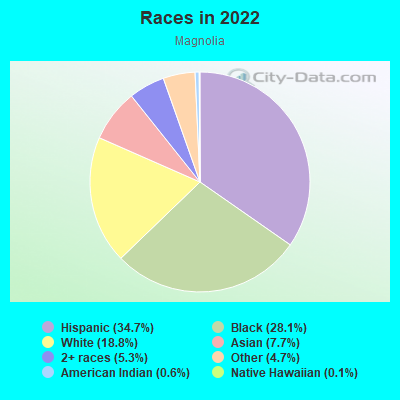
- 1,37634.7%Hispanic or Latino
- 1,11528.1%Black
- 74318.8%White
- 3047.7%Asian
- 2085.3%Two or more races
- 1864.7%Some other race
- 240.6%American Indian
- 50.1%Native Hawaiian and Other
Pacific Islander
Distribution of median household income
![Distribution of median household income]()
- 267Less than $10,000
- 393$10,000 to $19,999
- 197$20,000 to $29,999
- 91$30,000 to $39,999
- 95$40,000 to $49,999
- 86$50,000 to $59,999
- 173$60,000 to $74,999
- 149$75,000 to $99,999
- 74$100,000 to $124,999
- 33$125,000 to $149,999
- 32$150,000 to $199,999
- 52$200,000 or more

Distribution of owner-occupied house/condo value
![Distribution of owner-occupied house/condo value]()
- 49$150,000 to $199,999
- 35$200,000 to $249,999
- 76$250,000 to $299,999
- 74$300,000 to $399,999
- 44$400,000 to $499,999
- 46$500,000 to $749,999
- 14$750,000 to $999,999
- 15$1,000,000 or more

Distribution of rent paid by renters
![Distribution of rent paid by renters]()
- 32Less than $100
- 226$200 to $299
- 250$300 to $399
- 43$400 to $499
- 20$500 to $599
- 262$600 to $699
- 141$700 to $799
- 224$800 to $899
- 254$900 to $999
- 167$1,000 to $1,249
- 288$1,250 to $1,499
- 221$1,500 to $1,999
- 34$2,000 or more

Median rent in 2022:
| Magnolia: | $894 |
| Stockton: | $1,215 |
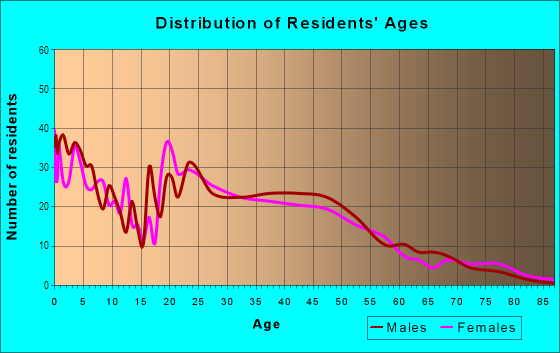
| Males: | 1,805 |
| Females: | 1,961 |
Males:
| This neighborhood: | 34.3 years |
| Whole city: | 33.4 years |
| This neighborhood: | 35.0 years |
| Whole city: | 35.2 years |
Average household size:
| Magnolia: | 2.5 people |
| Stockton: | 3.2 people |
Percentage of family households:
| Magnolia: | 42.7% |
| Stockton: | 51.0% |
| Here: | 13.7% |
| Stockton: | 42.0% |
Percentage of married-couple families with children (among all households):
| Magnolia: | 12.8% |
| Stockton: | 19.2% |
Percentage of single-mother households (among all households):
| Magnolia: | 17.6% |
| Stockton: | 9.1% |
Percentage of never married males 15 years old and over:
Percentage of never married females 15 years old and over:
| Magnolia: | 23.9% |
| Stockton: | 21.6% |
Percentage of never married females 15 years old and over:
| Magnolia: | 28.6% |
| city: | 19.3% |
Percentage of people that speak English not well or not at all:
| Magnolia: | 4.5% |
| Stockton: | 12.0% |
Percentage of people born in this state:
Percentage of people born in another U.S. state:
Percentage of native residents but born outside the U.S.:
Percentage of foreign born residents:
| Here: | 77.1% |
| Stockton: | 66.1% |
Percentage of people born in another U.S. state:
| Magnolia: | 12.6% |
| Stockton: | 7.2% |
Percentage of native residents but born outside the U.S.:
| Here: | 0.8% |
| city: | 1.5% |
Percentage of foreign born residents:
| Here: | 9.5% |
| Stockton: | 25.2% |
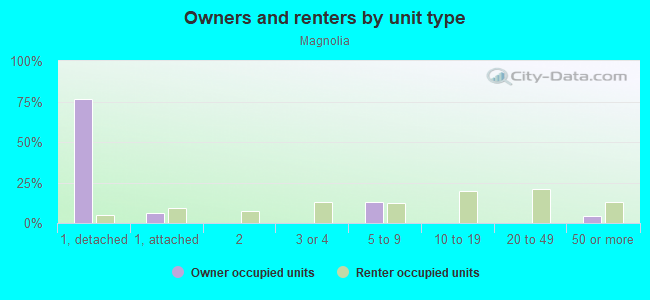
Owner-occupied
Renter-occupied

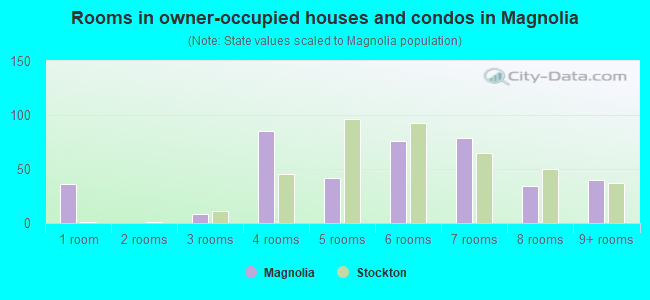
- Rooms in owner-occupied houses and condos in Magnolia
- 361 room
- 02 rooms
- 83 rooms
- 854 rooms
- 425 rooms
- 766 rooms
- 797 rooms
- 348 rooms
- 409+ rooms

- Rooms in renter-occupied apartments in Magnolia
- 2791 room
- 492 rooms
- 4943 rooms
- 4564 rooms
- 495 rooms
- 446 rooms
- 217 rooms
- 468 rooms
- 569+ rooms
Owner-occupied
Renter-occupied
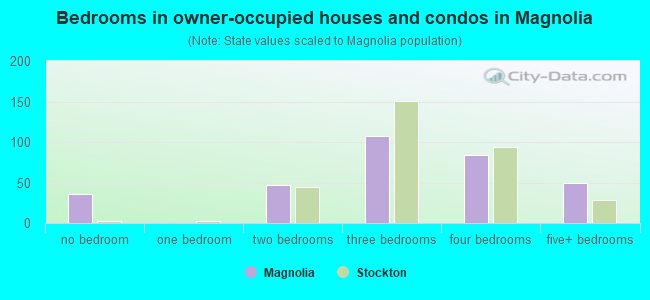
- Bedrooms in owner-occupied houses and condos in Magnolia
- 36no bedroom
- 01 bedroom
- 472 bedrooms
- 1083 bedrooms
- 844 bedrooms
- 495+ bedrooms
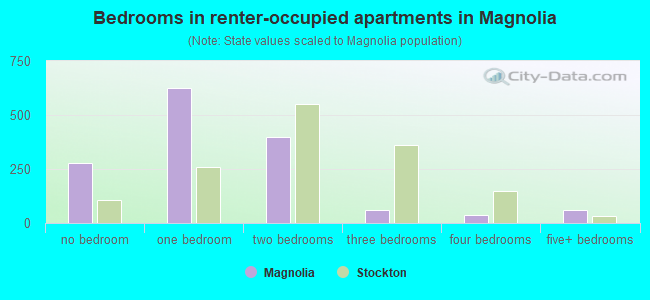
- Bedrooms in renter-occupied apartments in Magnolia
- 279no bedroom
- 6251 bedroom
- 3992 bedrooms
- 583 bedrooms
- 394 bedrooms
- 615+ bedrooms
Average number of cars or other vehicles available in houses/condos:
Average number of cars or other vehicles available in apartments:
| This neighborhood: | 2.1 |
| Stockton: | 2.3 |
Average number of cars or other vehicles available in apartments:
| Here: | 0.9 |
| city: | 1.6 |
Percentage of units with a mortgage:
| Magnolia: | 57.6% |
| Stockton: | 70.5% |
Average estimated value of detached houses in 2022 (12.9% of all units):
| Magnolia: | $346,581 |
| California: | $988,808 |
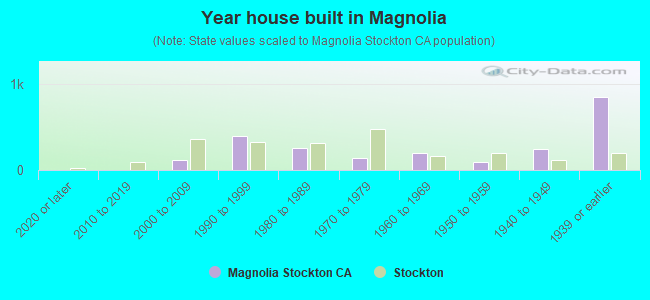
- Year house built in Magnolia
- 02020 or later
- 02010 to 2019
- 1112000 to 2009
- 3941990 to 1999
- 2611980 to 1989
- 1381970 to 1979
- 1951960 to 1969
- 921950 to 1959
- 2421940 to 1949
- 8481939 or earlier
City-data.com crime index for city in 2020 (higher means more crime):
| City: | 505.2 |
| U.S. average: | 219.5 |
Travel time to work (commute)
![Travel time to work (commute)]()
- 18Less than 5 minutes
- 925 to 9 minutes
- 15910 to 14 minutes
- 11315 to 19 minutes
- 15620 to 24 minutes
- 2925 to 29 minutes
- 8630 to 34 minutes
- 2435 to 39 minutes
- 2940 to 44 minutes
- 12645 to 59 minutes
- 7260 to 89 minutes
- 6090 or more minutes

Means of transportation to work
![Means of transportation to work]()
- 73.2%842Drove a car alone
- 8.4%96Carpooled
- 5.3%61Bus
- 1.6%18Bicycle
- 2.2%25Walked
- 7.5%86Other means
- 16.3%187Worked at home

Time leaving home to go to work
![Time leaving home to go to work]()
- 3512:00 a.m. to 4:59 a.m.
- 445:00 a.m. to 5:29 a.m.
- 105:30 a.m. to 5:59 a.m.
- 1266:00 a.m. to 6:29 a.m.
- 336:30 a.m. to 6:59 a.m.
- 1887:00 a.m. to 7:29 a.m.
- 837:30 a.m. to 7:59 a.m.
- 1948:00 a.m. to 8:29 a.m.
- 658:30 a.m. to 8:59 a.m.
- 219:00 a.m. to 9:59 a.m.
- 3510:00 a.m. to 10:59 a.m.
- 411:00 a.m. to 11:59 a.m.
- 4312:00 p.m. to 3:59 p.m.
- 544:00 p.m. to 11:59 p.m.

Occupations of males:
- Percentage of males in management occupations (except farmers):
Here: 7.4% city: 6.6%
- Percentage of males in business and financial operations occupations:
Here: 2.0% city: 2.1%
- Percentage of males in architecture and engineering occupations:
Here: 5.0% city: 1.6%
- Percentage of males in education, training, and library occupations:
Here: 4.1% city: 2.3%
- Percentage of males in arts, design, entertainment, sports, and media occupations:
Here: 2.1% city: 1.4%
- Percentage of males in healthcare practitioners and technical occupations:
Here: 3.9% city: 2.7%
- Percentage of males in service occupations:
Here: 10.2% city: 16.9%
- Percentage of males in sales and office occupations:
Here: 8.5% city: 13.8%
- Percentage of males in farming, fishing, and forestry occupations:
Here: 5.8% city: 4.6%
- Percentage of males in construction, extraction, and maintenance occupations:
Here: 1.4% city: 10.5%
- Percentage of males in production occupations:
Here: 8.0% city: 8.0%
- Percentage of males in transportation occupations:
Here: 20.9% city: 9.6%
- Percentage of males in material moving occupations:
Here: 17.3% city: 10.7%
Occupations of females:
- Percentage of females in management occupations (except farmers):
Here: 16.1% city: 5.9%
- Percentage of females in business and financial operations occupations:
Here: 7.4% city: 5.2%
- Percentage of females in community and social services occupations:
Here: 4.5% city: 2.9%
- Percentage of females in education, training, and library occupations:
Here: 1.7% city: 7.8%
- Percentage of females in healthcare practitioners and technical occupations:
Here: 10.9% city: 8.3%
- Percentage of females in service occupations:
Here: 25.6% city: 24.4%
- Percentage of females in sales and office occupations:
Here: 16.7% city: 26.5%
- Percentage of females in farming, fishing, and forestry occupations:
Here: 3.7% city: 2.1%
- Percentage of females in production occupations:
Here: 1.8% city: 4.6%
- Percentage of females in transportation occupations:
Here: 1.5% city: 1.6%
- Percentage of females in material moving occupations:
Here: 9.4% city: 6.3%
Percentage of people 16-64 in Armed Forces:
| Magnolia: | 0.0% |
| Stockton: | 0.1% |
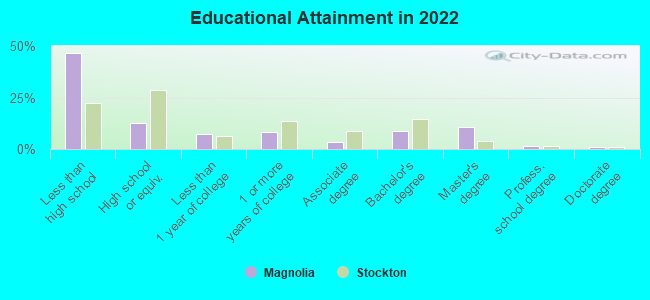
Education in this neighborhood (subdivision or community):
- Percentage of people 3 years and older in K-12 schools:
Magnolia: 25.5% Stockton: 20.8%
- Percentage of people 3 years and older in undergraduate colleges:
Magnolia: 3.1% Stockton: 5.2%
- Percentage of people 3 years and older in grad. or professional schools:
Magnolia: 3.9% Stockton: 1.3%
- Percentage of students K-12 enrolled in private schools:
Magnolia: 23.8% Stockton: 4.2%
Percentage of population below poverty level:
| Magnolia: | 29.2% |
| Stockton: | 14.8% |
Median year renter moved in (as recorded in 2022):
| Magnolia: | 2014 |
| Stockton: | 2018 |
Percentage of married-couple families with both working:
| Magnolia: | 118.4% |
| Stockton: | 67.8% |
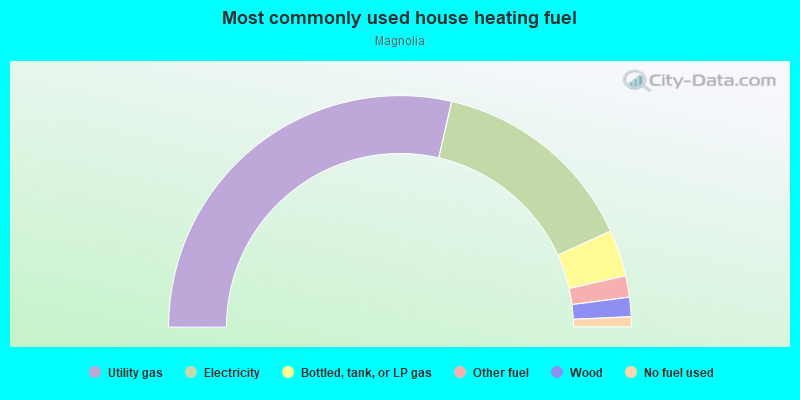
- 57.2%Utility gas
- 29.2%Electricity
- 6.5%Bottled, tank, or LP gas
- 3.0%Other fuel
- 2.7%Wood
- 1.4%No fuel used
Roads and streets:
Center St
Length: 0.63 miles
Direction: N-S
Address range: 600 to 1499
Direction: N-S
Address range: 600 to 1499
N el Dorado St
Length: 0.63 miles
Direction: N-S
Address range: 600 to 1499
Direction: N-S
Address range: 600 to 1499
N Hunter St
Length: 0.63 miles
Direction: N-S
Address range: 600 to 1499
Direction: N-S
Address range: 600 to 1499
N San Joaquin St
Length: 0.63 miles
Direction: N-S
Address range: 600 to 1499
Direction: N-S
Address range: 600 to 1499
California St
Length: 0.63 miles
Direction: N-S
Address range: 600 to 1499
Direction: N-S
Address range: 600 to 1499
N Sutter St
Length: 0.49 miles
Direction: N-S
Address range: 600 to 1299
Direction: N-S
Address range: 600 to 1299
E Oak St
Length: 0.46 miles
Direction: E-W
Address range: 1 to 499
Direction: E-W
Address range: 1 to 499
E Vine St
Length: 0.46 miles
Direction: E-W
Address range: 1 to 499
Direction: E-W
Address range: 1 to 499
E Park St
Length: 0.46 miles
Direction: E-W
Address range: 1 to 499
Direction: E-W
Address range: 1 to 499
E Rose St
Length: 0.46 miles
Direction: E-W
Address range: 1 to 499
Direction: E-W
Address range: 1 to 499
E Harding Way
Length: 0.46 miles
Direction: E-W
Address range: 1 to 499
Direction: E-W
Address range: 1 to 499
Acacia St
Length: 0.46 miles
Direction: E-W
Address range: 1 to 499
Direction: E-W
Address range: 1 to 499
E Magnolia St
Length: 0.46 miles
Direction: E-W
Address range: 1 to 499
Direction: E-W
Address range: 1 to 499
E Poplar St
Length: 0.46 miles
Direction: E-W
Address range: 1 to 499
Direction: E-W
Address range: 1 to 499
Flora St
Length: 0.46 miles
Direction: E-W
Address range: 1 to 499
Direction: E-W
Address range: 1 to 499
E Willow St
Length: 0.27 miles
Direction: E-W
Address range: 1 to 298
Direction: E-W
Address range: 1 to 298