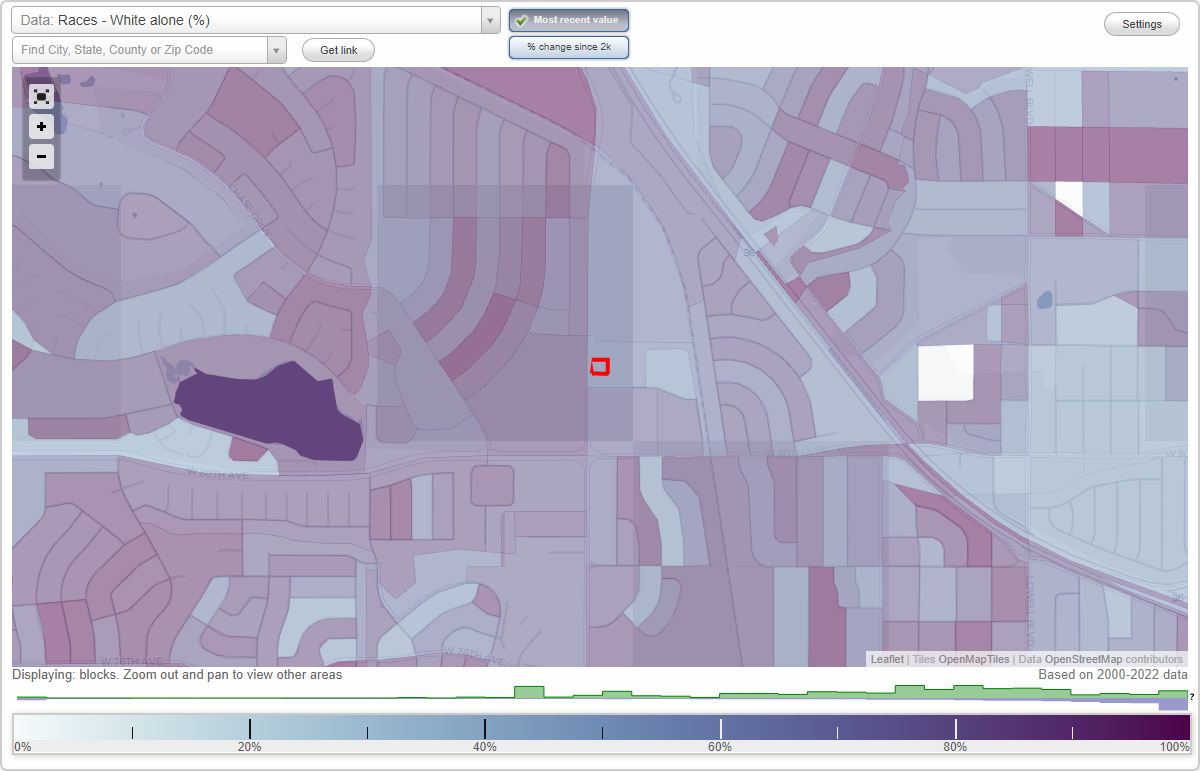
Observatory neighborhood in Westminster, Colorado (CO), 80031 detailed profile
Settings
X

Business Search - 14 Million verified businesses
Area: 0.001 square miles
Population: 381
Population density:
| Observatory: | 333,643 people per square mile |
| Westminster: | 3,636 people per square mile |

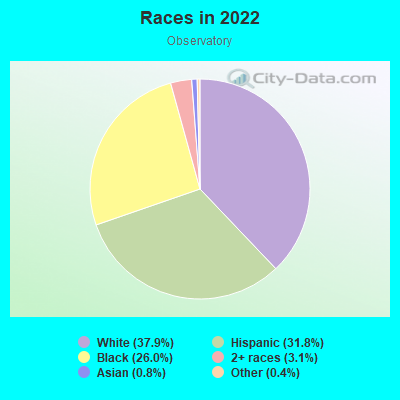
- 19437.9%White
- 16331.8%Hispanic or Latino
- 13326.0%Black
- 163.1%Two or more races
- 40.8%Asian
- 20.4%Some other race
Median household income in 2022:
| Observatory: | $82,980 |
| Westminster: | $101,529 |
Distribution of median household income
![Distribution of median household income]()
- 8Less than $10,000
- 23$10,000 to $19,999
- 4$20,000 to $29,999
- 6$30,000 to $39,999
- 15$40,000 to $49,999
- 4$50,000 to $59,999
- 15$60,000 to $74,999
- 25$75,000 to $99,999
- 34$100,000 to $124,999
- 15$125,000 to $149,999
- 7$150,000 to $199,999
- 19$200,000 or more

Distribution of owner-occupied house/condo value
![Distribution of owner-occupied house/condo value]()
- 3Less than $50,000
- 4$150,000 to $199,999
- 3$200,000 to $249,999
- 9$250,000 to $299,999
- 27$300,000 to $399,999
- 16$400,000 to $499,999
- 28$500,000 to $749,999
- 17$750,000 to $999,999

Distribution of rent paid by renters
![Distribution of rent paid by renters]()
- 3$200 to $299
- 4$800 to $899
- 3$900 to $999
- 22$1,000 to $1,249
- 71$1,250 to $1,499
- 8$1,500 to $1,999
- 14$2,000 or more

Median rent in 2022:
| Observatory: | $1,211 |
| Westminster: | $1,582 |
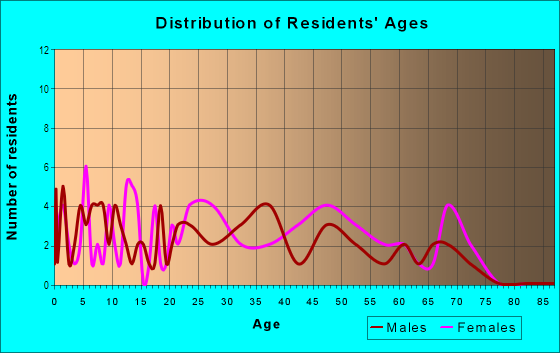
| Males: | 204 |
| Females: | 177 |
Males:
| This neighborhood: | 41.4 years |
| Whole city: | 36.3 years |
| This neighborhood: | 48.4 years |
| Whole city: | 38.1 years |
Average household size:
| Observatory: | 2.2 people |
| Westminster: | 2.4 people |
Percentage of family households:
| Observatory: | 47.1% |
| Westminster: | 47.0% |
| Here: | 40.3% |
| Westminster: | 48.3% |
Percentage of married-couple families with children (among all households):
| Observatory: | 35.3% |
| Westminster: | 29.4% |
Percentage of single-mother households (among all households):
| Observatory: | 203.6% |
| Westminster: | 7.5% |
Percentage of never married males 15 years old and over:
Percentage of never married females 15 years old and over:
| Observatory: | 21.7% |
| Westminster: | 19.5% |
Percentage of never married females 15 years old and over:
| Observatory: | 13.3% |
| city: | 13.2% |
Percentage of people that speak English not well or not at all:
| Observatory: | 1.1% |
| Westminster: | 2.4% |
Percentage of people born in this state:
Percentage of people born in another U.S. state:
Percentage of native residents but born outside the U.S.:
Percentage of foreign born residents:
| Here: | 58.3% |
| Westminster: | 48.5% |
Percentage of people born in another U.S. state:
| Observatory: | 34.6% |
| Westminster: | 40.2% |
Percentage of native residents but born outside the U.S.:
| Here: | 1.6% |
| city: | 1.6% |
Percentage of foreign born residents:
| Here: | 5.5% |
| Westminster: | 9.7% |
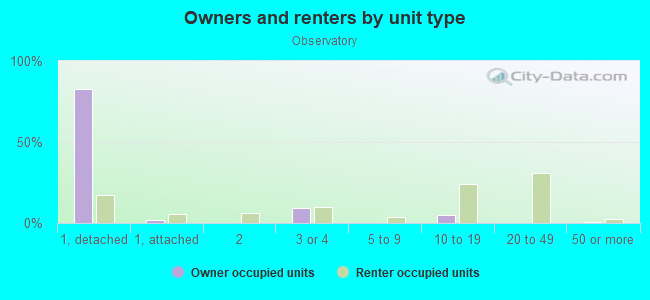
Owner-occupied
Renter-occupied

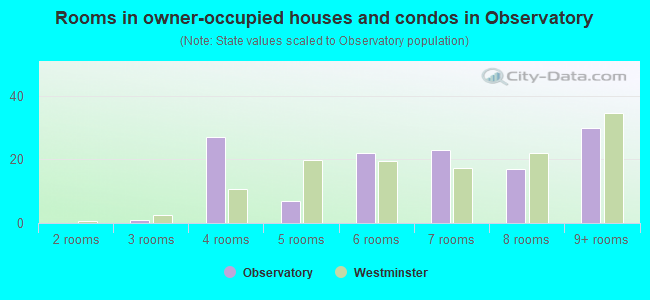
- Rooms in owner-occupied houses and condos in Observatory
- 01 room
- 02 rooms
- 13 rooms
- 274 rooms
- 75 rooms
- 226 rooms
- 237 rooms
- 178 rooms
- 309+ rooms
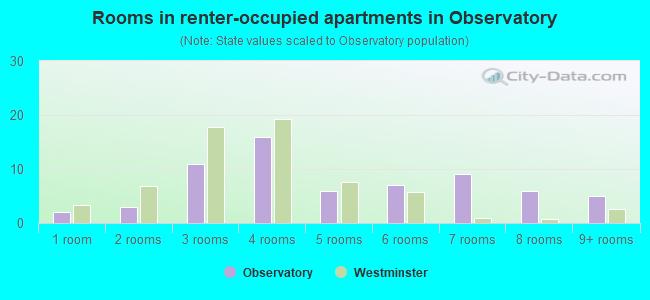
- Rooms in renter-occupied apartments in Observatory
- 21 room
- 32 rooms
- 113 rooms
- 164 rooms
- 65 rooms
- 76 rooms
- 97 rooms
- 68 rooms
- 59+ rooms
Owner-occupied
Renter-occupied
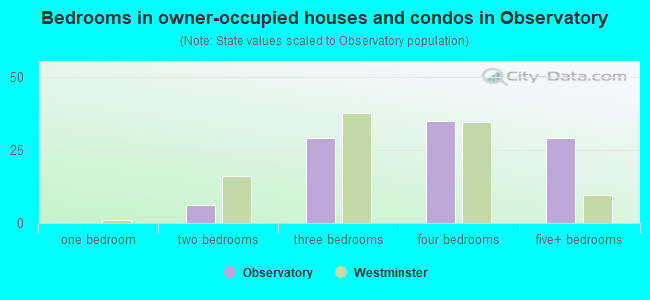
- Bedrooms in owner-occupied houses and condos in Observatory
- 0no bedroom
- 01 bedroom
- 62 bedrooms
- 293 bedrooms
- 354 bedrooms
- 295+ bedrooms
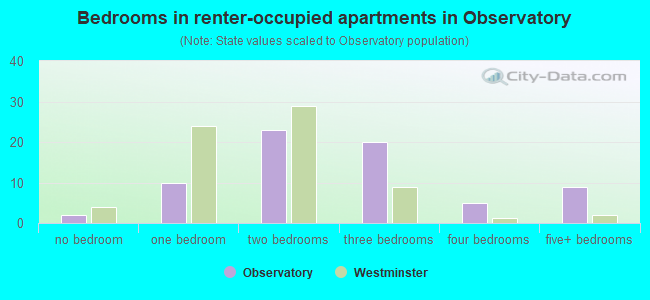
- Bedrooms in renter-occupied apartments in Observatory
- 2no bedroom
- 101 bedroom
- 232 bedrooms
- 203 bedrooms
- 54 bedrooms
- 95+ bedrooms
Average number of cars or other vehicles available in houses/condos:
Average number of cars or other vehicles available in apartments:
| This neighborhood: | 3.0 |
| Westminster: | 2.2 |
Average number of cars or other vehicles available in apartments:
| Here: | 1.8 |
| city: | 1.5 |
Percentage of units with a mortgage:
| Observatory: | 73.8% |
| Westminster: | 78.8% |
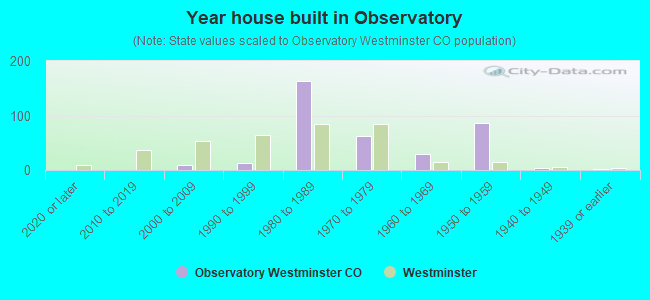
- Year house built in Observatory
- 02020 or later
- 02010 to 2019
- 92000 to 2009
- 131990 to 1999
- 1631980 to 1989
- 631970 to 1979
- 291960 to 1969
- 871950 to 1959
- 31940 to 1949
- 21939 or earlier
City-data.com crime index for city in 2020 (higher means more crime):
| City: | 292.5 |
| U.S. average: | 219.5 |
Travel time to work (commute)
![Travel time to work (commute)]()
- 135 to 9 minutes
- 3510 to 14 minutes
- 3215 to 19 minutes
- 4820 to 24 minutes
- 3225 to 29 minutes
- 4230 to 34 minutes
- 1735 to 39 minutes
- 1240 to 44 minutes
- 5645 to 59 minutes
- 1360 to 89 minutes
- 190 or more minutes

Means of transportation to work
![Means of transportation to work]()
- 89.0%224Drove a car alone
- 4.4%11Carpooled
- 7.5%19Bus
- 0.4%1Light rail, streetcar or trolley
- 11.1%28Walked
- 2.8%7Other means
- 3.2%8Worked at home

Time leaving home to go to work
![Time leaving home to go to work]()
- 2112:00 a.m. to 4:59 a.m.
- 15:00 a.m. to 5:29 a.m.
- 105:30 a.m. to 5:59 a.m.
- 216:00 a.m. to 6:29 a.m.
- 596:30 a.m. to 6:59 a.m.
- 357:00 a.m. to 7:29 a.m.
- 367:30 a.m. to 7:59 a.m.
- 218:00 a.m. to 8:29 a.m.
- 168:30 a.m. to 8:59 a.m.
- 139:00 a.m. to 9:59 a.m.
- 510:00 a.m. to 10:59 a.m.
- 2012:00 p.m. to 3:59 p.m.
- 214:00 p.m. to 11:59 p.m.

Occupations of males:
- Percentage of males in management occupations (except farmers):
Here: 3.3% city: 12.6%
- Percentage of males in business and financial operations occupations:
Here: 6.7% city: 5.3%
- Percentage of males in computer and mathematical occupations:
Here: 6.4% city: 8.8%
- Percentage of males in architecture and engineering occupations:
Here: 2.9% city: 5.6%
- Percentage of males in life, physical, and social science occupations:
Here: 3.3% city: 0.7%
- Percentage of males in community and social services occupations:
Here: 2.9% city: 1.2%
- Percentage of males in legal occupations:
Here: 1.0% city: 0.3%
- Percentage of males in arts, design, entertainment, sports, and media occupations:
Here: 4.4% city: 2.3%
- Percentage of males in healthcare practitioners and technical occupations:
Here: 2.1% city: 2.3%
- Percentage of males in service occupations:
Here: 14.4% city: 10.8%
- Percentage of males in sales and office occupations:
Here: 11.3% city: 19.0%
- Percentage of males in farming, fishing, and forestry occupations:
Here: 4.9% city: 0.3%
- Percentage of males in construction, extraction, and maintenance occupations:
Here: 8.8% city: 8.4%
- Percentage of males in production occupations:
Here: 18.0% city: 5.8%
- Percentage of males in transportation occupations:
Here: 3.1% city: 4.7%
- Percentage of males in material moving occupations:
Here: 5.9% city: 4.7%
Occupations of females:
- Percentage of females in management occupations (except farmers):
Here: 4.8% city: 11.1%
- Percentage of females in business and financial operations occupations:
Here: 3.5% city: 8.5%
- Percentage of females in computer and mathematical occupations:
Here: 8.0% city: 3.0%
- Percentage of females in community and social services occupations:
Here: 2.6% city: 2.9%
- Percentage of females in education, training, and library occupations:
Here: 11.6% city: 7.7%
- Percentage of females in arts, design, entertainment, sports, and media occupations:
Here: 2.3% city: 2.2%
- Percentage of females in healthcare practitioners and technical occupations:
Here: 4.8% city: 8.8%
- Percentage of females in service occupations:
Here: 20.0% city: 19.4%
- Percentage of females in sales and office occupations:
Here: 40.6% city: 25.9%
- Percentage of females in production occupations:
Here: 7.2% city: 2.4%
- Percentage of females in material moving occupations:
Here: 9.7% city: 1.9%
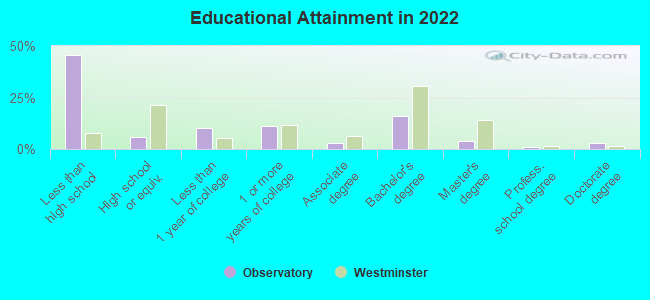
Education in this neighborhood (subdivision or community):
- Percentage of people 3 years and older in K-12 schools:
Observatory: 16.1% Westminster: 14.3%
- Percentage of people 3 years and older in undergraduate colleges:
Observatory: 4.3% Westminster: 2.9%
- Percentage of people 3 years and older in grad. or professional schools:
Observatory: 4.0% Westminster: 2.1%
- Percentage of students K-12 enrolled in private schools:
Observatory: 15.0% Westminster: 9.3%
Percentage of population below poverty level:
| Observatory: | 8.0% |
| Westminster: | 7.4% |
Median year owner moved in (as recorded in 2022):
Median year renter moved in (as recorded in 2022):
| Observatory: | 2029 |
| Westminster: | 2013 |
Median year renter moved in (as recorded in 2022):
| Observatory: | 2035 |
| Westminster: | 2020 |
Percentage of married-couple families with both working:
| Observatory: | 85.7% |
| Westminster: | 77.8% |
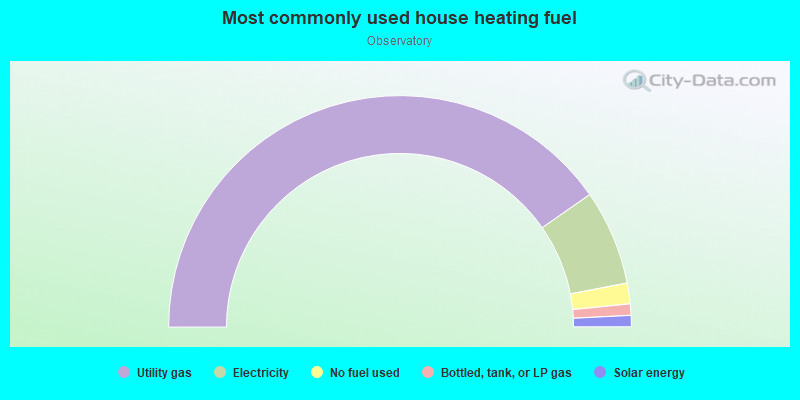
- 80.7%Utility gas
- 13.3%Electricity
- 2.9%No fuel used
- 1.6%Bottled, tank, or LP gas
- 1.6%Solar energy