Original Northwood neighborhood in Baltimore, Maryland (MD), 21218, 21239 detailed profile
Settings
X

Business Search - 14 Million verified businesses
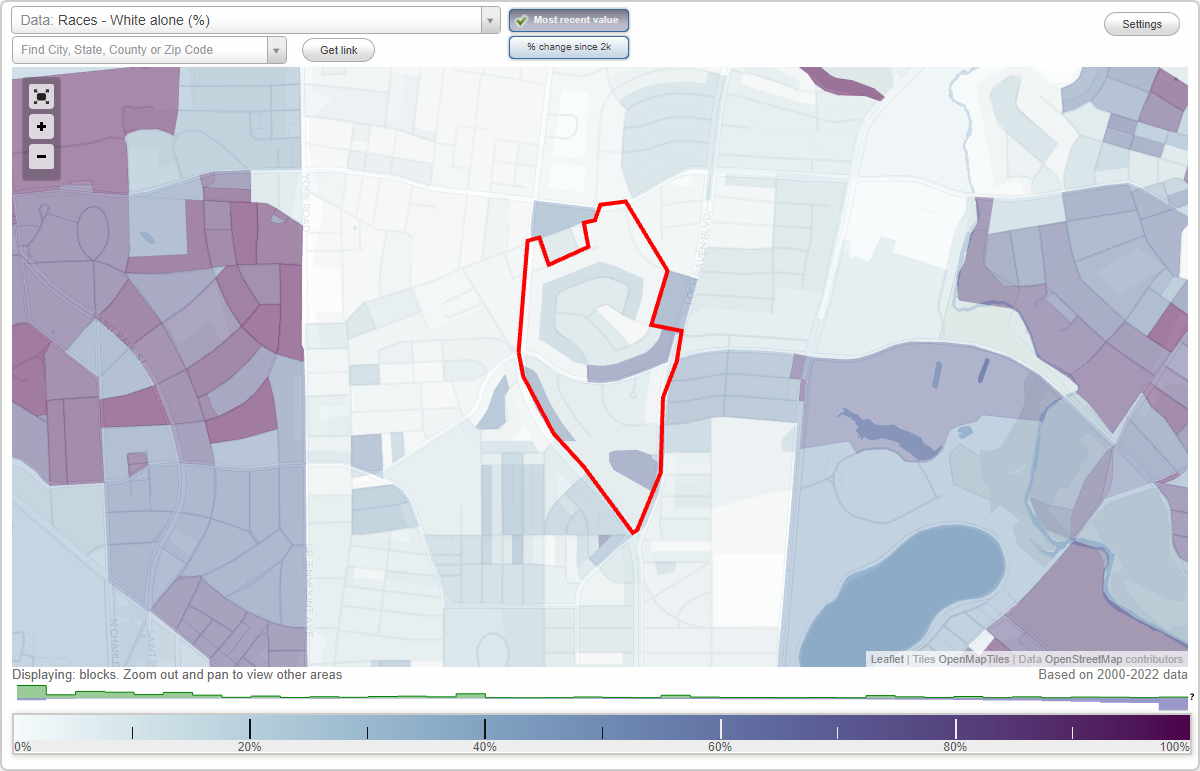
Area: 0.176 square miles
Population: 2,058
Population density:
| Original Northwood: | 11,692 people per square mile |
| Baltimore: | 7,053 people per square mile |

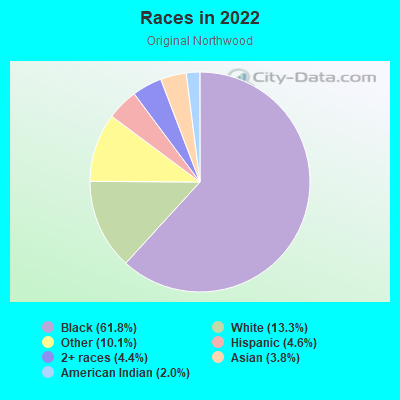
- 1,46061.8%Black
- 31413.3%White
- 23810.1%Some other race
- 1094.6%Hispanic or Latino
- 1034.4%Two or more races
- 903.8%Asian
- 482.0%American Indian
Distribution of median household income
![Distribution of median household income]()
- 26Less than $10,000
- 73$10,000 to $19,999
- 68$20,000 to $29,999
- 60$30,000 to $39,999
- 105$40,000 to $49,999
- 20$50,000 to $59,999
- 28$60,000 to $74,999
- 33$75,000 to $99,999
- 68$100,000 to $124,999
- 12$125,000 to $149,999
- 87$150,000 to $199,999
- 118$200,000 or more

Distribution of owner-occupied house/condo value
![Distribution of owner-occupied house/condo value]()
- 125Less than $50,000
- 217$50,000 to $99,999
- 49$100,000 to $149,999
- 58$150,000 to $199,999
- 24$200,000 to $249,999
- 74$250,000 to $299,999
- 123$300,000 to $399,999
- 40$400,000 to $499,999
- 13$500,000 to $749,999
- 37$750,000 to $999,999
- 18$1,000,000 or more

Distribution of rent paid by renters
![Distribution of rent paid by renters]()
- 25Less than $100
- 63$100 to $199
- 33$200 to $299
- 16$300 to $399
- 45$400 to $499
- 19$500 to $599
- 15$600 to $699
- 70$700 to $799
- 84$800 to $899
- 4$900 to $999
- 20$1,000 to $1,249
- 125$1,250 to $1,499
- 165$1,500 to $1,999
- 34$2,000 or more

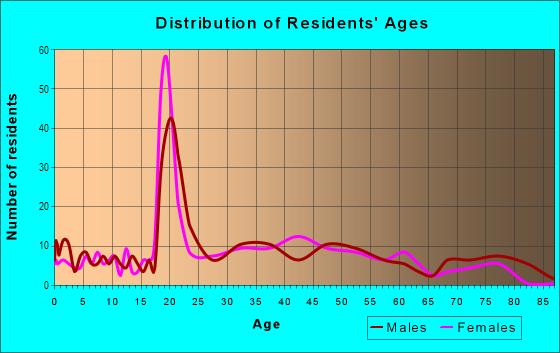
| Males: | 859 |
| Females: | 1,199 |
Males:
| This neighborhood: | 30.8 years |
| Whole city: | 35.0 years |
| This neighborhood: | 34.1 years |
| Whole city: | 38.2 years |
Average household size:
| Original Northwood: | 13.8 people |
| Baltimore: | 2.2 people |
Percentage of family households:
| Original Northwood: | 47.6% |
| Baltimore: | 34.2% |
| Here: | 36.2% |
| Baltimore: | 23.3% |
Percentage of married-couple families with children (among all households):
| Original Northwood: | 15.5% |
| Baltimore: | 22.4% |
Percentage of single-mother households (among all households):
| Original Northwood: | 20.7% |
| Baltimore: | 18.7% |
Percentage of never married males 15 years old and over:
Percentage of never married females 15 years old and over:
| Original Northwood: | 27.7% |
| Baltimore: | 25.1% |
Percentage of never married females 15 years old and over:
| Original Northwood: | 40.5% |
| city: | 27.5% |
Percentage of people that speak English not well or not at all:
| Original Northwood: | 0.1% |
| Baltimore: | 2.3% |
Percentage of people born in this state:
Percentage of people born in another U.S. state:
Percentage of native residents but born outside the U.S.:
Percentage of foreign born residents:
| Here: | 51.8% |
| Baltimore: | 64.4% |
Percentage of people born in another U.S. state:
| Original Northwood: | 39.3% |
| Baltimore: | 25.0% |
Percentage of native residents but born outside the U.S.:
| Here: | 1.3% |
| city: | 0.9% |
Percentage of foreign born residents:
| Here: | 7.6% |
| Baltimore: | 9.7% |
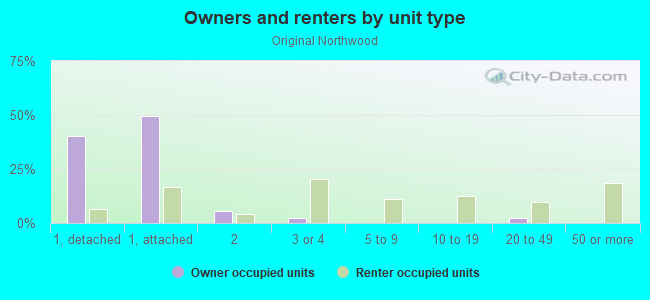
Owner-occupied
Renter-occupied

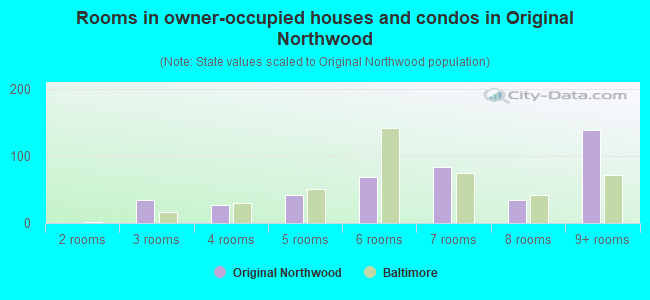
- Rooms in owner-occupied houses and condos in Original Northwood
- 01 room
- 02 rooms
- 353 rooms
- 274 rooms
- 415 rooms
- 686 rooms
- 837 rooms
- 348 rooms
- 1399+ rooms
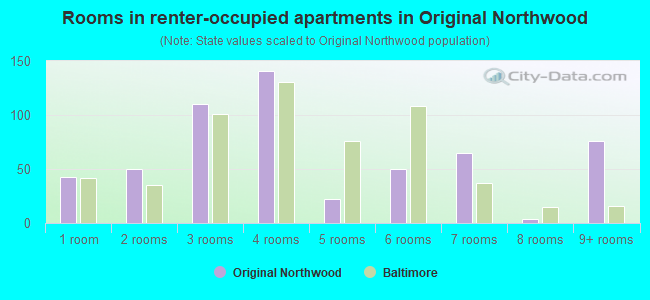
- Rooms in renter-occupied apartments in Original Northwood
- 431 room
- 502 rooms
- 1103 rooms
- 1414 rooms
- 225 rooms
- 506 rooms
- 657 rooms
- 48 rooms
- 769+ rooms
Owner-occupied
Renter-occupied
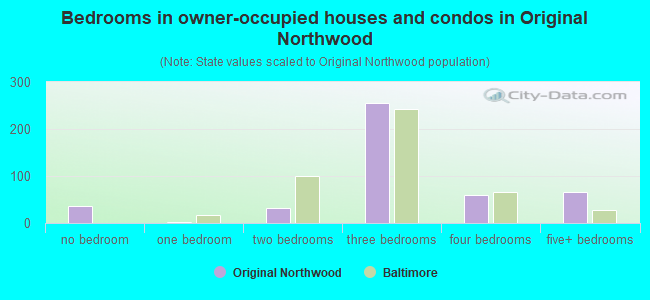
- Bedrooms in owner-occupied houses and condos in Original Northwood
- 36no bedroom
- 21 bedroom
- 322 bedrooms
- 2553 bedrooms
- 594 bedrooms
- 675+ bedrooms
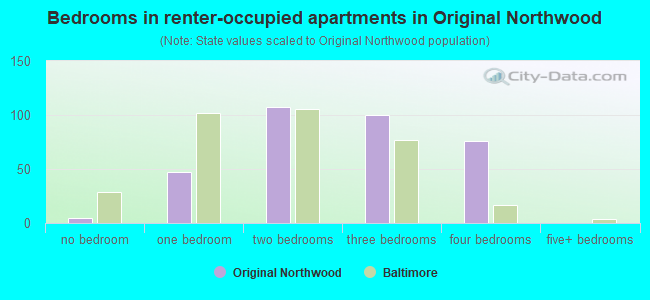
- Bedrooms in renter-occupied apartments in Original Northwood
- 5no bedroom
- 471 bedroom
- 1072 bedrooms
- 1003 bedrooms
- 764 bedrooms
- 05+ bedrooms
Average number of cars or other vehicles available in houses/condos:
Average number of cars or other vehicles available in apartments:
| This neighborhood: | 1.6 |
| Baltimore: | 1.5 |
Average number of cars or other vehicles available in apartments:
| Here: | 1.0 |
| city: | 0.8 |
Percentage of units with a mortgage:
| Original Northwood: | 66.0% |
| Baltimore: | 64.3% |
Housing prices:
- Average estimated value of detached houses in 2022 (31.5% of all units):
Original Northwood: $47,243 Baltimore: $350,815
- Average estimated value of townhouses or other attached units in 2022 (48.9% of all units):
This neighborhood: $233,283 city: $206,258
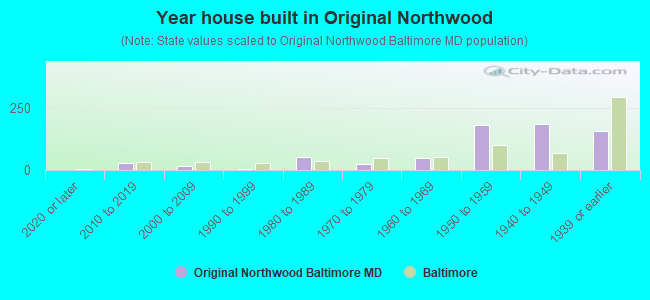
- Year house built in Original Northwood
- 02020 or later
- 302010 to 2019
- 182000 to 2009
- 41990 to 1999
- 531980 to 1989
- 251970 to 1979
- 481960 to 1969
- 1811950 to 1959
- 1861940 to 1949
- 1561939 or earlier
Travel time to work (commute)
![Travel time to work (commute)]()
- 21Less than 5 minutes
- 1045 to 9 minutes
- 3810 to 14 minutes
- 9815 to 19 minutes
- 12420 to 24 minutes
- 3925 to 29 minutes
- 5830 to 34 minutes
- 935 to 39 minutes
- 7840 to 44 minutes
- 3845 to 59 minutes
- 4460 to 89 minutes
- 1490 or more minutes

Means of transportation to work
![Means of transportation to work]()
- 62.8%611Drove a car alone
- 12.5%122Carpooled
- 1.6%16Bus
- 1.0%10Long-distance train or commuter rail
- 0.4%4Light rail, streetcar or trolley
- 0.8%8Taxi
- 0.2%2Bicycle
- 14.5%141Walked
- 0.7%7Other means
- 12.5%122Worked at home

Time leaving home to go to work
![Time leaving home to go to work]()
- 2012:00 a.m. to 4:59 a.m.
- 145:00 a.m. to 5:29 a.m.
- 95:30 a.m. to 5:59 a.m.
- 306:00 a.m. to 6:29 a.m.
- 266:30 a.m. to 6:59 a.m.
- 447:00 a.m. to 7:29 a.m.
- 757:30 a.m. to 7:59 a.m.
- 878:00 a.m. to 8:29 a.m.
- 358:30 a.m. to 8:59 a.m.
- 529:00 a.m. to 9:59 a.m.
- 5210:00 a.m. to 10:59 a.m.
- 1911:00 a.m. to 11:59 a.m.
- 6912:00 p.m. to 3:59 p.m.
- 844:00 p.m. to 11:59 p.m.

Occupations of males:
- Percentage of males in management occupations (except farmers):
Here: 17.9% city: 10.7%
- Percentage of males in business and financial operations occupations:
Here: 1.5% city: 5.9%
- Percentage of males in architecture and engineering occupations:
Here: 6.7% city: 2.9%
- Percentage of males in life, physical, and social science occupations:
Here: 2.3% city: 2.3%
- Percentage of males in community and social services occupations:
Here: 1.4% city: 1.6%
- Percentage of males in education, training, and library occupations:
Here: 11.1% city: 5.4%
- Percentage of males in arts, design, entertainment, sports, and media occupations:
Here: 6.7% city: 2.8%
- Percentage of males in service occupations:
Here: 25.5% city: 14.7%
- Percentage of males in sales and office occupations:
Here: 7.6% city: 14.2%
- Percentage of males in construction, extraction, and maintenance occupations:
Here: 13.2% city: 5.6%
- Percentage of males in transportation occupations:
Here: 1.1% city: 6.8%
- Percentage of males in material moving occupations:
Here: 4.0% city: 7.0%
Occupations of females:
- Percentage of females in management occupations (except farmers):
Here: 12.8% city: 10.1%
- Percentage of females in business and financial operations occupations:
Here: 3.0% city: 6.6%
- Percentage of females in computer and mathematical occupations:
Here: 6.0% city: 2.4%
- Percentage of females in architecture and engineering occupations:
Here: 1.4% city: 0.9%
- Percentage of females in community and social services occupations:
Here: 3.0% city: 3.6%
- Percentage of females in legal occupations:
Here: 7.2% city: 1.8%
- Percentage of females in education, training, and library occupations:
Here: 8.4% city: 10.7%
- Percentage of females in arts, design, entertainment, sports, and media occupations:
Here: 3.0% city: 2.4%
- Percentage of females in healthcare practitioners and technical occupations:
Here: 12.2% city: 9.8%
- Percentage of females in service occupations:
Here: 22.0% city: 20.4%
- Percentage of females in sales and office occupations:
Here: 18.5% city: 22.3%
- Percentage of females in material moving occupations:
Here: 1.8% city: 1.9%
Percentage of people 16-64 in Armed Forces:
| Original Northwood: | 0.0% |
| Baltimore: | 0.4% |
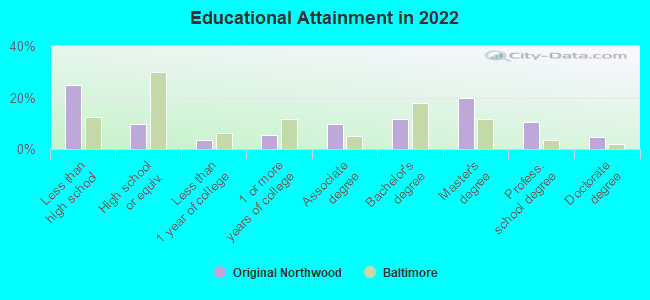
Education in this neighborhood (subdivision or community):
- Percentage of people 3 years and older in K-12 schools:
Original Northwood: 15.4% Baltimore: 14.7%
- Percentage of people 3 years and older in undergraduate colleges:
Original Northwood: 50.7% Baltimore: 6.0%
- Percentage of people 3 years and older in grad. or professional schools:
Original Northwood: 3.7% Baltimore: 2.8%
- Percentage of students K-12 enrolled in private schools:
Original Northwood: 35.1% Baltimore: 12.7%
Percentage of population below poverty level:
| Original Northwood: | 13.7% |
| Baltimore: | 18.5% |
Median year owner moved in (as recorded in 2022):
Median year renter moved in (as recorded in 2022):
| Original Northwood: | 1999 |
| Baltimore: | 2009 |
Median year renter moved in (as recorded in 2022):
| Original Northwood: | 2017 |
| Baltimore: | 2019 |
Percentage of married-couple families with both working:
| Original Northwood: | 101.9% |
| Baltimore: | 79.2% |
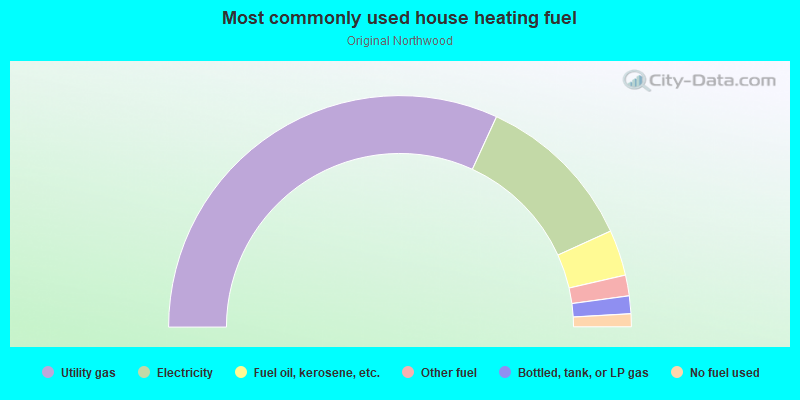
- 63.7%Utility gas
- 22.7%Electricity
- 6.4%Fuel oil, kerosene, etc.
- 2.9%Other fuel
- 2.5%Bottled, tank, or LP gas
- 1.8%No fuel used
Highways in this neighborhood:
State Hwy 542 (Loch Raven Blvd)
Length: 0.54 miles
Directions: N-S, SW-NE
Address range: 3816 to 3900
Directions: N-S, SW-NE
Address range: 3816 to 3900
Roads and streets:
Argonne Dr
Length: 0.47 miles
Directions: E-W, SE-NW
Address range: 1000 to 1379
Directions: E-W, SE-NW
Address range: 1000 to 1379
Southview Rd
Length: 0.43 miles
Directions: E-W, N-S, SE-NW, SW-NE
Address range: 1200 to 1399
Directions: E-W, N-S, SE-NW, SW-NE
Address range: 1200 to 1399
Havenwood Rd
Length: 0.30 miles
Directions: E-W, SE-NW, SW-NE
Address range: 1200 to 1461
Directions: E-W, SE-NW, SW-NE
Address range: 1200 to 1461
Westview Rd
Length: 0.27 miles
Directions: E-W, N-S, SE-NW, SW-NE
Address range: 4100 to 4299
Directions: E-W, N-S, SE-NW, SW-NE
Address range: 4100 to 4299
The Alameda
Length: 0.26 miles
Direction: N-S
Address range: 4100 to 4399
Direction: N-S
Address range: 4100 to 4399
Roundhill Rd
Length: 0.23 miles
Directions: E-W, N-S, SE-NW
Address range: 1200 to 1477
Directions: E-W, N-S, SE-NW
Address range: 1200 to 1477
Marble Hall Rd
Length: 0.21 miles
Directions: E-W, N-S, SE-NW
Address range: 4400 to 4499
Directions: E-W, N-S, SE-NW
Address range: 4400 to 4499
Springfield Ave
Length: 0.21 miles
Direction: E-W
Address range: 1015 to 1299
Direction: E-W
Address range: 1015 to 1299
Deepwood Rd
Length: 0.18 miles
Directions: N-S, SE-NW
Address range: 3900 to 4099
Directions: N-S, SE-NW
Address range: 3900 to 4099
Northview Rd
Length: 0.14 miles
Direction: E-W
Address range: 1200 to 1399
Direction: E-W
Address range: 1200 to 1399
Kelway Rd
Length: 0.13 miles
Direction: N-S
Address range: 4200 to 4299
Direction: N-S
Address range: 4200 to 4299
Eastview Rd
Length: 0.12 miles
Directions: E-W, N-S, SE-NW
Address range: 4200 to 4299
Directions: E-W, N-S, SE-NW
Address range: 4200 to 4299
Roundtop Rd
Length: 0.05 miles
Direction: N-S
Address range: 4000 to 4099
Direction: N-S
Address range: 4000 to 4099