Pen Lucy neighborhood in Baltimore, Maryland (MD), 21212, 21218 detailed profile
Settings
X

Business Search - 14 Million verified businesses
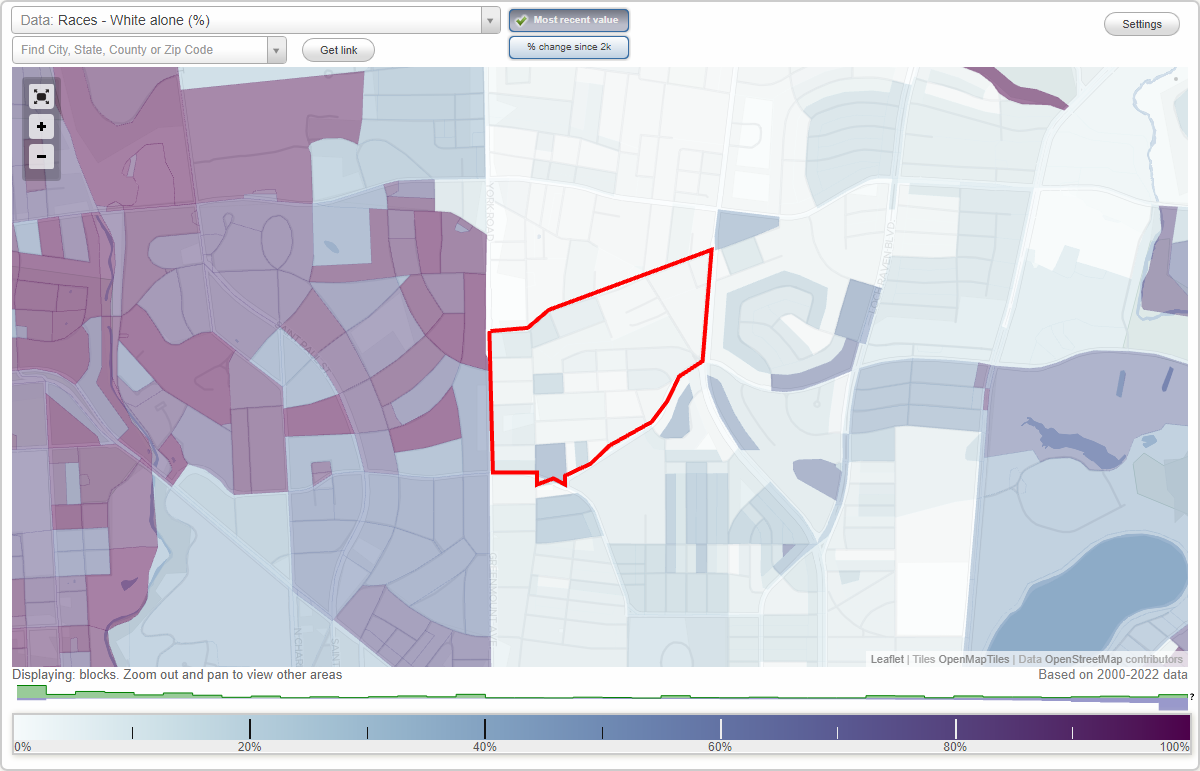
Area: 0.169 square miles
Population: 3,324
Population density:
| Pen Lucy: | 19,694 people per square mile |
| Baltimore: | 7,053 people per square mile |

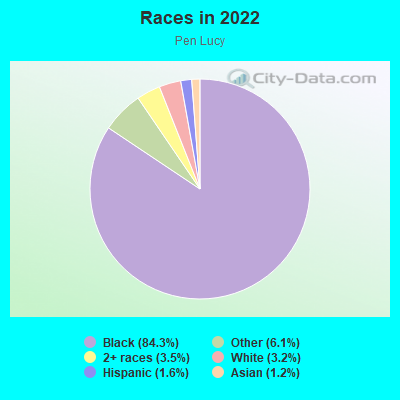
- 3,05184.3%Black
- 2196.1%Some other race
- 1273.5%Two or more races
- 1173.2%White
- 591.6%Hispanic or Latino
- 451.2%Asian
Distribution of median household income
![Distribution of median household income]()
- 210Less than $10,000
- 237$10,000 to $19,999
- 202$20,000 to $29,999
- 282$30,000 to $39,999
- 201$40,000 to $49,999
- 109$50,000 to $59,999
- 248$60,000 to $74,999
- 158$75,000 to $99,999
- 202$100,000 to $124,999
- 91$125,000 to $149,999
- 111$150,000 to $199,999
- 44$200,000 or more

Distribution of owner-occupied house/condo value
![Distribution of owner-occupied house/condo value]()
- 75Less than $50,000
- 321$50,000 to $99,999
- 233$100,000 to $149,999
- 160$150,000 to $199,999
- 94$200,000 to $249,999
- 75$250,000 to $299,999
- 93$300,000 to $399,999
- 21$500,000 to $749,999
- 46$750,000 to $999,999
- 25$1,000,000 or more

Distribution of rent paid by renters
![Distribution of rent paid by renters]()
- 124Less than $100
- 231$100 to $199
- 187$200 to $299
- 60$300 to $399
- 130$400 to $499
- 74$500 to $599
- 72$600 to $699
- 61$700 to $799
- 274$800 to $899
- 147$900 to $999
- 272$1,000 to $1,249
- 140$1,250 to $1,499
- 58$1,500 to $1,999
- 14$2,000 or more

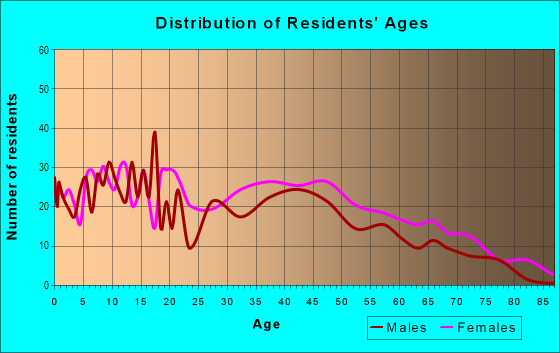
| Males: | 1,609 |
| Females: | 1,715 |
Males:
| This neighborhood: | 36.6 years |
| Whole city: | 35.0 years |
| This neighborhood: | 46.2 years |
| Whole city: | 38.2 years |
Average household size:
| Pen Lucy: | 7.5 people |
| Baltimore: | 2.2 people |
Percentage of family households:
| Pen Lucy: | 31.2% |
| Baltimore: | 34.2% |
| Here: | 20.5% |
| Baltimore: | 23.3% |
Percentage of married-couple families with children (among all households):
| Pen Lucy: | 15.6% |
| Baltimore: | 22.4% |
Percentage of single-mother households (among all households):
| Pen Lucy: | 26.5% |
| Baltimore: | 18.7% |
Percentage of never married males 15 years old and over:
Percentage of never married females 15 years old and over:
| Pen Lucy: | 29.1% |
| Baltimore: | 25.1% |
Percentage of never married females 15 years old and over:
| Pen Lucy: | 24.7% |
| city: | 27.5% |
Percentage of people that speak English not well or not at all:
| Pen Lucy: | 2.5% |
| Baltimore: | 2.3% |
Percentage of people born in this state:
Percentage of people born in another U.S. state:
Percentage of native residents but born outside the U.S.:
Percentage of foreign born residents:
| Here: | 74.6% |
| Baltimore: | 64.4% |
Percentage of people born in another U.S. state:
| Pen Lucy: | 15.2% |
| Baltimore: | 25.0% |
Percentage of native residents but born outside the U.S.:
| Here: | 0.8% |
| city: | 0.9% |
Percentage of foreign born residents:
| Here: | 9.4% |
| Baltimore: | 9.7% |
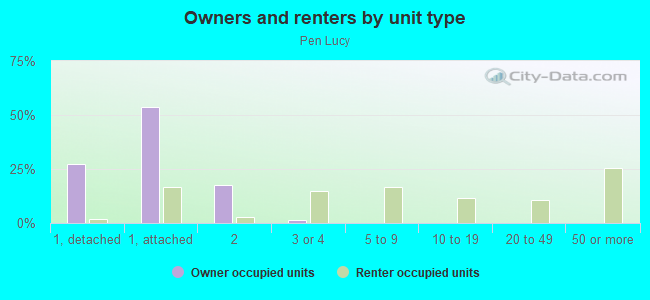
Owner-occupied
Renter-occupied

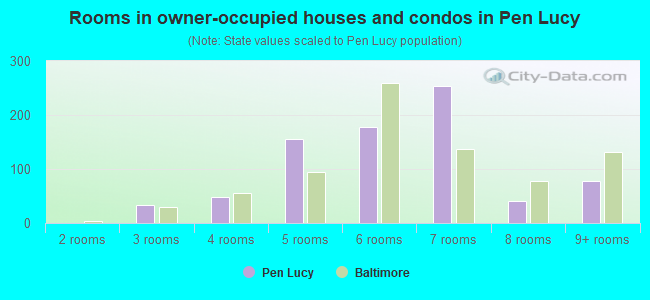
- Rooms in owner-occupied houses and condos in Pen Lucy
- 01 room
- 02 rooms
- 343 rooms
- 484 rooms
- 1565 rooms
- 1786 rooms
- 2537 rooms
- 408 rooms
- 789+ rooms
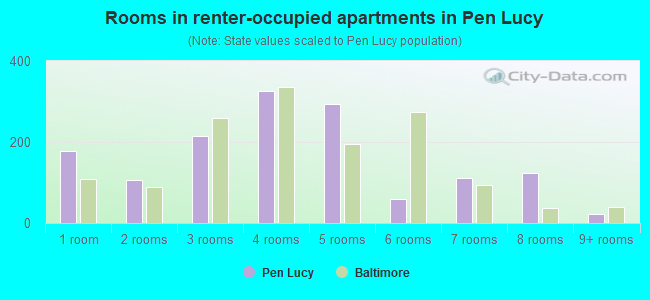
- Rooms in renter-occupied apartments in Pen Lucy
- 1771 room
- 1052 rooms
- 2163 rooms
- 3274 rooms
- 2935 rooms
- 596 rooms
- 1127 rooms
- 1248 rooms
- 219+ rooms
Owner-occupied
Renter-occupied
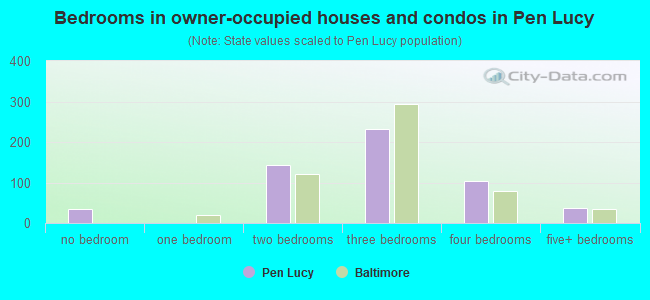
- Bedrooms in owner-occupied houses and condos in Pen Lucy
- 34no bedroom
- 01 bedroom
- 1422 bedrooms
- 2323 bedrooms
- 1034 bedrooms
- 365+ bedrooms
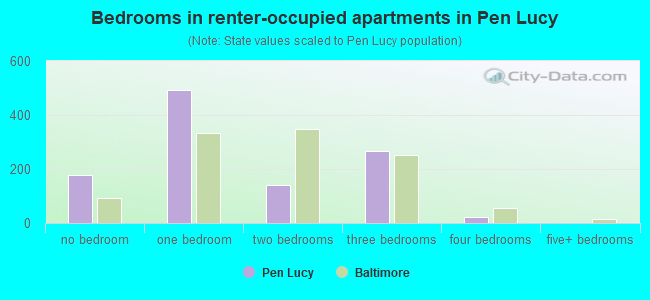
- Bedrooms in renter-occupied apartments in Pen Lucy
- 177no bedroom
- 4911 bedroom
- 1422 bedrooms
- 2673 bedrooms
- 224 bedrooms
- 05+ bedrooms
Average number of cars or other vehicles available in houses/condos:
Average number of cars or other vehicles available in apartments:
| This neighborhood: | 1.4 |
| Baltimore: | 1.5 |
Average number of cars or other vehicles available in apartments:
| Here: | 0.5 |
| city: | 0.8 |
Percentage of units with a mortgage:
| Pen Lucy: | 77.7% |
| Baltimore: | 64.3% |
Housing prices:
- Average estimated value of detached houses in 2022 (12.1% of all units):
Pen Lucy: $118,495 Baltimore: $350,815
- Average estimated value of townhouses or other attached units in 2022 (41.6% of all units):
This neighborhood: $187,508 city: $206,258
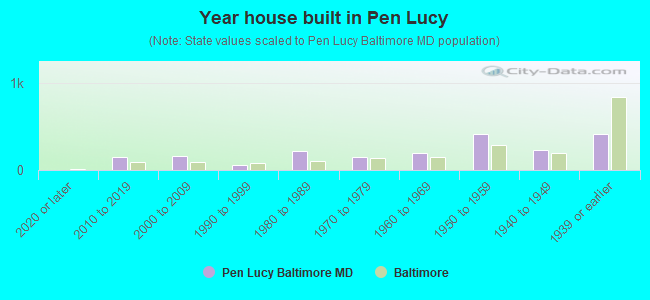
- Year house built in Pen Lucy
- 02020 or later
- 1472010 to 2019
- 1632000 to 2009
- 611990 to 1999
- 2211980 to 1989
- 1511970 to 1979
- 1981960 to 1969
- 4121950 to 1959
- 2291940 to 1949
- 4091939 or earlier
Travel time to work (commute)
![Travel time to work (commute)]()
- 11Less than 5 minutes
- 605 to 9 minutes
- 7110 to 14 minutes
- 14015 to 19 minutes
- 13920 to 24 minutes
- 6125 to 29 minutes
- 26830 to 34 minutes
- 1135 to 39 minutes
- 5540 to 44 minutes
- 19345 to 59 minutes
- 8160 to 89 minutes
- 3390 or more minutes

Means of transportation to work
![Means of transportation to work]()
- 65.9%1,006Drove a car alone
- 6.2%94Carpooled
- 10.9%167Bus
- 1.5%23Bicycle
- 11.7%179Walked
- 11.9%182Worked at home

Time leaving home to go to work
![Time leaving home to go to work]()
- 5912:00 a.m. to 4:59 a.m.
- 185:00 a.m. to 5:29 a.m.
- 275:30 a.m. to 5:59 a.m.
- 436:00 a.m. to 6:29 a.m.
- 1316:30 a.m. to 6:59 a.m.
- 737:00 a.m. to 7:29 a.m.
- 1707:30 a.m. to 7:59 a.m.
- 1318:00 a.m. to 8:29 a.m.
- 248:30 a.m. to 8:59 a.m.
- 859:00 a.m. to 9:59 a.m.
- 4510:00 a.m. to 10:59 a.m.
- 111:00 a.m. to 11:59 a.m.
- 9112:00 p.m. to 3:59 p.m.
- 954:00 p.m. to 11:59 p.m.

Occupations of males:
- Percentage of males in management occupations (except farmers):
Here: 13.9% city: 10.7%
- Percentage of males in business and financial operations occupations:
Here: 6.2% city: 5.9%
- Percentage of males in computer and mathematical occupations:
Here: 2.1% city: 6.1%
- Percentage of males in community and social services occupations:
Here: 4.4% city: 1.6%
- Percentage of males in arts, design, entertainment, sports, and media occupations:
Here: 2.8% city: 2.8%
- Percentage of males in healthcare practitioners and technical occupations:
Here: 2.9% city: 4.0%
- Percentage of males in service occupations:
Here: 17.6% city: 14.7%
- Percentage of males in sales and office occupations:
Here: 10.3% city: 14.2%
- Percentage of males in construction, extraction, and maintenance occupations:
Here: 7.3% city: 5.6%
- Percentage of males in production occupations:
Here: 3.0% city: 4.2%
- Percentage of males in transportation occupations:
Here: 3.3% city: 6.8%
- Percentage of males in material moving occupations:
Here: 18.8% city: 7.0%
Occupations of females:
- Percentage of females in management occupations (except farmers):
Here: 7.3% city: 10.1%
- Percentage of females in business and financial operations occupations:
Here: 10.7% city: 6.6%
- Percentage of females in computer and mathematical occupations:
Here: 1.8% city: 2.4%
- Percentage of females in education, training, and library occupations:
Here: 13.0% city: 10.7%
- Percentage of females in healthcare practitioners and technical occupations:
Here: 13.2% city: 9.8%
- Percentage of females in service occupations:
Here: 22.3% city: 20.4%
- Percentage of females in sales and office occupations:
Here: 18.7% city: 22.3%
- Percentage of females in production occupations:
Here: 5.3% city: 2.3%
- Percentage of females in transportation occupations:
Here: 2.5% city: 1.7%
- Percentage of females in material moving occupations:
Here: 5.1% city: 1.9%
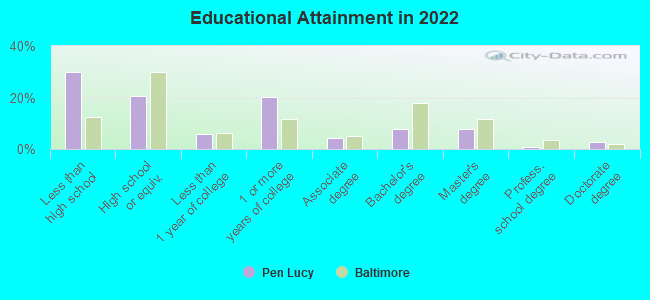
Education in this neighborhood (subdivision or community):
- Percentage of people 3 years and older in K-12 schools:
Pen Lucy: 37.4% Baltimore: 14.7%
- Percentage of people 3 years and older in undergraduate colleges:
Pen Lucy: 8.8% Baltimore: 6.0%
- Percentage of people 3 years and older in grad. or professional schools:
Pen Lucy: 2.9% Baltimore: 2.8%
- Percentage of students K-12 enrolled in private schools:
Pen Lucy: 13.0% Baltimore: 12.7%
Percentage of population below poverty level:
| Pen Lucy: | 22.4% |
| Baltimore: | 18.5% |
Median year renter moved in (as recorded in 2022):
| Pen Lucy: | 2018 |
| Baltimore: | 2019 |
Percentage of married-couple families with both working:
| Pen Lucy: | 115.4% |
| Baltimore: | 79.2% |
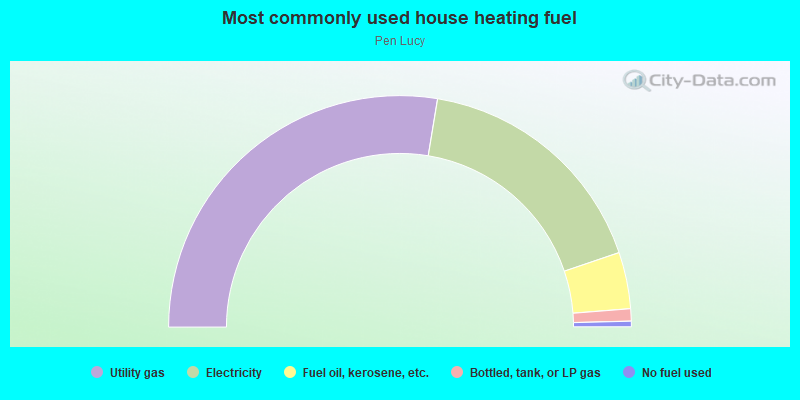
- 55.2%Utility gas
- 34.4%Electricity
- 7.9%Fuel oil, kerosene, etc.
- 1.7%Bottled, tank, or LP gas
- 0.8%No fuel used
Roads and streets:
Cator Ave
Length: 0.44 miles
Directions: E-W, SW-NE
Address range: 600 to 999
Directions: E-W, SW-NE
Address range: 600 to 999
E 41st St
Length: 0.42 miles
Directions: E-W, SE-NW
Address range: 600 to 999
Directions: E-W, SE-NW
Address range: 600 to 999
Belgian Ave
Length: 0.39 miles
Directions: E-W, N-S, SW-NE
Address range: 700 to 999
Directions: E-W, N-S, SW-NE
Address range: 700 to 999
E 43rd St
Length: 0.38 miles
Direction: E-W
Address range: 700 to 999
Direction: E-W
Address range: 700 to 999
Springfield Ave
Length: 0.34 miles
Direction: E-W
Address range: 600 to 998
Direction: E-W
Address range: 600 to 998
Dumbarton Ave
Length: 0.32 miles
Direction: E-W
Address range: 600 to 899
Direction: E-W
Address range: 600 to 899
Old York Rd
Length: 0.30 miles
Direction: N-S
Address range: 3902 to 4299
Direction: N-S
Address range: 3902 to 4299
Wyanoke Ave
Length: 0.28 miles
Direction: E-W
Address range: 550 to 799
Direction: E-W
Address range: 550 to 799
St Georges Ave
Length: 0.22 miles
Direction: SE-NW
Address range: 4100 to 4299
Direction: SE-NW
Address range: 4100 to 4299
Wilsby Ave
Length: 0.20 miles
Direction: N-S
Address range: 3942 to 4199
Direction: N-S
Address range: 3942 to 4199
Elkader Rd
Length: 0.16 miles
Direction: N-S
Address range: 4000 to 4199
Direction: N-S
Address range: 4000 to 4199
Frisby St
Length: 0.15 miles
Direction: N-S
Address range: 3900 to 4199
Direction: N-S
Address range: 3900 to 4199
Nat Ct
Length: 0.10 miles
Direction: E-W
Address range: 800 to 899
Direction: E-W
Address range: 800 to 899
Ivanhoe Ave
Length: 0.10 miles
Direction: SE-NW
Address range: 4200 to 4399
Direction: SE-NW
Address range: 4200 to 4399
Argonne Dr
Length: 0.10 miles
Direction: SW-NE
Address range: 710 to 971
Direction: SW-NE
Address range: 710 to 971
Gilrubin Ct
Length: 0.09 miles
Direction: E-W
Address range: 800 to 899
Direction: E-W
Address range: 800 to 899
Minerva Ave
Length: 0.07 miles
Direction: SE-NW
Address range: 4300 to 4399
Direction: SE-NW
Address range: 4300 to 4399
Lowndes Ave
Length: 0.03 miles
Direction: N-S
Address range: 3900 to 3999
Direction: N-S
Address range: 3900 to 3999