Ross Center neighborhood in Evansville, Indiana (IN), 47714 detailed profile
Settings
X

Business Search - 14 Million verified businesses
Area: 0.133 square miles
Population: 791
Population density:
| Ross Center: | 5,968 people per square mile |
| Evansville: | 2,912 people per square mile |

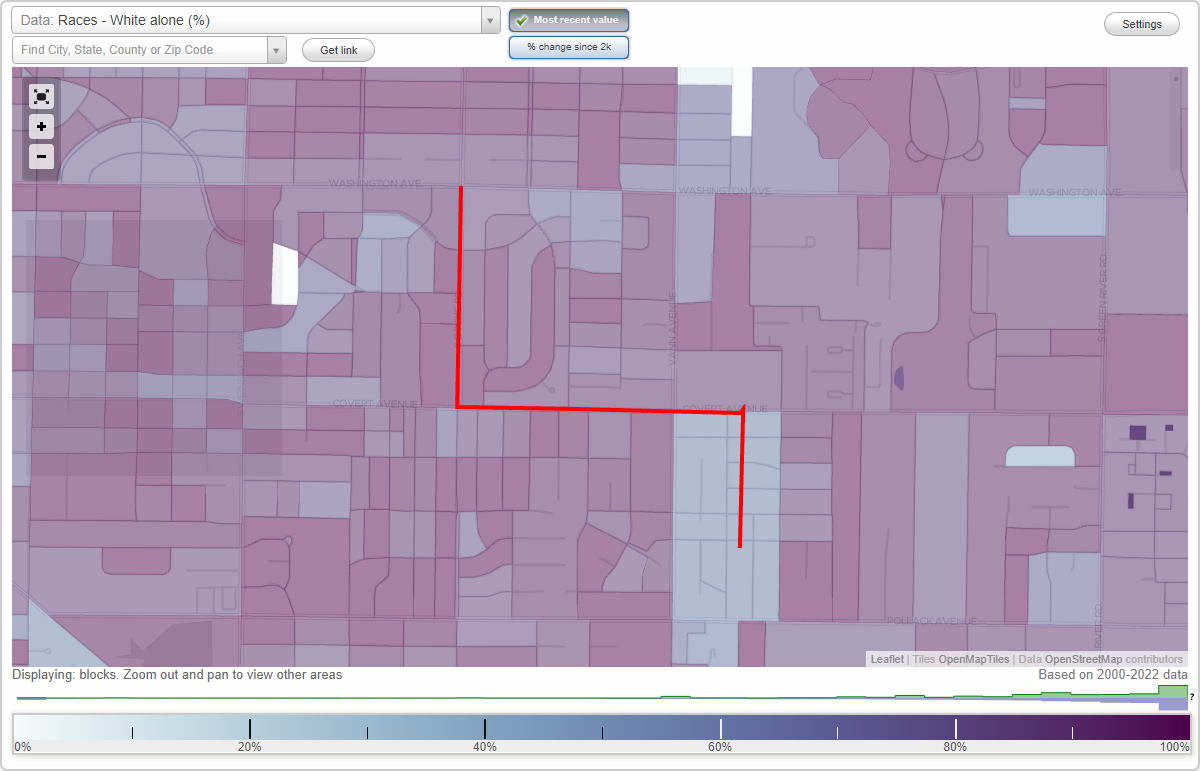
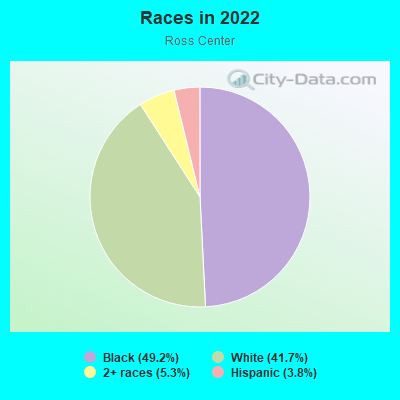
- 42849.2%Black
- 36341.7%White
- 465.3%Two or more races
- 333.8%Hispanic or Latino
Median household income in 2022:
| Ross Center: | $55,705 |
| Evansville: | $48,127 |
Distribution of median household income
![Distribution of median household income]()
- 12Less than $10,000
- 24$10,000 to $19,999
- 91$20,000 to $29,999
- 33$30,000 to $39,999
- 69$40,000 to $49,999
- 22$50,000 to $59,999
- 53$60,000 to $74,999
- 30$75,000 to $99,999
- 22$100,000 to $124,999
- 35$125,000 to $149,999
- 14$150,000 to $199,999
- 57$200,000 or more

Distribution of owner-occupied house/condo value
![Distribution of owner-occupied house/condo value]()
- 11Less than $50,000
- 172$50,000 to $99,999
- 45$100,000 to $149,999
- 32$150,000 to $199,999
- 13$250,000 to $299,999
- 35$400,000 to $499,999
- 6$750,000 to $999,999
- 1$1,000,000 or more

Distribution of rent paid by renters
![Distribution of rent paid by renters]()
- 39$400 to $499
- 50$500 to $599
- 106$600 to $699
- 104$700 to $799
- 38$800 to $899
- 5$900 to $999

Median rent in 2022:
| Ross Center: | $676 |
| Evansville: | $691 |
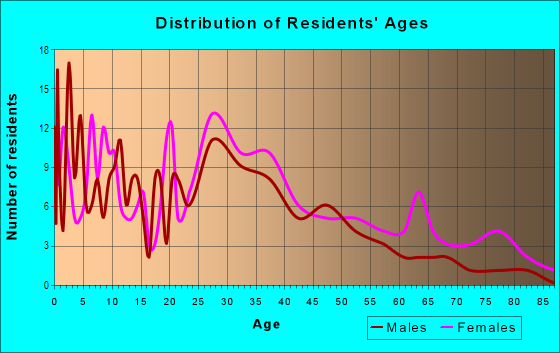
| Males: | 274 |
| Females: | 517 |
Males:
| This neighborhood: | 37.6 years |
| Whole city: | 36.6 years |
| This neighborhood: | 37.2 years |
| Whole city: | 38.9 years |
Average household size:
| Ross Center: | 2.4 people |
| Evansville: | 2.1 people |
Percentage of family households:
| Ross Center: | 41.6% |
| Evansville: | 38.3% |
| Here: | 23.1% |
| Evansville: | 33.7% |
Percentage of married-couple families with children (among all households):
| Ross Center: | 26.3% |
| Evansville: | 25.3% |
Percentage of single-mother households (among all households):
| Ross Center: | 18.4% |
| Evansville: | 15.6% |
Percentage of never married males 15 years old and over:
Percentage of never married females 15 years old and over:
| Ross Center: | 18.1% |
| Evansville: | 19.5% |
Percentage of never married females 15 years old and over:
| Ross Center: | 44.3% |
| city: | 17.0% |
Percentage of people that speak English not well or not at all:
| Ross Center: | 0.0% |
| Evansville: | 0.7% |
Percentage of people born in this state:
Percentage of people born in another U.S. state:
Percentage of native residents but born outside the U.S.:
Percentage of foreign born residents:
| Here: | 72.7% |
| Evansville: | 70.5% |
Percentage of people born in another U.S. state:
| Ross Center: | 26.6% |
| Evansville: | 25.5% |
Percentage of native residents but born outside the U.S.:
| Here: | 0.1% |
| city: | 0.8% |
Percentage of foreign born residents:
| Here: | 0.6% |
| Evansville: | 3.2% |
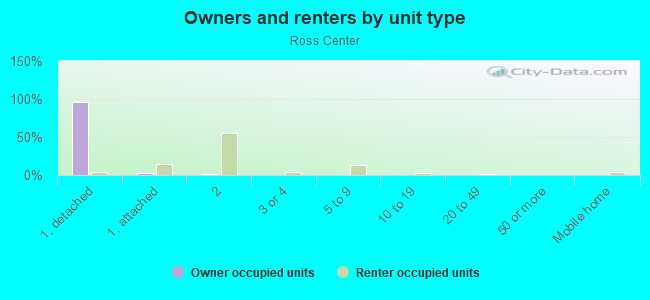
Owner-occupied
Renter-occupied

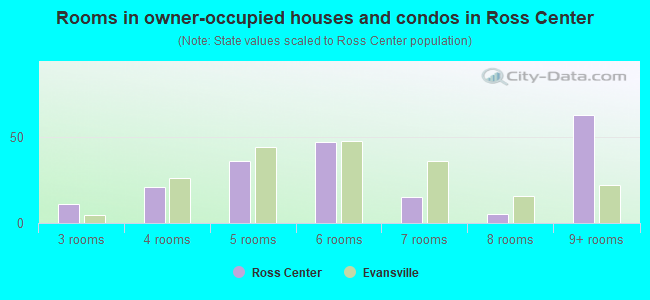
- Rooms in owner-occupied houses and condos in Ross Center
- 01 room
- 02 rooms
- 113 rooms
- 214 rooms
- 365 rooms
- 476 rooms
- 157 rooms
- 58 rooms
- 639+ rooms
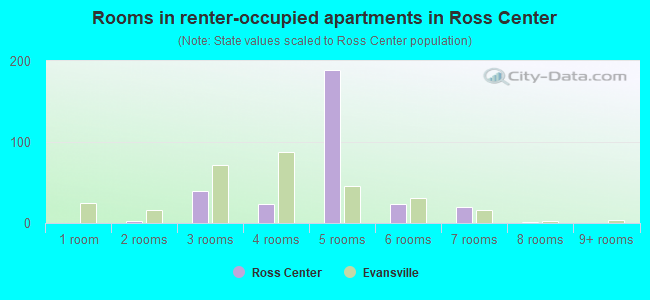
- Rooms in renter-occupied apartments in Ross Center
- 01 room
- 22 rooms
- 403 rooms
- 244 rooms
- 1895 rooms
- 236 rooms
- 207 rooms
- 18 rooms
- 09+ rooms
Owner-occupied
Renter-occupied
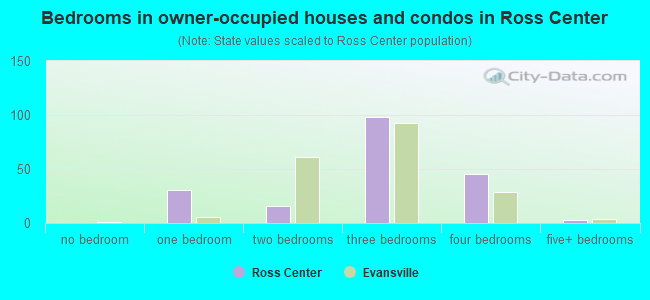
- Bedrooms in owner-occupied houses and condos in Ross Center
- 0no bedroom
- 311 bedroom
- 162 bedrooms
- 983 bedrooms
- 454 bedrooms
- 35+ bedrooms
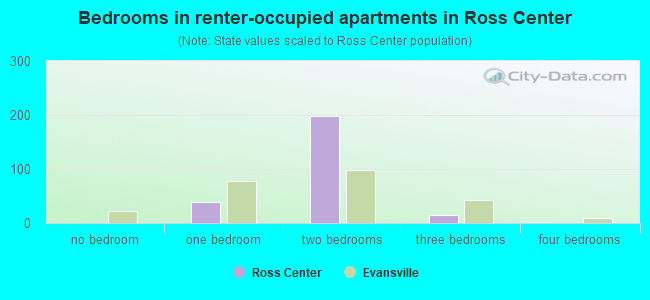
- Bedrooms in renter-occupied apartments in Ross Center
- 0no bedroom
- 391 bedroom
- 1982 bedrooms
- 143 bedrooms
- 04 bedrooms
- 05+ bedrooms
Average number of cars or other vehicles available in houses/condos:
Average number of cars or other vehicles available in apartments:
| This neighborhood: | 2.0 |
| Evansville: | 1.8 |
Average number of cars or other vehicles available in apartments:
| Here: | 1.1 |
| city: | 1.1 |
Percentage of units with a mortgage:
| Ross Center: | 50.3% |
| Evansville: | 58.5% |
Average estimated value of detached houses in 2022 (28.7% of all units):
| Ross Center: | $83,945 |
| Indiana: | $257,916 |
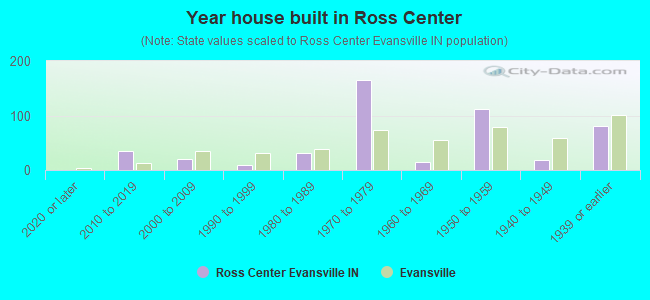
- Year house built in Ross Center
- 02020 or later
- 342010 to 2019
- 212000 to 2009
- 101990 to 1999
- 311980 to 1989
- 1651970 to 1979
- 141960 to 1969
- 1121950 to 1959
- 191940 to 1949
- 811939 or earlier
City-data.com crime index for city in 2020 (higher means more crime):
| City: | 440.8 |
| U.S. average: | 219.5 |
Travel time to work (commute)
![Travel time to work (commute)]()
- 15Less than 5 minutes
- 275 to 9 minutes
- 6810 to 14 minutes
- 10915 to 19 minutes
- 6120 to 24 minutes
- 1325 to 29 minutes
- 1430 to 34 minutes
- 535 to 39 minutes
- 140 to 44 minutes
- 5245 to 59 minutes
- 860 to 89 minutes
- 2190 or more minutes

Means of transportation to work
![Means of transportation to work]()
- 69.2%375Drove a car alone
- 6.1%33Carpooled
- 13.5%73Bus
- 12.7%69Taxi
- 1.5%8Motorcycle
- 0.7%4Walked
- 4.2%23Other means
- 0.7%4Worked at home

Time leaving home to go to work
![Time leaving home to go to work]()
- 2812:00 a.m. to 4:59 a.m.
- 395:00 a.m. to 5:29 a.m.
- 235:30 a.m. to 5:59 a.m.
- 166:00 a.m. to 6:29 a.m.
- 416:30 a.m. to 6:59 a.m.
- 527:00 a.m. to 7:29 a.m.
- 617:30 a.m. to 7:59 a.m.
- 178:00 a.m. to 8:29 a.m.
- 28:30 a.m. to 8:59 a.m.
- 109:00 a.m. to 9:59 a.m.
- 310:00 a.m. to 10:59 a.m.
- 6912:00 p.m. to 3:59 p.m.
- 204:00 p.m. to 11:59 p.m.

Occupations of males:
- Percentage of males in management occupations (except farmers):
Here: 29.1% city: 8.4%
- Percentage of males in computer and mathematical occupations:
Here: 6.3% city: 3.0%
- Percentage of males in architecture and engineering occupations:
Here: 2.5% city: 3.0%
- Percentage of males in arts, design, entertainment, sports, and media occupations:
Here: 1.9% city: 1.4%
- Percentage of males in sales and office occupations:
Here: 16.2% city: 14.7%
- Percentage of males in production occupations:
Here: 24.9% city: 14.9%
- Percentage of males in material moving occupations:
Here: 13.9% city: 8.2%
Occupations of females:
- Percentage of females in management occupations (except farmers):
Here: 2.5% city: 6.4%
- Percentage of females in business and financial operations occupations:
Here: 3.0% city: 4.6%
- Percentage of females in community and social services occupations:
Here: 4.8% city: 2.7%
- Percentage of females in arts, design, entertainment, sports, and media occupations:
Here: 1.0% city: 1.3%
- Percentage of females in healthcare practitioners and technical occupations:
Here: 1.8% city: 8.9%
- Percentage of females in service occupations:
Here: 23.4% city: 26.1%
- Percentage of females in sales and office occupations:
Here: 50.8% city: 30.9%
- Percentage of females in production occupations:
Here: 20.9% city: 5.3%
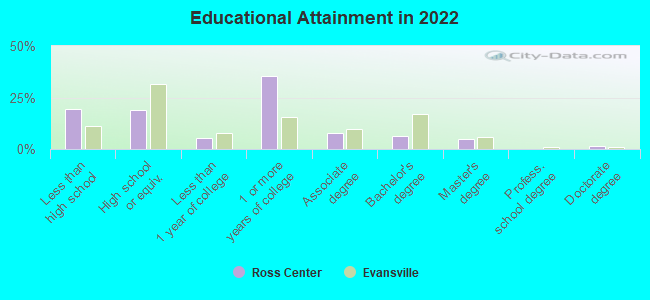
Education in this neighborhood (subdivision or community):
- Percentage of people 3 years and older in K-12 schools:
Ross Center: 37.0% Evansville: 15.5%
- Percentage of people 3 years and older in undergraduate colleges:
Ross Center: 6.5% Evansville: 5.1%
- Percentage of people 3 years and older in grad. or professional schools:
Ross Center: 0.0% Evansville: 0.8%
- Percentage of students K-12 enrolled in private schools:
Ross Center: 16.4% Evansville: 15.2%
Percentage of population below poverty level:
| Ross Center: | 15.1% |
| Evansville: | 19.3% |
Median year owner moved in (as recorded in 2022):
Median year renter moved in (as recorded in 2022):
| Ross Center: | 1996 |
| Evansville: | 2011 |
Median year renter moved in (as recorded in 2022):
| Ross Center: | 2005 |
| Evansville: | 2020 |
Percentage of married-couple families with both working:
| Ross Center: | 118.2% |
| Evansville: | 71.5% |
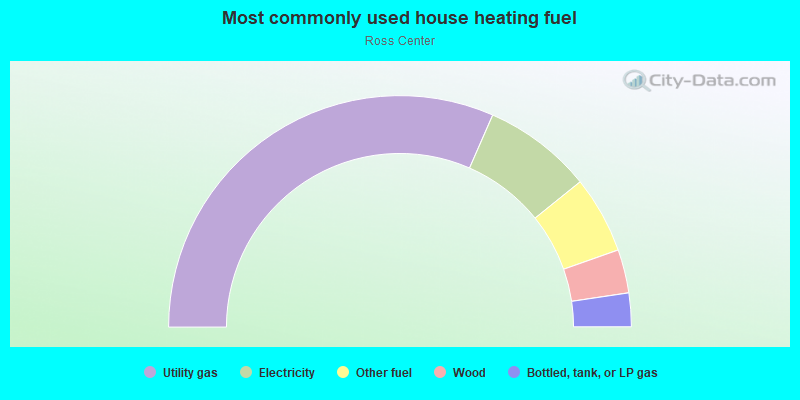
- 63.2%Utility gas
- 15.3%Electricity
- 10.8%Other fuel
- 6.1%Wood
- 4.7%Bottled, tank, or LP gas
Roads and streets:
Macarthur Cir (Macarthur Dr)
Length: 0.58 miles
Directions: E-W, N-S, SE-NW, SW-NE
Address range: 1000 to 1599
Directions: E-W, N-S, SE-NW, SW-NE
Address range: 1000 to 1599
S Saint James Blvd
Length: 0.33 miles
Directions: N-S, SE-NW
Address range: 1010 to 1599
Directions: N-S, SE-NW
Address range: 1010 to 1599
S Roosevelt Dr
Length: 0.29 miles
Direction: N-S
Address range: 1200 to 1599
Direction: N-S
Address range: 1200 to 1599
Ravenswood Dr
Length: 0.27 miles
Directions: E-W, N-S, SW-NE
Address range: 2400 to 2799
Directions: E-W, N-S, SW-NE
Address range: 2400 to 2799
Adams Ave
Length: 0.27 miles
Directions: E-W, SW-NE
Address range: 2500 to 2799
Directions: E-W, SW-NE
Address range: 2500 to 2799
Corregidor Cir
Length: 0.22 miles
Directions: E-W, N-S, SW-NE
Address range: 1000 to 1299
Directions: E-W, N-S, SW-NE
Address range: 1000 to 1299
Taylor Ave
Length: 0.19 miles
Directions: E-W, N-S, SW-NE
Address range: 2449 to 2799
Directions: E-W, N-S, SW-NE
Address range: 2449 to 2799
S Villa Dr
Length: 0.13 miles
Direction: N-S
Address range: 1150 to 1399
Direction: N-S
Address range: 1150 to 1399
S Ruston Ave
Length: 0.12 miles
Direction: N-S
Address range: 1300 to 1599
Direction: N-S
Address range: 1300 to 1599
Madison Ave
Length: 0.04 miles
Direction: E-W
Address range: 2700 to 2799
Direction: E-W
Address range: 2700 to 2799
Ravenswood Ct
Length: 0.04 miles
Directions: E-W, SE-NW
Address range: 2001 to 2698
Directions: E-W, SE-NW
Address range: 2001 to 2698