Seymour Square neighborhood in Grand Rapids, Michigan (MI), 49507 detailed profile
Settings
X

Business Search - 14 Million verified businesses
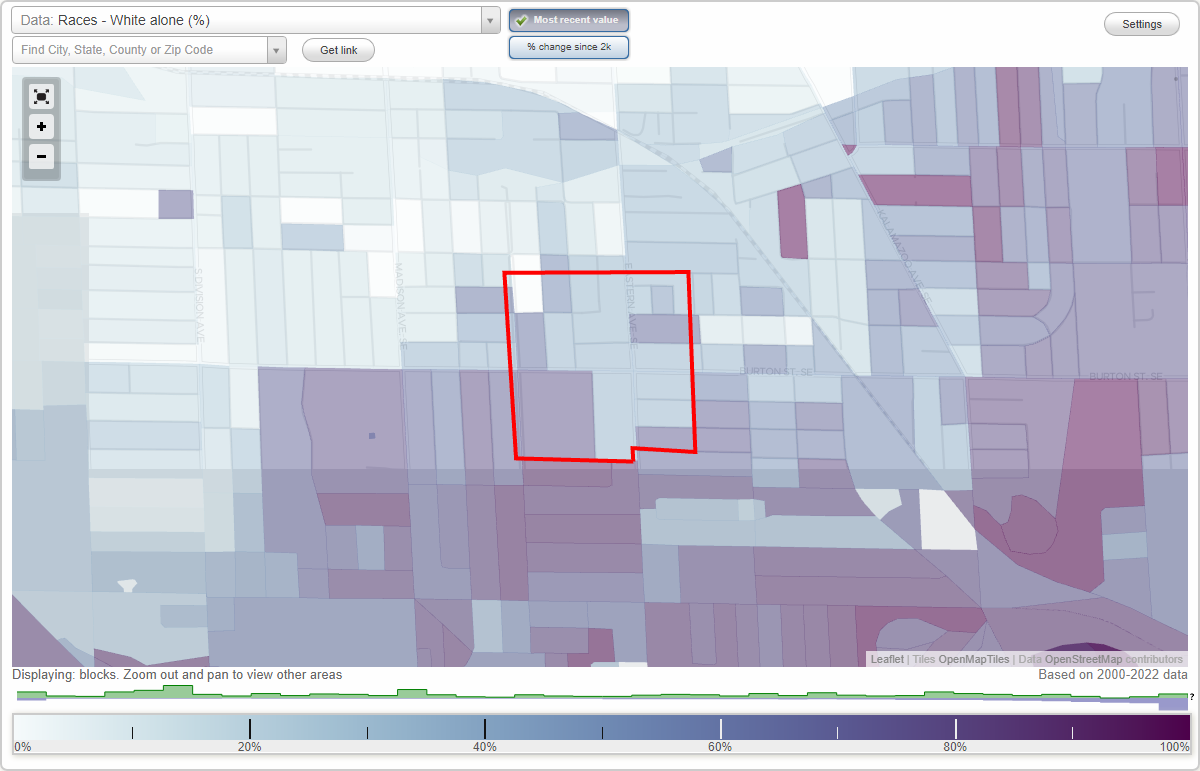
Area: 0.158 square miles
Population: 1,386
Population density:
| Seymour Square: | 8,771 people per square mile |
| Grand Rapids: | 4,411 people per square mile |

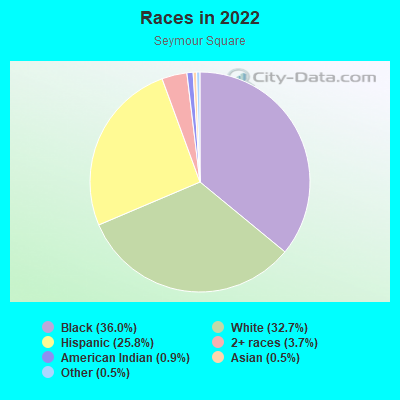
- 50236.0%Black
- 45632.7%White
- 36025.8%Hispanic or Latino
- 523.7%Two or more races
- 120.9%American Indian
- 70.5%Asian
- 70.5%Some other race
Median household income in 2022:
| Seymour Square: | $63,765 |
| Grand Rapids: | $65,660 |
Distribution of median household income
![Distribution of median household income]()
- 12Less than $10,000
- 47$10,000 to $19,999
- 54$20,000 to $29,999
- 85$30,000 to $39,999
- 73$40,000 to $49,999
- 15$50,000 to $59,999
- 74$60,000 to $74,999
- 54$75,000 to $99,999
- 117$100,000 to $124,999
- 16$125,000 to $149,999
- 17$150,000 to $199,999
- 19$200,000 or more

Distribution of owner-occupied house/condo value
![Distribution of owner-occupied house/condo value]()
- 47Less than $50,000
- 49$50,000 to $99,999
- 177$100,000 to $149,999
- 124$150,000 to $199,999
- 38$200,000 to $249,999
- 27$250,000 to $299,999
- 3$300,000 to $399,999
- 12$400,000 to $499,999
- 10$500,000 to $749,999
- 7$750,000 to $999,999
- 2$1,000,000 or more

Distribution of rent paid by renters
![Distribution of rent paid by renters]()
- 6Less than $100
- 17$100 to $199
- 30$200 to $299
- 13$300 to $399
- 3$500 to $599
- 23$600 to $699
- 77$700 to $799
- 56$800 to $899
- 9$900 to $999
- 9$1,000 to $1,249
- 9$1,250 to $1,499
- 4$1,500 to $1,999
- 7$2,000 or more

Median rent in 2022:
| Seymour Square: | $811 |
| Grand Rapids: | $1,117 |
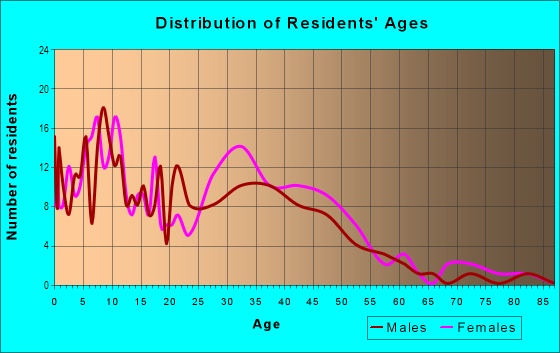
| Males: | 703 |
| Females: | 683 |
Males:
| This neighborhood: | 34.6 years |
| Whole city: | 33.0 years |
| This neighborhood: | 36.7 years |
| Whole city: | 33.3 years |
Average household size:
| Seymour Square: | 2.8 people |
| Grand Rapids: | 2.2 people |
Percentage of family households:
| Seymour Square: | 60.5% |
| Grand Rapids: | 36.8% |
| Here: | 43.1% |
| Grand Rapids: | 31.2% |
Percentage of married-couple families with children (among all households):
| Seymour Square: | 31.4% |
| Grand Rapids: | 25.1% |
Percentage of single-mother households (among all households):
| Seymour Square: | 12.2% |
| Grand Rapids: | 14.6% |
Percentage of never married males 15 years old and over:
Percentage of never married females 15 years old and over:
| Seymour Square: | 22.0% |
| Grand Rapids: | 23.6% |
Percentage of never married females 15 years old and over:
| Seymour Square: | 17.3% |
| city: | 23.9% |
Percentage of people that speak English not well or not at all:
| Seymour Square: | 17.0% |
| Grand Rapids: | 4.2% |
Percentage of people born in this state:
Percentage of people born in another U.S. state:
Percentage of native residents but born outside the U.S.:
Percentage of foreign born residents:
| Here: | 67.8% |
| Grand Rapids: | 70.1% |
Percentage of people born in another U.S. state:
| Seymour Square: | 12.6% |
| Grand Rapids: | 18.1% |
Percentage of native residents but born outside the U.S.:
| Here: | 1.4% |
| city: | 1.0% |
Percentage of foreign born residents:
| Here: | 18.3% |
| Grand Rapids: | 10.8% |
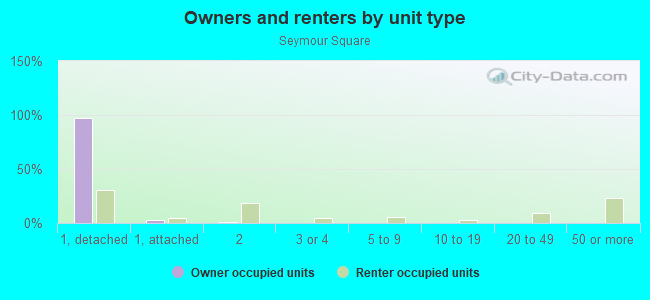
Owner-occupied
Renter-occupied

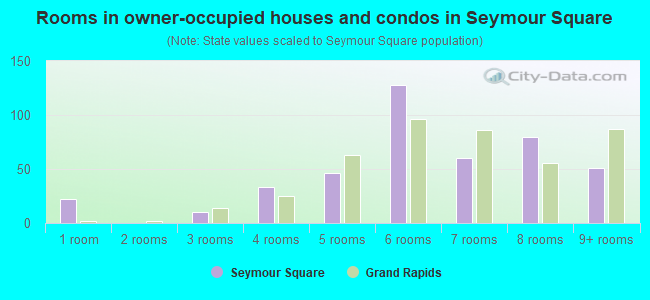
- Rooms in owner-occupied houses and condos in Seymour Square
- 221 room
- 02 rooms
- 103 rooms
- 334 rooms
- 465 rooms
- 1286 rooms
- 607 rooms
- 808 rooms
- 519+ rooms
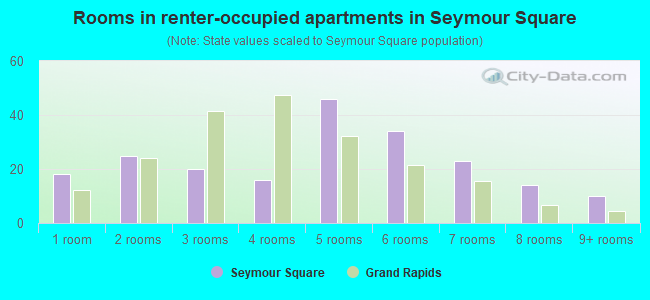
- Rooms in renter-occupied apartments in Seymour Square
- 181 room
- 252 rooms
- 203 rooms
- 164 rooms
- 465 rooms
- 346 rooms
- 237 rooms
- 148 rooms
- 109+ rooms
Owner-occupied
Renter-occupied
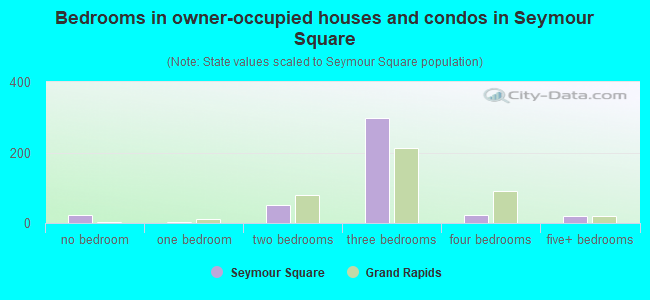
- Bedrooms in owner-occupied houses and condos in Seymour Square
- 22no bedroom
- 41 bedroom
- 502 bedrooms
- 2973 bedrooms
- 244 bedrooms
- 205+ bedrooms
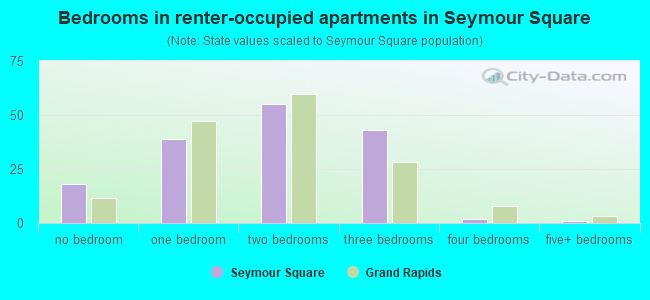
- Bedrooms in renter-occupied apartments in Seymour Square
- 18no bedroom
- 391 bedroom
- 552 bedrooms
- 433 bedrooms
- 24 bedrooms
- 15+ bedrooms
Average number of cars or other vehicles available in houses/condos:
Average number of cars or other vehicles available in apartments:
| This neighborhood: | 2.1 |
| Grand Rapids: | 1.8 |
Average number of cars or other vehicles available in apartments:
| Here: | 1.2 |
| city: | 1.3 |
Percentage of units with a mortgage:
| Seymour Square: | 73.4% |
| Grand Rapids: | 67.2% |
Average estimated value of detached houses in 2022 (89.1% of all units):
| Seymour Square: | $157,414 |
| Grand Rapids: | $216,026 |
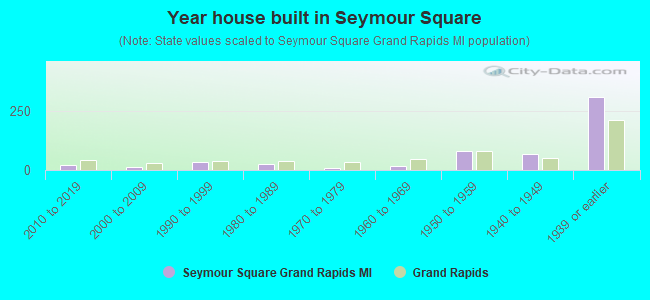
- Year house built in Seymour Square
- 02020 or later
- 212010 to 2019
- 112000 to 2009
- 331990 to 1999
- 241980 to 1989
- 81970 to 1979
- 181960 to 1969
- 811950 to 1959
- 701940 to 1949
- 3101939 or earlier
City-data.com crime index for city in 2020 (higher means more crime):
| City: | 309.2 |
| U.S. average: | 219.5 |
Travel time to work (commute)
![Travel time to work (commute)]()
- 4Less than 5 minutes
- 515 to 9 minutes
- 12210 to 14 minutes
- 19415 to 19 minutes
- 16620 to 24 minutes
- 5625 to 29 minutes
- 3430 to 34 minutes
- 635 to 39 minutes
- 1440 to 44 minutes
- 2645 to 59 minutes
- 5360 to 89 minutes
- 1690 or more minutes

Means of transportation to work
![Means of transportation to work]()
- 69.4%571Drove a car alone
- 24.8%204Carpooled
- 2.8%23Bus
- 0.7%6Taxi
- 0.1%1Bicycle
- 1.3%11Walked
- 0.9%7Other means
- 2.3%19Worked at home

Time leaving home to go to work
![Time leaving home to go to work]()
- 4012:00 a.m. to 4:59 a.m.
- 235:00 a.m. to 5:29 a.m.
- 325:30 a.m. to 5:59 a.m.
- 546:00 a.m. to 6:29 a.m.
- 786:30 a.m. to 6:59 a.m.
- 617:00 a.m. to 7:29 a.m.
- 1657:30 a.m. to 7:59 a.m.
- 308:00 a.m. to 8:29 a.m.
- 418:30 a.m. to 8:59 a.m.
- 289:00 a.m. to 9:59 a.m.
- 610:00 a.m. to 10:59 a.m.
- 811:00 a.m. to 11:59 a.m.
- 9312:00 p.m. to 3:59 p.m.
- 944:00 p.m. to 11:59 p.m.

Occupations of males:
- Percentage of males in management occupations (except farmers):
Here: 2.7% city: 10.3%
- Percentage of males in business and financial operations occupations:
Here: 5.6% city: 5.8%
- Percentage of males in computer and mathematical occupations:
Here: 1.1% city: 5.4%
- Percentage of males in architecture and engineering occupations:
Here: 1.6% city: 3.6%
- Percentage of males in community and social services occupations:
Here: 1.0% city: 1.7%
- Percentage of males in education, training, and library occupations:
Here: 2.1% city: 3.9%
- Percentage of males in healthcare practitioners and technical occupations:
Here: 1.6% city: 3.1%
- Percentage of males in service occupations:
Here: 12.6% city: 14.6%
- Percentage of males in sales and office occupations:
Here: 7.0% city: 14.1%
- Percentage of males in production occupations:
Here: 22.0% city: 11.0%
- Percentage of males in transportation occupations:
Here: 20.8% city: 4.2%
- Percentage of males in material moving occupations:
Here: 18.0% city: 7.3%
Occupations of females:
- Percentage of females in management occupations (except farmers):
Here: 2.7% city: 7.9%
- Percentage of females in business and financial operations occupations:
Here: 3.3% city: 6.3%
- Percentage of females in computer and mathematical occupations:
Here: 3.2% city: 1.3%
- Percentage of females in education, training, and library occupations:
Here: 3.4% city: 7.2%
- Percentage of females in arts, design, entertainment, sports, and media occupations:
Here: 1.4% city: 2.7%
- Percentage of females in healthcare practitioners and technical occupations:
Here: 6.4% city: 10.8%
- Percentage of females in service occupations:
Here: 39.6% city: 21.1%
- Percentage of females in sales and office occupations:
Here: 19.9% city: 24.9%
- Percentage of females in production occupations:
Here: 4.1% city: 6.8%
- Percentage of females in material moving occupations:
Here: 15.2% city: 2.7%
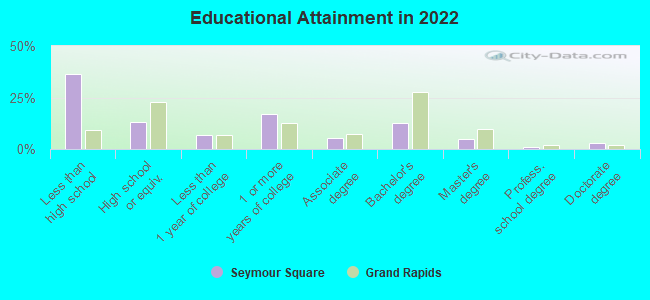
Education in this neighborhood (subdivision or community):
- Percentage of people 3 years and older in K-12 schools:
Seymour Square: 15.7% Grand Rapids: 13.5%
- Percentage of people 3 years and older in undergraduate colleges:
Seymour Square: 5.9% Grand Rapids: 6.0%
- Percentage of people 3 years and older in grad. or professional schools:
Seymour Square: 1.2% Grand Rapids: 2.1%
- Percentage of students K-12 enrolled in private schools:
Seymour Square: 33.2% Grand Rapids: 26.5%
Percentage of population below poverty level:
| Seymour Square: | 20.2% |
| Grand Rapids: | 15.8% |
Median year owner moved in (as recorded in 2022):
| Seymour Square: | 2008 |
| Grand Rapids: | 2012 |
Percentage of married-couple families with both working:
| Seymour Square: | 99.1% |
| Grand Rapids: | 70.8% |
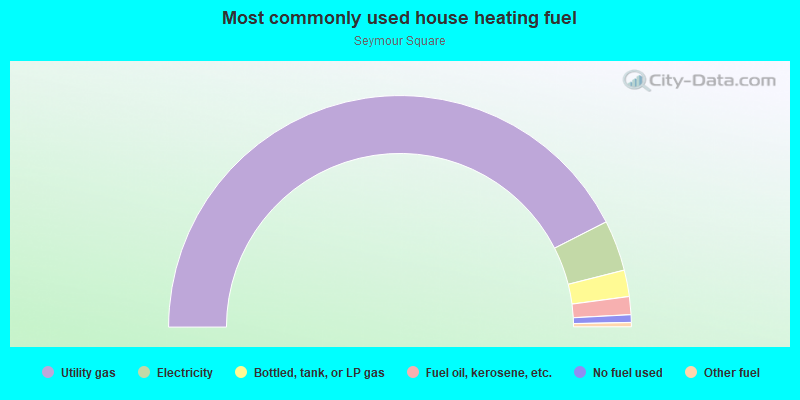
- 85.0%Utility gas
- 7.1%Electricity
- 3.7%Bottled, tank, or LP gas
- 2.5%Fuel oil, kerosene, etc.
- 1.1%No fuel used
- 0.6%Other fuel
Roads and streets:
Burton St SE
Length: 0.51 miles
Direction: E-W
Address range: 600 to 863
Direction: E-W
Address range: 600 to 863
Union Ave SE
Length: 0.38 miles
Direction: N-S
Address range: 1827 to 2127
Direction: N-S
Address range: 1827 to 2127
Elliott St SE
Length: 0.33 miles
Direction: E-W
Address range: 600 to 854
Direction: E-W
Address range: 600 to 854
Eastern Ave SE
Length: 0.31 miles
Direction: N-S
Address range: 1827 to 2055
Direction: N-S
Address range: 1827 to 2055
Winchell St SE
Length: 0.26 miles
Direction: E-W
Address range: 600 to 724
Direction: E-W
Address range: 600 to 724
Martin Ave SE
Length: 0.19 miles
Direction: N-S
Address range: 2000 to 2127
Direction: N-S
Address range: 2000 to 2127
Hazen St SE
Length: 0.17 miles
Direction: E-W
Address range: 800 to 862
Direction: E-W
Address range: 800 to 862
Merritt St SE
Length: 0.17 miles
Direction: E-W
Address range: 800 to 865
Direction: E-W
Address range: 800 to 865
Ardmore St SE
Length: 0.17 miles
Direction: E-W
Address range: 700 to 799
Direction: E-W
Address range: 700 to 799
Linden Ave SE
Length: 0.13 miles
Direction: N-S
Address range: 1900 to 1999
Direction: N-S
Address range: 1900 to 1999
Willard Ave SE
Length: 0.13 miles
Direction: N-S
Address range: 1900 to 1999
Direction: N-S
Address range: 1900 to 1999
Ralph Ave SE
Length: 0.13 miles
Directions: E-W, N-S
Address range: 1800 to 1899
Directions: E-W, N-S
Address range: 1800 to 1899
Marshall Ave SE
Length: 0.12 miles
Direction: N-S
Address range: 2000 to 2099
Direction: N-S
Address range: 2000 to 2099
Ruby Pl SE
Length: 0.06 miles
Direction: N-S
Address range: 1800 to 1899
Direction: N-S
Address range: 1800 to 1899