Sienna Villas neighborhood in Valencia, California (CA), 91355 detailed profile
Settings
X

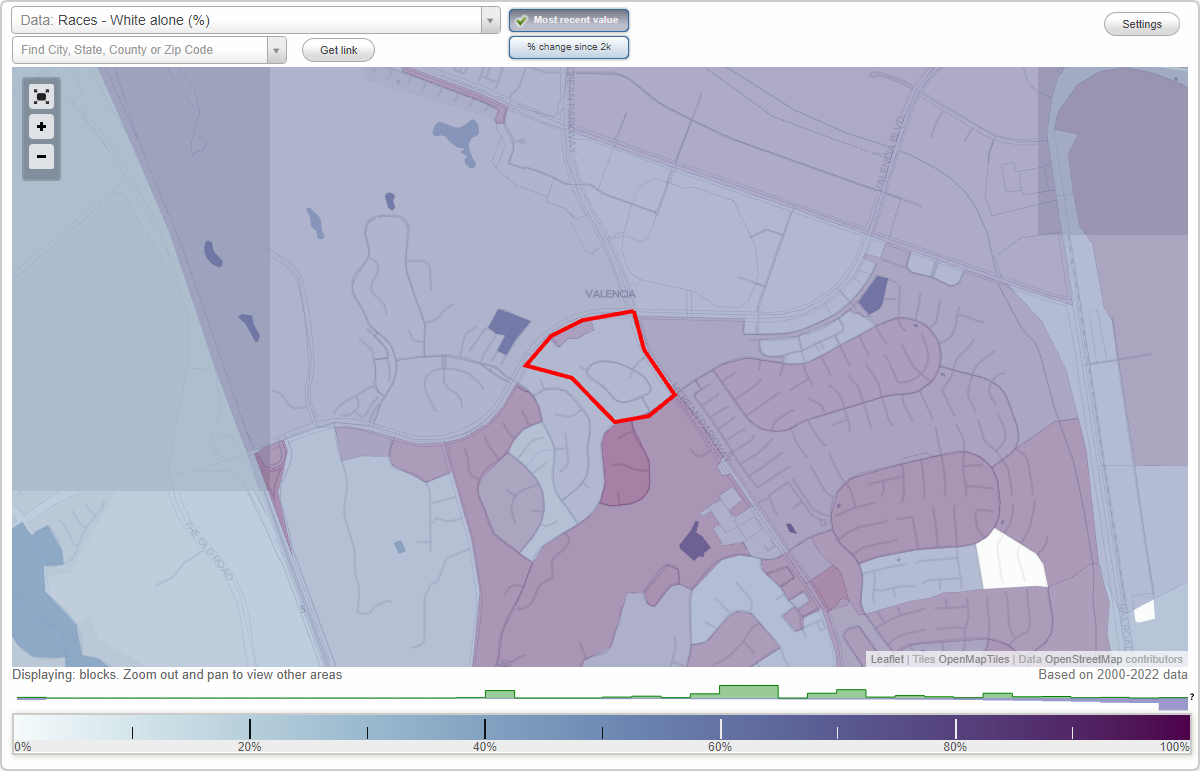
Area: 0.053 square miles
Population: 275
Population density: 5,191 people per square mile

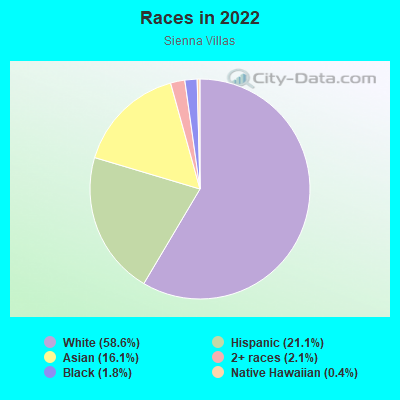
- 16758.6%White
- 6021.1%Hispanic or Latino
- 4616.1%Asian
- 62.1%Two or more races
- 51.8%Black
- 10.4%Native Hawaiian and Other
Pacific Islander
Median household income in 2022:
| Sienna Villas: | $120,203 |
| California: | $91,551 |
Distribution of median household income
![Distribution of median household income]()
- 7Less than $10,000
- 27$10,000 to $19,999
- 15$20,000 to $29,999
- 7$30,000 to $39,999
- 4$40,000 to $49,999
- 1$50,000 to $59,999
- 13$60,000 to $74,999
- 12$75,000 to $99,999
- 31$100,000 to $124,999
- 5$125,000 to $149,999
- 13$150,000 to $199,999
- 49$200,000 or more

Distribution of owner-occupied house/condo value
![Distribution of owner-occupied house/condo value]()
- 2Less than $50,000
- 2$100,000 to $149,999
- 13$250,000 to $299,999
- 9$300,000 to $399,999
- 11$400,000 to $499,999
- 24$500,000 to $749,999
- 42$750,000 to $999,999
- 17$1,000,000 or more

Distribution of rent paid by renters
![Distribution of rent paid by renters]()
- 9$200 to $299
- 7$300 to $399
- 7$500 to $599
- 7$700 to $799
- 3$1,000 to $1,249
- 12$1,500 to $1,999
- 33$2,000 or more

Median rent in 2022:
| Sienna Villas: | $2,644 |
| California: | $1,719 |
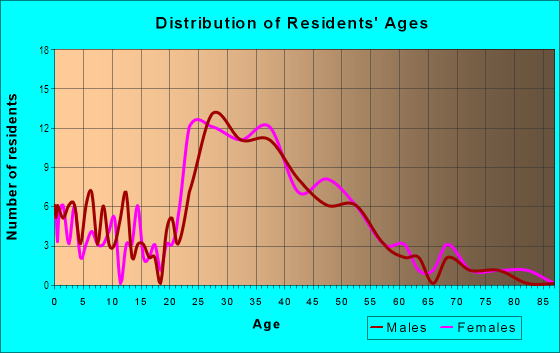
| Males: | 159 |
| Females: | 115 |
| Males: | 50.1 years |
| Females: | 57.2 years |
Average household size:
| Sienna Villas: | 2.1 people |
| California: | 2.8 people |
Percentage of family households:
| Sienna Villas: | 40.8% |
| California: | 46.8% |
| Here: | 44.9% |
| California: | 48.1% |
Percentage of married-couple families with children (among all households):
| Sienna Villas: | 44.1% |
| California: | 48.8% |
Percentage of single-mother households (among all households):
| Sienna Villas: | 28.0% |
| California: | 7.1% |
Percentage of never married males 15 years old and over:
Percentage of never married females 15 years old and over:
| Sienna Villas: | 38.1% |
| California: | 20.6% |
Percentage of never married females 15 years old and over:
| Sienna Villas: | 17.2% |
| California: | 17.7% |
Percentage of people that speak English not well or not at all:
| Sienna Villas: | 0.0% |
| California: | 9.1% |
Percentage of people born in this state:
Percentage of people born in another U.S. state:
Percentage of native residents but born outside the U.S.:
Percentage of foreign born residents:
| Here: | 49.0% |
| California: | 56.8% |
Percentage of people born in another U.S. state:
| Sienna Villas: | 29.7% |
| California: | 14.9% |
Percentage of native residents but born outside the U.S.:
| Here: | 1.7% |
| California: | 1.5% |
Percentage of foreign born residents:
| Here: | 19.7% |
| California: | 26.7% |
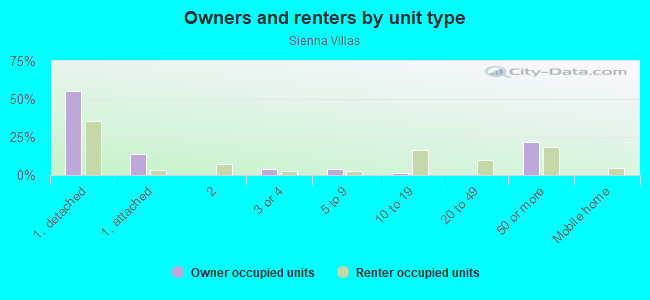
Owner-occupied
Renter-occupied

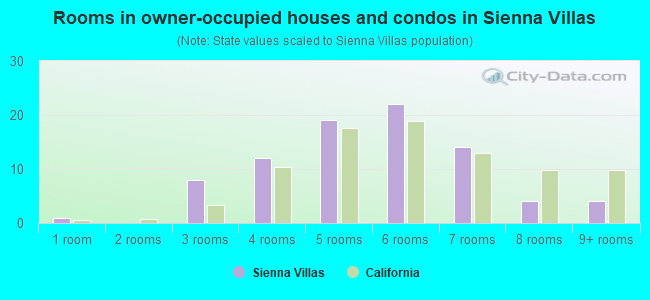
- Rooms in owner-occupied houses and condos in Sienna Villas
- 11 room
- 02 rooms
- 83 rooms
- 124 rooms
- 195 rooms
- 226 rooms
- 147 rooms
- 48 rooms
- 49+ rooms
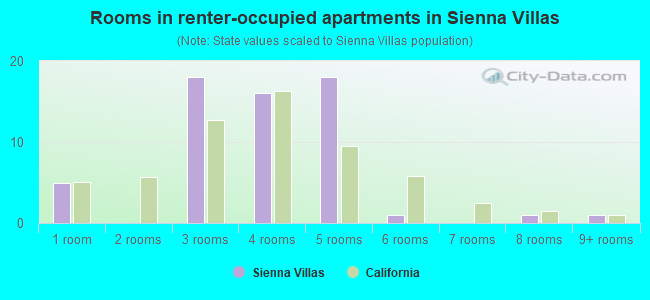
- Rooms in renter-occupied apartments in Sienna Villas
- 51 room
- 02 rooms
- 183 rooms
- 164 rooms
- 185 rooms
- 16 rooms
- 07 rooms
- 18 rooms
- 19+ rooms
Owner-occupied
Renter-occupied
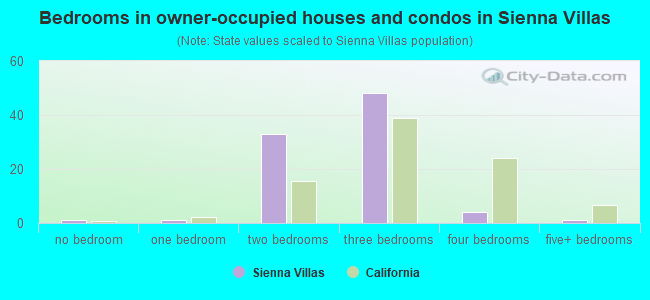
- Bedrooms in owner-occupied houses and condos in Sienna Villas
- 1no bedroom
- 11 bedroom
- 332 bedrooms
- 483 bedrooms
- 44 bedrooms
- 15+ bedrooms
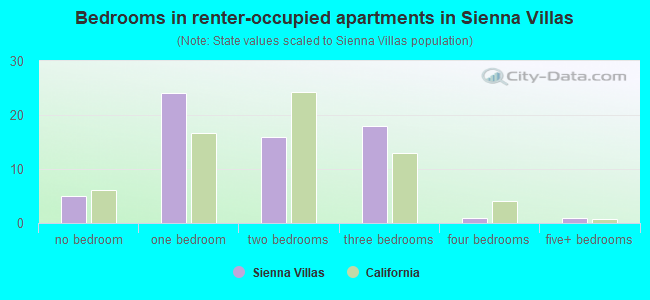
- Bedrooms in renter-occupied apartments in Sienna Villas
- 5no bedroom
- 241 bedroom
- 162 bedrooms
- 183 bedrooms
- 14 bedrooms
- 15+ bedrooms
Average number of cars or other vehicles available in houses/condos:
Average number of cars or other vehicles available in apartments:
| This neighborhood: | 0.9 |
| California: | 2.3 |
Average number of cars or other vehicles available in apartments:
| Here: | 1.0 |
| California: | 1.6 |
Percentage of units with a mortgage:
| Sienna Villas: | 80.7% |
| California: | 67.1% |
Housing prices:
- Average estimated value of detached houses in 2022 (62.0% of all units):
Sienna Villas: $5,904,946 California: $988,808
- Average estimated value of townhouses or other attached units in 2022 (10.7% of all units):
This neighborhood: $321,126 California: $838,546
- Average estimated '22 value of housing units in 5-or-more-unit structures (26.4% of all units):
Sienna Villas: $1,826,555 California: $730,996
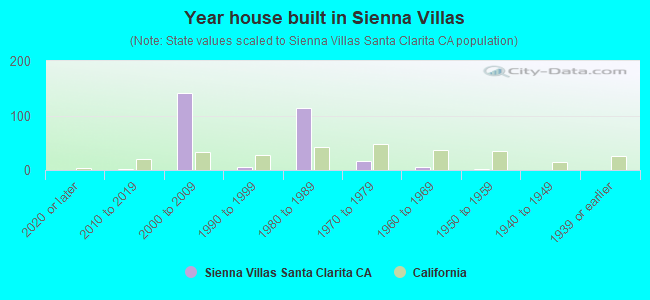
- Year house built in Sienna Villas
- 02020 or later
- 12010 to 2019
- 1422000 to 2009
- 61990 to 1999
- 1141980 to 1989
- 161970 to 1979
- 51960 to 1969
- 21950 to 1959
- 01940 to 1949
- 01939 or earlier
Travel time to work (commute)
![Travel time to work (commute)]()
- 1Less than 5 minutes
- 115 to 9 minutes
- 3110 to 14 minutes
- 3015 to 19 minutes
- 1920 to 24 minutes
- 625 to 29 minutes
- 2830 to 34 minutes
- 335 to 39 minutes
- 1040 to 44 minutes
- 2845 to 59 minutes
- 2860 to 89 minutes
- 1090 or more minutes

Means of transportation to work
![Means of transportation to work]()
- 29.4%55Drove a car alone
- 28.4%53Carpooled
- 3.7%7Bus
- 0.5%1Bicycle
- 6.4%12Other means
- 30.5%57Worked at home

Time leaving home to go to work
![Time leaving home to go to work]()
- 1212:00 a.m. to 4:59 a.m.
- 75:00 a.m. to 5:29 a.m.
- 165:30 a.m. to 5:59 a.m.
- 226:00 a.m. to 6:29 a.m.
- 166:30 a.m. to 6:59 a.m.
- 167:00 a.m. to 7:29 a.m.
- 47:30 a.m. to 7:59 a.m.
- 198:00 a.m. to 8:29 a.m.
- 178:30 a.m. to 8:59 a.m.
- 349:00 a.m. to 9:59 a.m.
- 110:00 a.m. to 10:59 a.m.
- 311:00 a.m. to 11:59 a.m.
- 1412:00 p.m. to 3:59 p.m.
- 164:00 p.m. to 11:59 p.m.

Occupations of males:
- Percentage of males in management occupations (except farmers):
Here: 41.2% California: 12.0%
- Percentage of males in business and financial operations occupations:
Here: 4.5% California: 4.9%
- Percentage of males in computer and mathematical occupations:
Here: 11.9% California: 5.7%
- Percentage of males in architecture and engineering occupations:
Here: 1.6% California: 3.8%
- Percentage of males in life, physical, and social science occupations:
Here: 1.3% California: 1.2%
- Percentage of males in service occupations:
Here: 4.4% California: 14.8%
- Percentage of males in sales and office occupations:
Here: 42.3% California: 14.7%
- Percentage of males in construction, extraction, and maintenance occupations:
Here: 1.5% California: 8.7%
- Percentage of males in transportation occupations:
Here: 1.9% California: 5.7%
Occupations of females:
- Percentage of females in management occupations (except farmers):
Here: 20.4% California: 10.2%
- Percentage of females in business and financial operations occupations:
Here: 9.5% California: 6.9%
- Percentage of females in life, physical, and social science occupations:
Here: 1.1% California: 1.5%
- Percentage of females in community and social services occupations:
Here: 15.6% California: 2.5%
- Percentage of females in legal occupations:
Here: 1.8% California: 1.5%
- Percentage of females in education, training, and library occupations:
Here: 13.1% California: 8.4%
- Percentage of females in healthcare practitioners and technical occupations:
Here: 11.6% California: 8.1%
- Percentage of females in service occupations:
Here: 27.9% California: 20.9%
- Percentage of females in sales and office occupations:
Here: 15.0% California: 26.2%
- Percentage of females in production occupations:
Here: 2.1% California: 3.0%
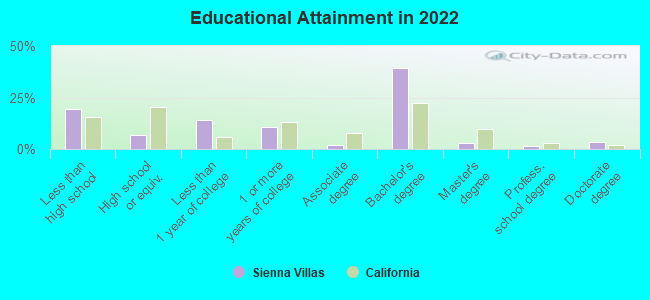
Education in this neighborhood (subdivision or community):
- Percentage of people 3 years and older in K-12 schools:
Sienna Villas: 17.1% California: 16.9%
- Percentage of people 3 years and older in undergraduate colleges:
Sienna Villas: 8.7% California: 6.3%
- Percentage of people 3 years and older in grad. or professional schools:
Sienna Villas: 4.7% California: 1.5%
- Percentage of students K-12 enrolled in private schools:
Sienna Villas: 66.0% California: 10.1%
Percentage of population below poverty level:
| Sienna Villas: | 9.8% |
| California: | 12.2% |
Median year owner moved in (as recorded in 2022):
Median year renter moved in (as recorded in 2022):
| Sienna Villas: | 2010 |
| California: | 2010 |
Median year renter moved in (as recorded in 2022):
| Sienna Villas: | 2011 |
| California: | 2019 |
Percentage of married-couple families with both working:
| Sienna Villas: | 286.6% |
| California: | 66.2% |
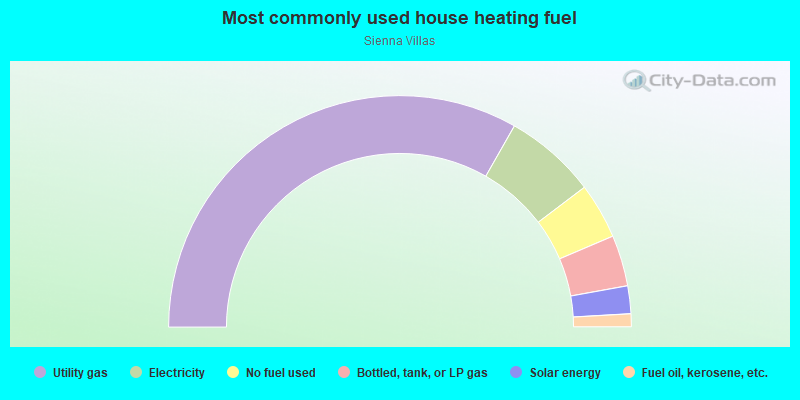
- 66.4%Utility gas
- 12.9%Electricity
- 7.8%No fuel used
- 7.1%Bottled, tank, or LP gas
- 3.9%Solar energy
- 1.8%Fuel oil, kerosene, etc.
Roads and streets:
W del Monte Dr
Length: 0.50 miles
Directions: E-W, N-S, SE-NW, SW-NE
Directions: E-W, N-S, SE-NW, SW-NE
del Monte Dr
Length: 0.14 miles
Directions: E-W, SW-NE
Address range: 522 to 24443
Directions: E-W, SW-NE
Address range: 522 to 24443
Valencia Blvd
Length: 0.02 miles
Direction: E-W
Address range: 24300 to 24307
Direction: E-W
Address range: 24300 to 24307