Southmoor Gardens neighborhood in Overland Park, Kansas (KS), 66204 detailed profile
Settings
X

Business Search - 14 Million verified businesses
Area: 0.484 square miles
Population: 1,195
Population density:
| Southmoor Gardens: | 2,467 people per square mile |
| Overland Park: | 3,485 people per square mile |

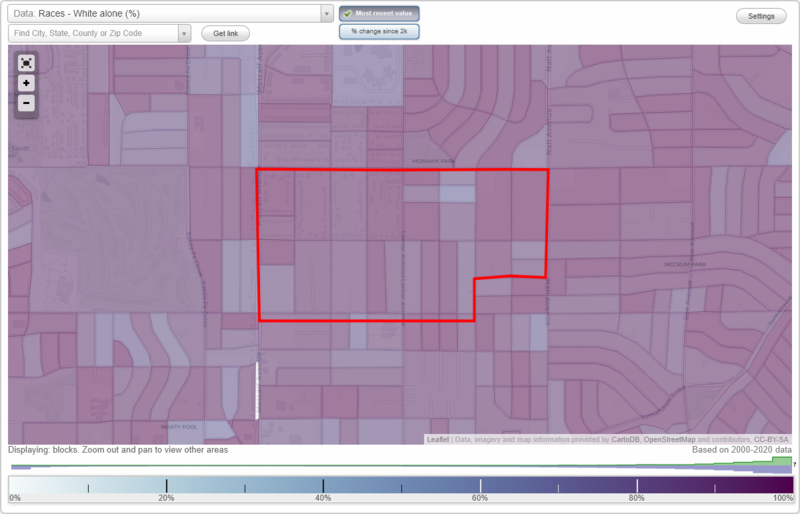
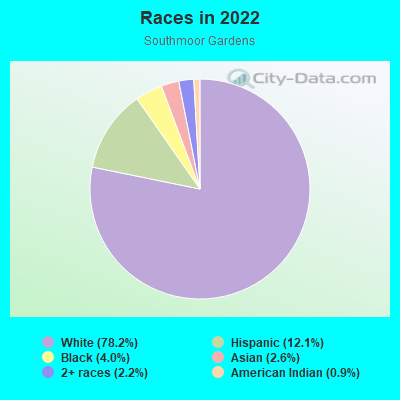
- 97778.2%White
- 15112.1%Hispanic or Latino
- 504.0%Black
- 332.6%Asian
- 282.2%Two or more races
- 110.9%American Indian
Distribution of median household income
![Distribution of median household income]()
- 34Less than $10,000
- 80$10,000 to $19,999
- 45$20,000 to $29,999
- 98$30,000 to $39,999
- 39$40,000 to $49,999
- 29$50,000 to $59,999
- 79$60,000 to $74,999
- 91$75,000 to $99,999
- 30$100,000 to $124,999
- 49$125,000 to $149,999
- 166$150,000 to $199,999
- 34$200,000 or more

Distribution of owner-occupied house/condo value
![Distribution of owner-occupied house/condo value]()
- 4Less than $50,000
- 4$50,000 to $99,999
- 207$100,000 to $149,999
- 464$150,000 to $199,999
- 110$200,000 to $249,999
- 49$250,000 to $299,999
- 149$300,000 to $399,999
- 27$400,000 to $499,999
- 26$500,000 to $749,999
- 1$750,000 to $999,999
- 94$1,000,000 or more

Distribution of rent paid by renters
![Distribution of rent paid by renters]()
- 20$300 to $399
- 4$800 to $899
- 66$900 to $999
- 54$1,000 to $1,249
- 45$1,250 to $1,499
- 47$1,500 to $1,999
- 5$2,000 or more

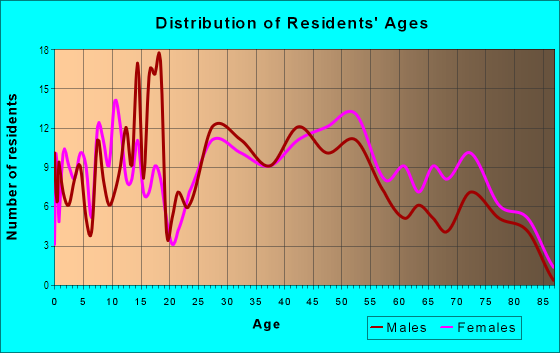
| Males: | 644 |
| Females: | 551 |
Males:
| This neighborhood: | 41.8 years |
| Whole city: | 37.7 years |
| This neighborhood: | 45.5 years |
| Whole city: | 38.8 years |
Average household size:
| Southmoor Gardens: | 2.2 people |
| Overland Park: | 2.3 people |
Percentage of family households:
| Southmoor Gardens: | 45.4% |
| Overland Park: | 42.1% |
| Here: | 65.3% |
| Overland Park: | 48.0% |
Percentage of married-couple families with children (among all households):
| Southmoor Gardens: | 40.9% |
| Overland Park: | 37.4% |
Percentage of single-mother households (among all households):
| Southmoor Gardens: | 16.5% |
| Overland Park: | 4.2% |
Percentage of never married males 15 years old and over:
Percentage of never married females 15 years old and over:
| Southmoor Gardens: | 17.0% |
| Overland Park: | 17.2% |
Percentage of never married females 15 years old and over:
| Southmoor Gardens: | 9.5% |
| city: | 15.1% |
Percentage of people that speak English not well or not at all:
| Southmoor Gardens: | 0.0% |
| Overland Park: | 1.4% |
Percentage of people born in this state:
Percentage of people born in another U.S. state:
Percentage of native residents but born outside the U.S.:
Percentage of foreign born residents:
| Here: | 48.7% |
| Overland Park: | 37.4% |
Percentage of people born in another U.S. state:
| Southmoor Gardens: | 46.1% |
| Overland Park: | 50.4% |
Percentage of native residents but born outside the U.S.:
| Here: | 1.8% |
| city: | 0.9% |
Percentage of foreign born residents:
| Here: | 3.3% |
| Overland Park: | 11.3% |
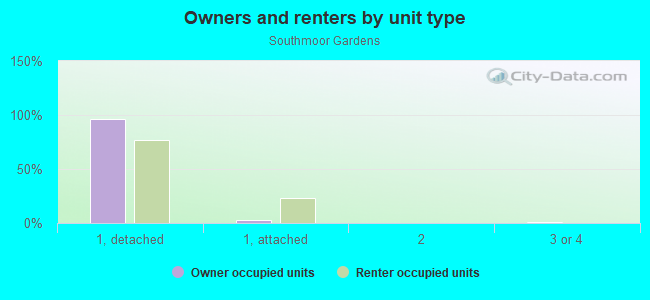
Owner-occupied
Renter-occupied

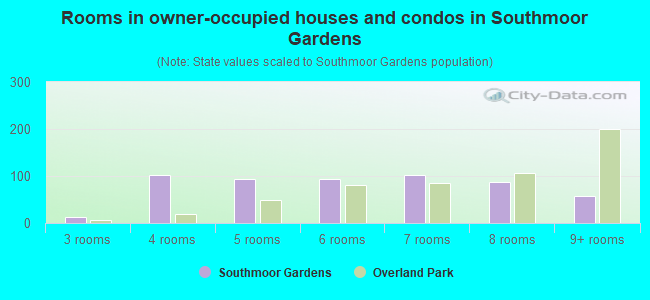
- Rooms in owner-occupied houses and condos in Southmoor Gardens
- 01 room
- 02 rooms
- 123 rooms
- 1024 rooms
- 945 rooms
- 946 rooms
- 1027 rooms
- 888 rooms
- 589+ rooms
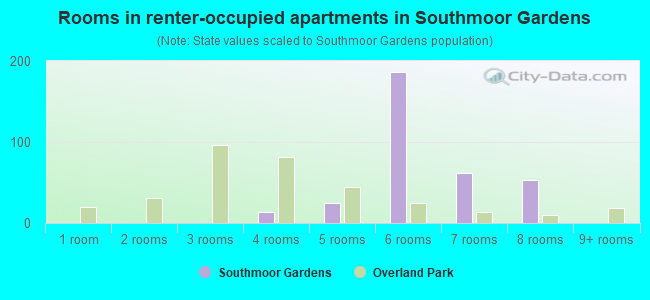
- Rooms in renter-occupied apartments in Southmoor Gardens
- 01 room
- 02 rooms
- 03 rooms
- 144 rooms
- 255 rooms
- 1876 rooms
- 627 rooms
- 538 rooms
- 09+ rooms
Owner-occupied
Renter-occupied
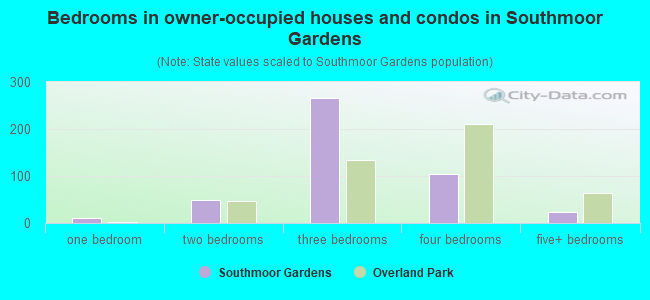
- Bedrooms in owner-occupied houses and condos in Southmoor Gardens
- 0no bedroom
- 111 bedroom
- 492 bedrooms
- 2673 bedrooms
- 1054 bedrooms
- 235+ bedrooms
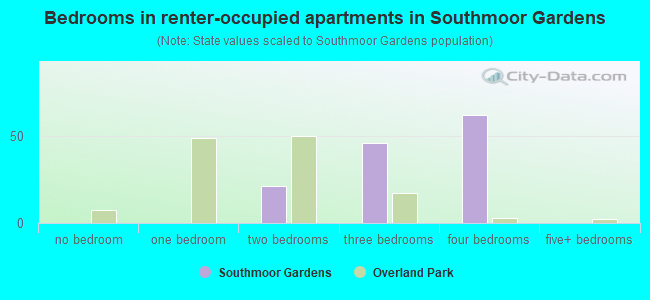
- Bedrooms in renter-occupied apartments in Southmoor Gardens
- 0no bedroom
- 01 bedroom
- 212 bedrooms
- 463 bedrooms
- 624 bedrooms
- 05+ bedrooms
Average number of cars or other vehicles available in houses/condos:
Average number of cars or other vehicles available in apartments:
| This neighborhood: | 4.2 |
| Overland Park: | 2.0 |
Average number of cars or other vehicles available in apartments:
| Here: | 9.6 |
| city: | 1.3 |
Percentage of units with a mortgage:
| Southmoor Gardens: | 79.0% |
| Overland Park: | 67.7% |
Average estimated value of detached houses in 2022 (98.7% of all units):
| Southmoor Gardens: | $238,974 |
| Kansas: | $264,181 |
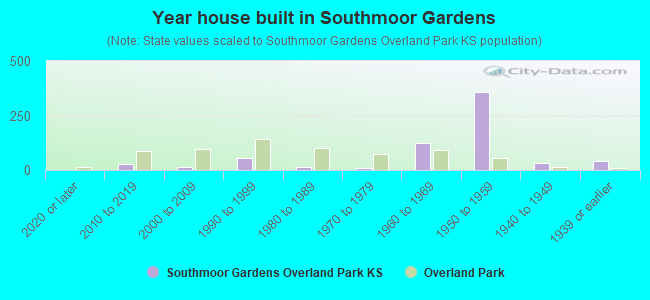
- Year house built in Southmoor Gardens
- 02020 or later
- 292010 to 2019
- 152000 to 2009
- 571990 to 1999
- 141980 to 1989
- 111970 to 1979
- 1251960 to 1969
- 3601950 to 1959
- 321940 to 1949
- 401939 or earlier
City-data.com crime index for city in 2020 (higher means more crime):
| City: | 154.8 |
| U.S. average: | 219.5 |
Travel time to work (commute)
![Travel time to work (commute)]()
- 33Less than 5 minutes
- 1175 to 9 minutes
- 9510 to 14 minutes
- 26715 to 19 minutes
- 25320 to 24 minutes
- 5625 to 29 minutes
- 5730 to 34 minutes
- 935 to 39 minutes
- 3040 to 44 minutes
- 3945 to 59 minutes
- 160 to 89 minutes
- 2390 or more minutes

Means of transportation to work
![Means of transportation to work]()
- 75.3%540Drove a car alone
- 11.6%83Carpooled
- 0.1%1Bus
- 1.3%9Motorcycle
- 1.1%8Bicycle
- 0.3%2Walked
- 18.4%132Worked at home

Time leaving home to go to work
![Time leaving home to go to work]()
- 712:00 a.m. to 4:59 a.m.
- 215:00 a.m. to 5:29 a.m.
- 445:30 a.m. to 5:59 a.m.
- 166:00 a.m. to 6:29 a.m.
- 986:30 a.m. to 6:59 a.m.
- 1467:00 a.m. to 7:29 a.m.
- 1637:30 a.m. to 7:59 a.m.
- 1408:00 a.m. to 8:29 a.m.
- 908:30 a.m. to 8:59 a.m.
- 519:00 a.m. to 9:59 a.m.
- 2310:00 a.m. to 10:59 a.m.
- 2311:00 a.m. to 11:59 a.m.
- 6112:00 p.m. to 3:59 p.m.
- 194:00 p.m. to 11:59 p.m.

Occupations of males:
- Percentage of males in management occupations (except farmers):
Here: 14.5% city: 17.2%
- Percentage of males in business and financial operations occupations:
Here: 10.4% city: 9.9%
- Percentage of males in computer and mathematical occupations:
Here: 31.7% city: 11.2%
- Percentage of males in life, physical, and social science occupations:
Here: 6.7% city: 1.6%
- Percentage of males in community and social services occupations:
Here: 3.6% city: 0.9%
- Percentage of males in education, training, and library occupations:
Here: 2.4% city: 2.4%
- Percentage of males in arts, design, entertainment, sports, and media occupations:
Here: 2.9% city: 2.6%
- Percentage of males in service occupations:
Here: 14.0% city: 9.7%
- Percentage of males in sales and office occupations:
Here: 8.3% city: 19.9%
- Percentage of males in production occupations:
Here: 2.3% city: 2.3%
Occupations of females:
- Percentage of females in management occupations (except farmers):
Here: 4.6% city: 10.8%
- Percentage of females in business and financial operations occupations:
Here: 13.3% city: 10.2%
- Percentage of females in architecture and engineering occupations:
Here: 3.6% city: 1.3%
- Percentage of females in life, physical, and social science occupations:
Here: 3.7% city: 1.2%
- Percentage of females in community and social services occupations:
Here: 3.0% city: 2.4%
- Percentage of females in legal occupations:
Here: 5.0% city: 1.6%
- Percentage of females in education, training, and library occupations:
Here: 21.7% city: 10.8%
- Percentage of females in arts, design, entertainment, sports, and media occupations:
Here: 7.9% city: 2.8%
- Percentage of females in healthcare practitioners and technical occupations:
Here: 2.9% city: 12.1%
- Percentage of females in service occupations:
Here: 10.3% city: 13.8%
- Percentage of females in sales and office occupations:
Here: 24.1% city: 25.2%
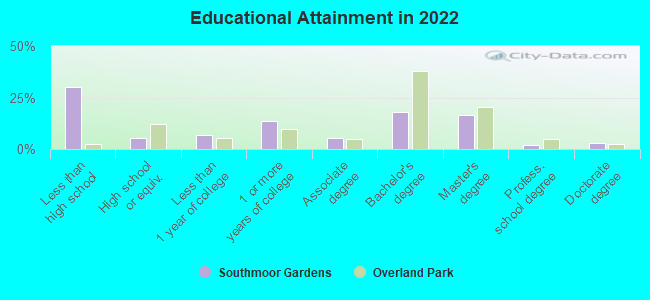
Education in this neighborhood (subdivision or community):
- Percentage of people 3 years and older in K-12 schools:
Southmoor Gardens: 25.3% Overland Park: 15.4%
- Percentage of people 3 years and older in undergraduate colleges:
Southmoor Gardens: 3.3% Overland Park: 3.4%
- Percentage of people 3 years and older in grad. or professional schools:
Southmoor Gardens: 3.7% Overland Park: 2.3%
- Percentage of students K-12 enrolled in private schools:
Southmoor Gardens: 27.7% Overland Park: 14.1%
Percentage of population below poverty level:
| Southmoor Gardens: | 1.1% |
| Overland Park: | 5.0% |
Median year owner moved in (as recorded in 2022):
| Southmoor Gardens: | 2006 |
| Overland Park: | 2013 |
Percentage of married-couple families with both working:
| Southmoor Gardens: | 210.5% |
| Overland Park: | 75.4% |
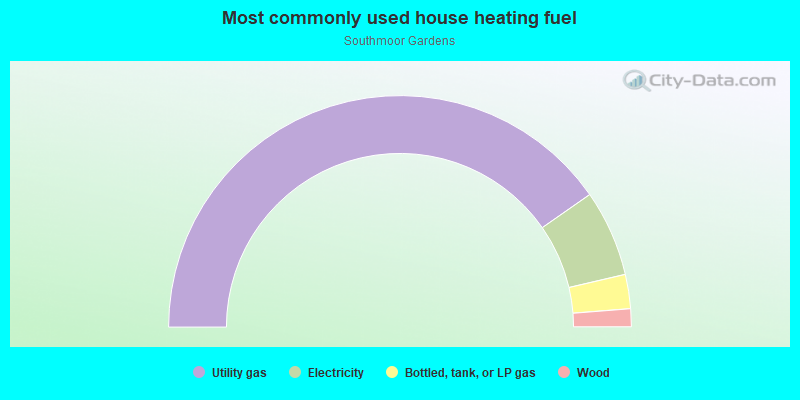
- 80.6%Utility gas
- 12.1%Electricity
- 4.8%Bottled, tank, or LP gas
- 2.5%Wood
Roads and streets:
W 69th St
Length: 1.12 miles
Direction: E-W
Address range: 5500 to 6899
Direction: E-W
Address range: 5500 to 6899
W 71st St
Length: 0.80 miles
Direction: E-W
Address range: 5900 to 6899
Direction: E-W
Address range: 5900 to 6899
Lamar Ave
Length: 0.47 miles
Direction: N-S
Address range: 6713 to 7099
Direction: N-S
Address range: 6713 to 7099
Beverly St
Length: 0.47 miles
Direction: N-S
Address range: 6672 to 7099
Direction: N-S
Address range: 6672 to 7099
W 67th Ter
Length: 0.46 miles
Directions: E-W, N-S, SW-NE
Address range: 5900 to 6799
Directions: E-W, N-S, SW-NE
Address range: 5900 to 6799
Woodson St
Length: 0.41 miles
Direction: N-S
Address range: 6728 to 7049
Direction: N-S
Address range: 6728 to 7049
Broadmoor St
Length: 0.33 miles
Direction: N-S
Address range: 6800 to 7099
Direction: N-S
Address range: 6800 to 7099
W 68th St
Length: 0.32 miles
Direction: E-W
Address range: 5900 to 6299
Direction: E-W
Address range: 5900 to 6299
Russell St
Length: 0.25 miles
Direction: N-S
Address range: 6900 to 7099
Direction: N-S
Address range: 6900 to 7099
Walmer St
Length: 0.25 miles
Direction: N-S
Address range: 6900 to 7099
Direction: N-S
Address range: 6900 to 7099
Glenwood St
Length: 0.25 miles
Direction: N-S
Address range: 6900 to 7099
Direction: N-S
Address range: 6900 to 7099
Horton St
Length: 0.25 miles
Direction: N-S
Address range: 6900 to 7099
Direction: N-S
Address range: 6900 to 7099
Dearborn St
Length: 0.25 miles
Direction: N-S
Address range: 6900 to 7099
Direction: N-S
Address range: 6900 to 7099
Barkley St
Length: 0.18 miles
Directions: N-S, SE-NW
Address range: 6900 to 7099
Directions: N-S, SE-NW
Address range: 6900 to 7099
Riggs St
Length: 0.09 miles
Directions: N-S, SW-NE
Address range: 7000 to 7099
Directions: N-S, SW-NE
Address range: 7000 to 7099
W 70th St
Length: 0.07 miles
Direction: E-W
Address range: 5800 to 5899
Direction: E-W
Address range: 5800 to 5899
Reeds Rd
Length: 0.06 miles
Direction: N-S
Address range: 6900 to 6918
Direction: N-S
Address range: 6900 to 6918
Outlook St
Length: 0.04 miles
Direction: N-S
Address range: 6900 to 6999
Direction: N-S
Address range: 6900 to 6999