Southridge neighborhood in Des Moines, Iowa (IA), 50315 detailed profile
Settings
X


Business Search - 14 Million verified businesses
Area: 0.383 square miles
Population: 1,223
Population density:
| Southridge: | 3,196 people per square mile |
| Des Moines: | 2,783 people per square mile |

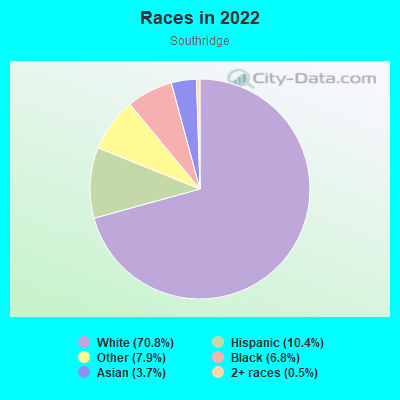
- 93970.8%White
- 13810.4%Hispanic or Latino
- 1057.9%Some other race
- 906.8%Black
- 493.7%Asian
- 60.5%Two or more races
Median household income in 2022:
| Southridge: | $46,460 |
| Des Moines: | $58,018 |
Distribution of median household income
![Distribution of median household income]()
- 88Less than $10,000
- 297$10,000 to $19,999
- 80$20,000 to $29,999
- 237$30,000 to $39,999
- 48$40,000 to $49,999
- 15$50,000 to $59,999
- 73$60,000 to $74,999
- 22$75,000 to $99,999
- 69$100,000 to $124,999
- 27$125,000 to $149,999
- 9$150,000 to $199,999
- 5$200,000 or more

Distribution of owner-occupied house/condo value
![Distribution of owner-occupied house/condo value]()
- 76Less than $50,000
- 316$50,000 to $99,999
- 128$100,000 to $149,999
- 91$150,000 to $199,999
- 31$200,000 to $249,999
- 2$250,000 to $299,999

Distribution of rent paid by renters
![Distribution of rent paid by renters]()
- 36Less than $100
- 11$100 to $199
- 60$200 to $299
- 34$300 to $399
- 93$400 to $499
- 74$600 to $699
- 240$700 to $799
- 11$800 to $899
- 5$900 to $999
- 20$1,000 to $1,249
- 18$1,500 to $1,999

Median rent in 2022:
| Southridge: | $685 |
| Des Moines: | $873 |
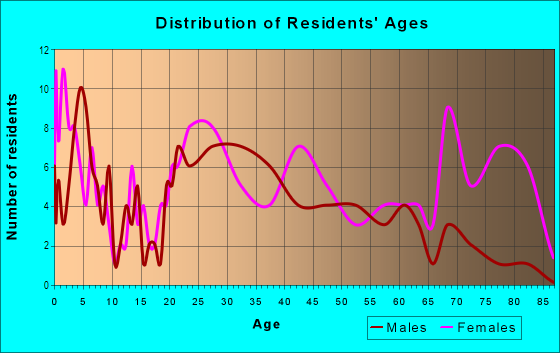
| Males: | 658 |
| Females: | 564 |
Males:
| This neighborhood: | 44.6 years |
| Whole city: | 34.7 years |
| This neighborhood: | 45.2 years |
| Whole city: | 35.5 years |
Average household size:
| Southridge: | 2.0 people |
| Des Moines: | 2.2 people |
Percentage of family households:
| Southridge: | 16.2% |
| Des Moines: | 40.8% |
| Here: | 11.6% |
| Des Moines: | 32.7% |
Percentage of married-couple families with children (among all households):
| Southridge: | 47.3% |
| Des Moines: | 26.2% |
Percentage of single-mother households (among all households):
| Southridge: | 23.4% |
| Des Moines: | 14.0% |
Percentage of never married males 15 years old and over:
Percentage of never married females 15 years old and over:
| Southridge: | 19.8% |
| Des Moines: | 21.4% |
Percentage of never married females 15 years old and over:
| Southridge: | 20.6% |
| city: | 19.3% |
Percentage of people that speak English not well or not at all:
| Southridge: | 5.6% |
| Des Moines: | 5.0% |
Percentage of people born in this state:
Percentage of people born in another U.S. state:
Percentage of native residents but born outside the U.S.:
Percentage of foreign born residents:
| Here: | 64.7% |
| Des Moines: | 64.1% |
Percentage of people born in another U.S. state:
| Southridge: | 22.0% |
| Des Moines: | 19.2% |
Percentage of native residents but born outside the U.S.:
| Here: | 0.2% |
| city: | 0.5% |
Percentage of foreign born residents:
| Here: | 13.1% |
| Des Moines: | 16.2% |
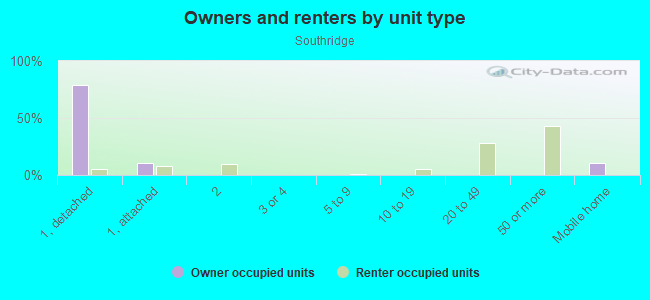
Owner-occupied
Renter-occupied

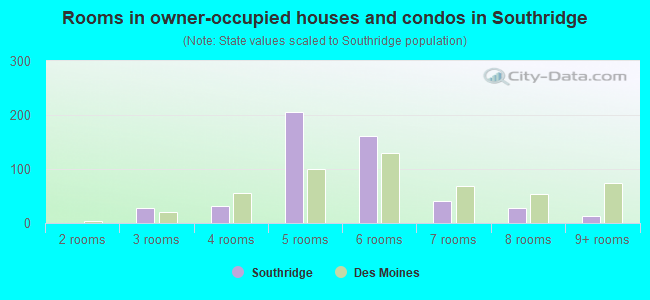
- Rooms in owner-occupied houses and condos in Southridge
- 01 room
- 02 rooms
- 273 rooms
- 314 rooms
- 2065 rooms
- 1616 rooms
- 417 rooms
- 278 rooms
- 139+ rooms
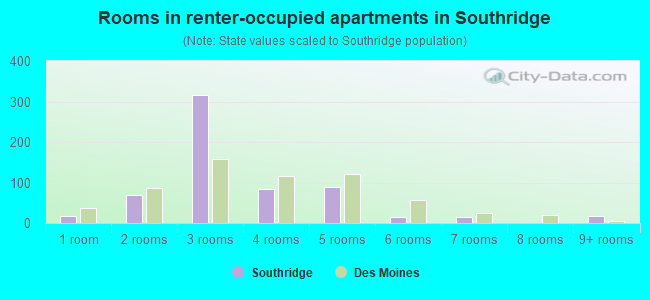
- Rooms in renter-occupied apartments in Southridge
- 171 room
- 692 rooms
- 3163 rooms
- 844 rooms
- 895 rooms
- 156 rooms
- 167 rooms
- 08 rooms
- 179+ rooms
Owner-occupied
Renter-occupied
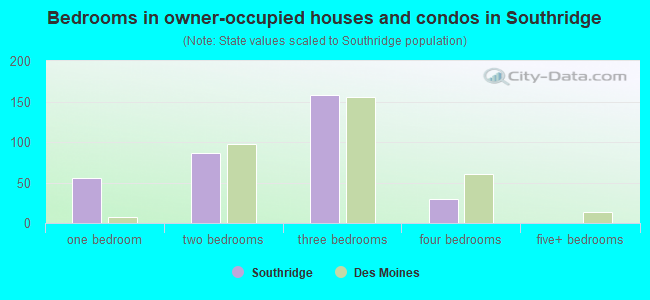
- Bedrooms in owner-occupied houses and condos in Southridge
- 0no bedroom
- 561 bedroom
- 872 bedrooms
- 1583 bedrooms
- 304 bedrooms
- 05+ bedrooms
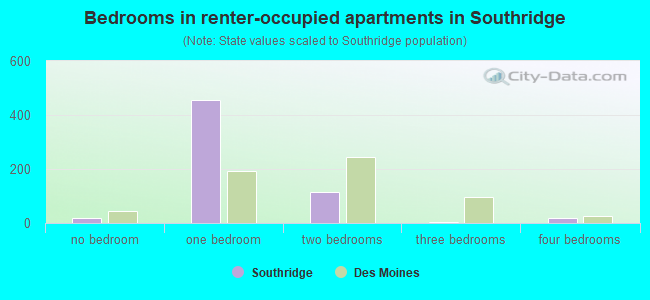
- Bedrooms in renter-occupied apartments in Southridge
- 17no bedroom
- 4571 bedroom
- 1132 bedrooms
- 43 bedrooms
- 174 bedrooms
- 05+ bedrooms
Average number of cars or other vehicles available in houses/condos:
Average number of cars or other vehicles available in apartments:
| This neighborhood: | 1.8 |
| Des Moines: | 1.9 |
Average number of cars or other vehicles available in apartments:
| Here: | 0.6 |
| city: | 1.2 |
Percentage of units with a mortgage:
| Southridge: | 39.9% |
| Des Moines: | 69.7% |
Average estimated value of detached houses in 2022 (31.6% of all units):
| Southridge: | $98,099 |
| Des Moines: | $201,532 |
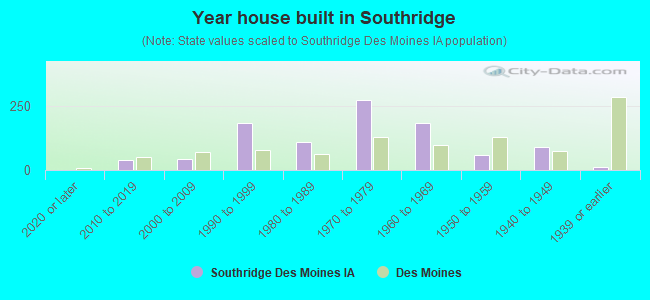
- Year house built in Southridge
- 02020 or later
- 382010 to 2019
- 442000 to 2009
- 1831990 to 1999
- 1081980 to 1989
- 2751970 to 1979
- 1841960 to 1969
- 591950 to 1959
- 901940 to 1949
- 121939 or earlier
City-data.com crime index for city in 2020 (higher means more crime):
| City: | 422.4 |
| U.S. average: | 219.5 |
Travel time to work (commute)
![Travel time to work (commute)]()
- 1Less than 5 minutes
- 1135 to 9 minutes
- 10510 to 14 minutes
- 10515 to 19 minutes
- 24120 to 24 minutes
- 10825 to 29 minutes
- 12630 to 34 minutes
- 135 to 39 minutes
- 3240 to 44 minutes
- 1245 to 59 minutes
- 560 to 89 minutes
- 2790 or more minutes

Means of transportation to work
![Means of transportation to work]()
- 60.6%361Drove a car alone
- 15.6%93Carpooled
- 2.2%13Bus
- 13.9%83Taxi
- 1.5%9Bicycle
- 1.3%8Walked
- 7.1%42Worked at home

Time leaving home to go to work
![Time leaving home to go to work]()
- 4712:00 a.m. to 4:59 a.m.
- 365:00 a.m. to 5:29 a.m.
- 435:30 a.m. to 5:59 a.m.
- 836:00 a.m. to 6:29 a.m.
- 1496:30 a.m. to 6:59 a.m.
- 997:00 a.m. to 7:29 a.m.
- 657:30 a.m. to 7:59 a.m.
- 338:00 a.m. to 8:29 a.m.
- 208:30 a.m. to 8:59 a.m.
- 629:00 a.m. to 9:59 a.m.
- 4310:00 a.m. to 10:59 a.m.
- 1111:00 a.m. to 11:59 a.m.
- 7312:00 p.m. to 3:59 p.m.
- 1104:00 p.m. to 11:59 p.m.

Occupations of males:
- Percentage of males in management occupations (except farmers):
Here: 2.4% city: 9.3%
- Percentage of males in business and financial operations occupations:
Here: 2.4% city: 5.5%
- Percentage of males in computer and mathematical occupations:
Here: 4.1% city: 6.0%
- Percentage of males in service occupations:
Here: 18.4% city: 13.1%
- Percentage of males in sales and office occupations:
Here: 39.0% city: 15.2%
- Percentage of males in construction, extraction, and maintenance occupations:
Here: 26.9% city: 10.0%
- Percentage of males in production occupations:
Here: 2.9% city: 9.9%
- Percentage of males in transportation occupations:
Here: 1.3% city: 6.3%
- Percentage of males in material moving occupations:
Here: 6.6% city: 7.2%
Occupations of females:
- Percentage of females in management occupations (except farmers):
Here: 18.4% city: 8.5%
- Percentage of females in business and financial operations occupations:
Here: 6.8% city: 7.3%
- Percentage of females in education, training, and library occupations:
Here: 5.8% city: 7.0%
- Percentage of females in arts, design, entertainment, sports, and media occupations:
Here: 3.1% city: 2.6%
- Percentage of females in service occupations:
Here: 38.1% city: 23.4%
- Percentage of females in sales and office occupations:
Here: 24.8% city: 27.7%
- Percentage of females in production occupations:
Here: 6.1% city: 5.0%
- Percentage of females in material moving occupations:
Here: 2.3% city: 2.1%
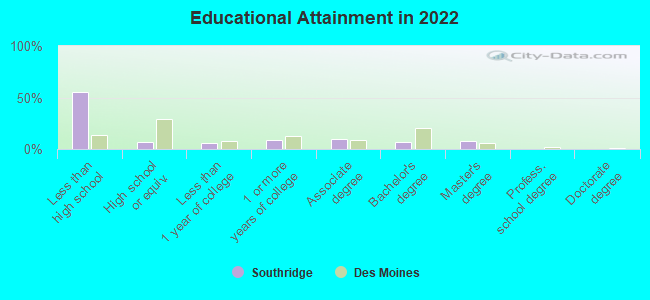
Education in this neighborhood (subdivision or community):
- Percentage of people 3 years and older in K-12 schools:
Southridge: 35.6% Des Moines: 17.5%
- Percentage of people 3 years and older in undergraduate colleges:
Southridge: 7.4% Des Moines: 3.7%
- Percentage of people 3 years and older in grad. or professional schools:
Southridge: 0.8% Des Moines: 1.6%
- Percentage of students K-12 enrolled in private schools:
Southridge: 2.1% Des Moines: 6.9%
Percentage of population below poverty level:
| Southridge: | 11.3% |
| Des Moines: | 14.7% |
Median year owner moved in (as recorded in 2022):
Median year renter moved in (as recorded in 2022):
| Southridge: | 2002 |
| Des Moines: | 2011 |
Median year renter moved in (as recorded in 2022):
| Southridge: | 2014 |
| Des Moines: | 2020 |
Percentage of married-couple families with both working:
| Southridge: | 334.6% |
| Des Moines: | 73.4% |
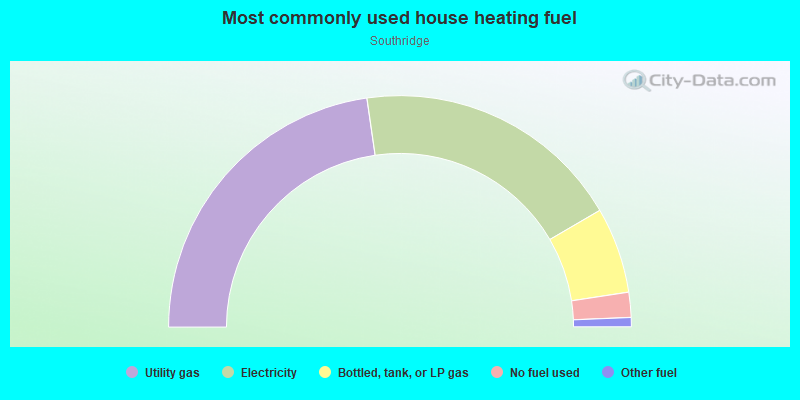
- 45.4%Utility gas
- 37.7%Electricity
- 12.0%Bottled, tank, or LP gas
- 3.5%No fuel used
- 1.3%Other fuel
Highways in this neighborhood:
SE 14th St (US Hwy 69)
Length: 0.49 miles
Direction: N-S
Direction: N-S
Roads and streets:
E Army Post Rd
Length: 0.50 miles
Direction: E-W
Address range: 740 to 1399
Direction: E-W
Address range: 740 to 1399
Cummins Rd
Length: 0.25 miles
Directions: E-W, SE-NW
Address range: 1100 to 1399
Directions: E-W, SE-NW
Address range: 1100 to 1399
SE Bloomfield Rd
Length: 0.01 miles
Direction: E-W
Direction: E-W