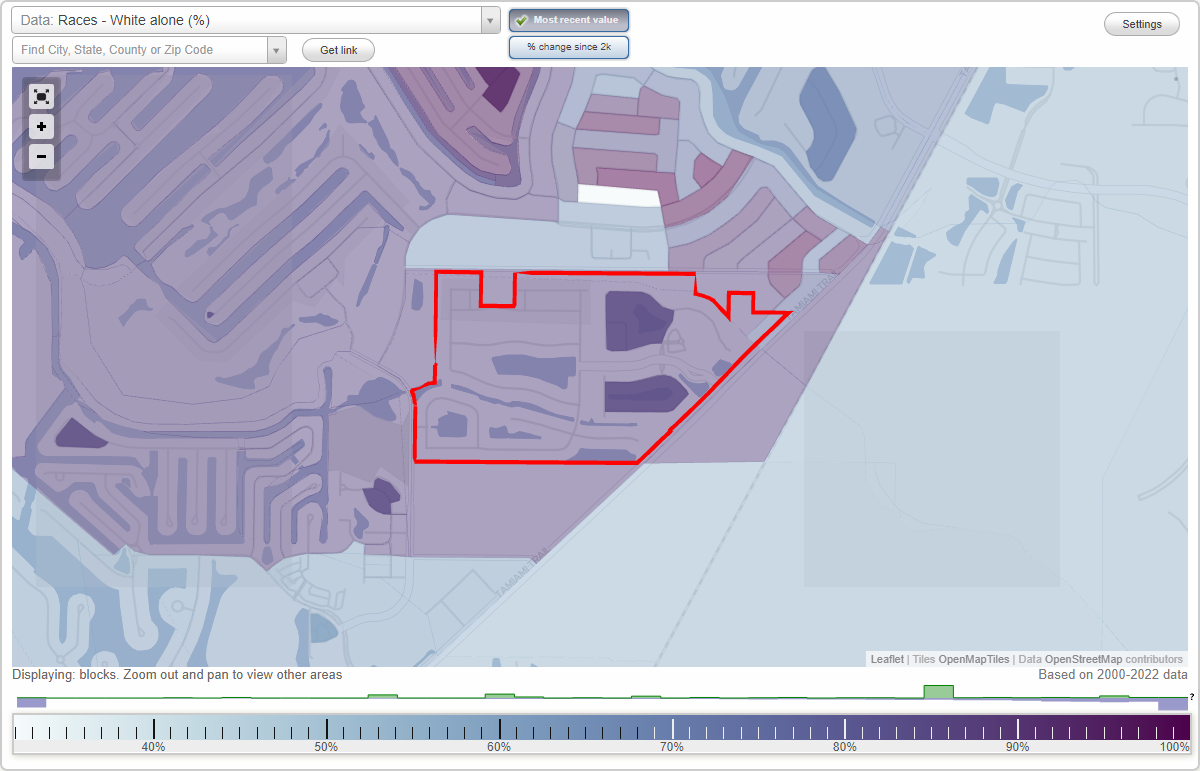
Southshore Falls neighborhood in Apollo Beach, Florida (FL), 33572 detailed profile
Settings
X

Business Search - 14 Million verified businesses
Area: 0.366 square miles
Population: 1,396
Population density:
| Southshore Falls: | 3,812 people per square mile |
| Apollo Beach: | 4,648 people per square mile |

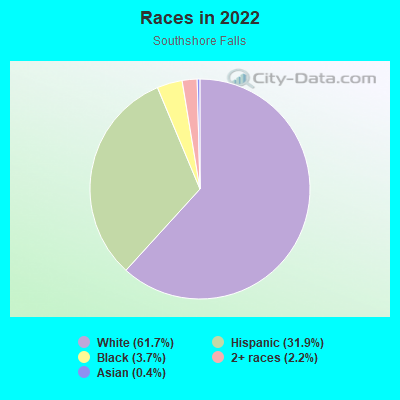
- 86161.7%White
- 44531.9%Hispanic or Latino
- 523.7%Black
- 312.2%Two or more races
- 60.4%Asian
Median household income in 2022:
| Southshore Falls: | $76,887 |
| Apollo Beach: | $110,425 |
Distribution of median household income
![Distribution of median household income]()
- 35Less than $10,000
- 17$10,000 to $19,999
- 57$20,000 to $29,999
- 19$30,000 to $39,999
- 54$40,000 to $49,999
- 6$50,000 to $59,999
- 72$60,000 to $74,999
- 118$75,000 to $99,999
- 68$100,000 to $124,999
- 16$125,000 to $149,999
- 51$150,000 to $199,999
- 17$200,000 or more

Distribution of owner-occupied house/condo value
![Distribution of owner-occupied house/condo value]()
- 23Less than $50,000
- 26$50,000 to $99,999
- 49$100,000 to $149,999
- 103$150,000 to $199,999
- 39$200,000 to $249,999
- 38$250,000 to $299,999
- 42$300,000 to $399,999
- 49$400,000 to $499,999
- 7$500,000 to $749,999
- 19$750,000 to $999,999

Distribution of rent paid by renters
![Distribution of rent paid by renters]()
- 3$800 to $899
- 14$900 to $999
- 25$1,000 to $1,249
- 95$1,250 to $1,499
- 6$1,500 to $1,999
- 41$2,000 or more

Median rent in 2022:
| Southshore Falls: | $1,333 |
| Apollo Beach: | $1,642 |
Zip codes: 33572.
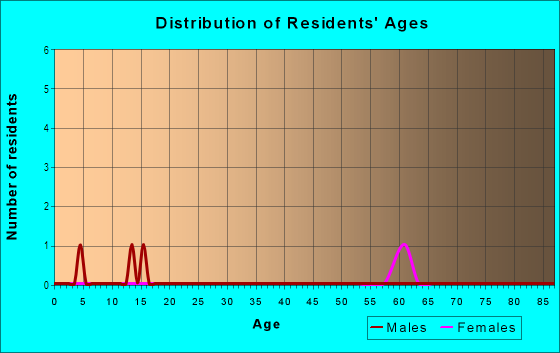
| Males: | 748 |
| Females: | 648 |
Males:
| This neighborhood: | 31.6 years |
| Whole city: | 42.8 years |
| This neighborhood: | 32.7 years |
| Whole city: | 43.6 years |
Average household size:
| Southshore Falls: | 2.9 people |
| Apollo Beach: | 2.6 people |
Percentage of family households:
| Southshore Falls: | 62.1% |
| Apollo Beach: | 52.5% |
| Here: | 49.4% |
| Apollo Beach: | 67.5% |
Percentage of married-couple families with children (among all households):
| Southshore Falls: | 18.0% |
| Apollo Beach: | 31.3% |
Percentage of single-mother households (among all households):
| Southshore Falls: | 14.4% |
| Apollo Beach: | 4.5% |
Percentage of never married males 15 years old and over:
Percentage of never married females 15 years old and over:
| Southshore Falls: | 21.0% |
| Apollo Beach: | 11.6% |
Percentage of never married females 15 years old and over:
| Southshore Falls: | 14.0% |
| place: | 9.8% |
Percentage of people that speak English not well or not at all:
| Southshore Falls: | 4.5% |
| Apollo Beach: | 1.7% |
Percentage of people born in this state:
Percentage of people born in another U.S. state:
Percentage of native residents but born outside the U.S.:
Percentage of foreign born residents:
| Here: | 41.6% |
| Apollo Beach: | 32.7% |
Percentage of people born in another U.S. state:
| Southshore Falls: | 44.0% |
| Apollo Beach: | 52.1% |
Percentage of native residents but born outside the U.S.:
| Here: | 0.7% |
| place: | 5.2% |
Percentage of foreign born residents:
| Here: | 13.7% |
| Apollo Beach: | 10.0% |
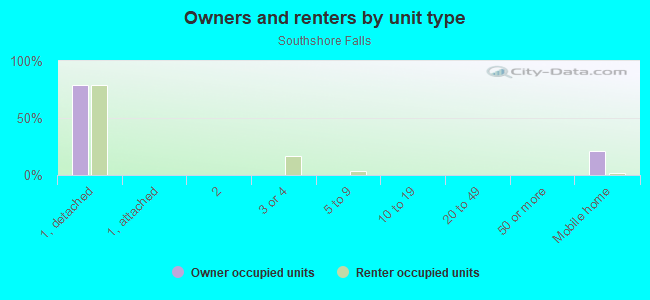
Owner-occupied
Renter-occupied

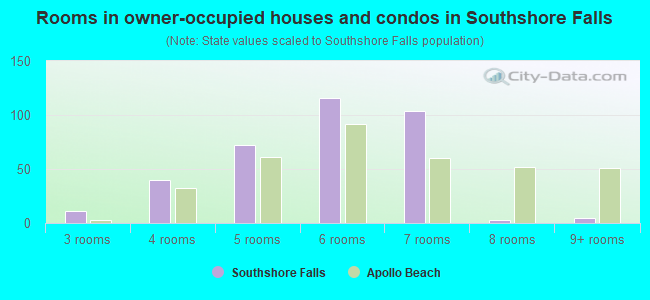
- Rooms in owner-occupied houses and condos in Southshore Falls
- 01 room
- 02 rooms
- 113 rooms
- 404 rooms
- 725 rooms
- 1166 rooms
- 1047 rooms
- 38 rooms
- 59+ rooms
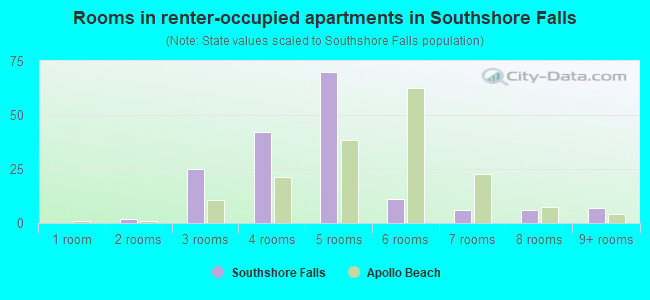
- Rooms in renter-occupied apartments in Southshore Falls
- 01 room
- 22 rooms
- 253 rooms
- 424 rooms
- 705 rooms
- 116 rooms
- 67 rooms
- 68 rooms
- 79+ rooms
Owner-occupied
Renter-occupied
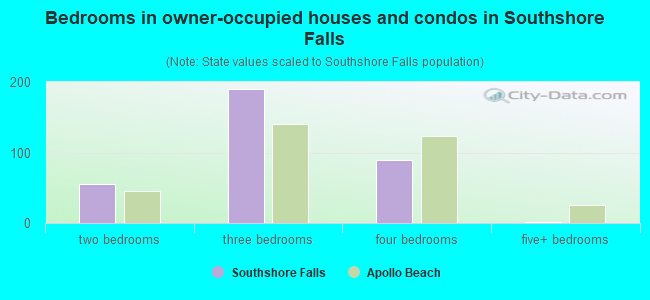
- Bedrooms in owner-occupied houses and condos in Southshore Falls
- 0no bedroom
- 01 bedroom
- 552 bedrooms
- 1903 bedrooms
- 904 bedrooms
- 25+ bedrooms
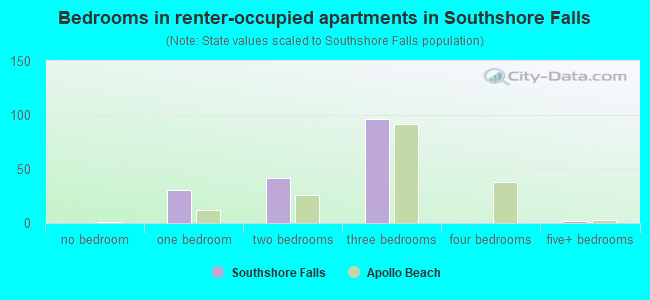
- Bedrooms in renter-occupied apartments in Southshore Falls
- 0no bedroom
- 311 bedroom
- 422 bedrooms
- 963 bedrooms
- 04 bedrooms
- 25+ bedrooms
Average number of cars or other vehicles available in houses/condos:
Average number of cars or other vehicles available in apartments:
| This neighborhood: | 2.0 |
| Apollo Beach: | 2.0 |
Average number of cars or other vehicles available in apartments:
| Here: | 1.9 |
| place: | 1.9 |
Percentage of units with a mortgage:
| Southshore Falls: | 89.4% |
| Apollo Beach: | 70.6% |
Average estimated value of detached houses in 2022 (100.0% of all units):
| Southshore Falls: | $236,987 |
| Florida: | $500,941 |
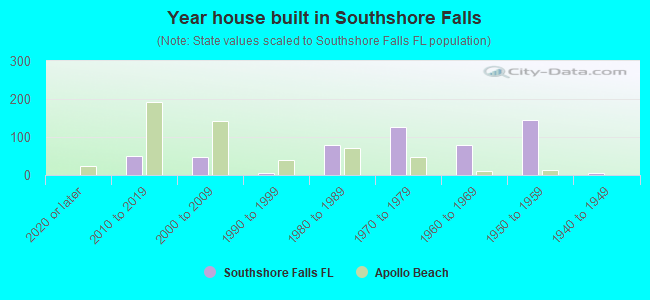
- Year house built in Southshore Falls
- 02020 or later
- 492010 to 2019
- 482000 to 2009
- 61990 to 1999
- 791980 to 1989
- 1271970 to 1979
- 791960 to 1969
- 1441950 to 1959
- 51940 to 1949
- 01939 or earlier
Travel time to work (commute)
![Travel time to work (commute)]()
- 165 to 9 minutes
- 1110 to 14 minutes
- 5915 to 19 minutes
- 3020 to 24 minutes
- 225 to 29 minutes
- 8830 to 34 minutes
- 3235 to 39 minutes
- 1740 to 44 minutes
- 15745 to 59 minutes
- 3860 to 89 minutes
- 1690 or more minutes

Means of transportation to work
![Means of transportation to work]()
- 86.9%614Drove a car alone
- 5.9%42Carpooled
- 0.8%6Other means
- 5.9%42Worked at home

Time leaving home to go to work
![Time leaving home to go to work]()
- 912:00 a.m. to 4:59 a.m.
- 75:00 a.m. to 5:29 a.m.
- 385:30 a.m. to 5:59 a.m.
- 566:00 a.m. to 6:29 a.m.
- 166:30 a.m. to 6:59 a.m.
- 997:00 a.m. to 7:29 a.m.
- 247:30 a.m. to 7:59 a.m.
- 798:00 a.m. to 8:29 a.m.
- 58:30 a.m. to 8:59 a.m.
- 329:00 a.m. to 9:59 a.m.
- 510:00 a.m. to 10:59 a.m.
- 911:00 a.m. to 11:59 a.m.
- 512:00 p.m. to 3:59 p.m.
- 324:00 p.m. to 11:59 p.m.

Occupations of males:
- Percentage of males in management occupations (except farmers):
Here: 5.1% place: 19.8%
- Percentage of males in business and financial operations occupations:
Here: 6.4% place: 7.9%
- Percentage of males in computer and mathematical occupations:
Here: 1.4% place: 8.0%
- Percentage of males in architecture and engineering occupations:
Here: 1.6% place: 1.8%
- Percentage of males in healthcare practitioners and technical occupations:
Here: 6.5% place: 2.8%
- Percentage of males in service occupations:
Here: 8.5% place: 11.3%
- Percentage of males in sales and office occupations:
Here: 20.7% place: 17.5%
- Percentage of males in construction, extraction, and maintenance occupations:
Here: 26.5% place: 7.5%
- Percentage of males in production occupations:
Here: 2.1% place: 3.7%
- Percentage of males in transportation occupations:
Here: 8.7% place: 4.2%
- Percentage of males in material moving occupations:
Here: 7.3% place: 3.6%
Occupations of females:
- Percentage of females in management occupations (except farmers):
Here: 8.1% place: 15.2%
- Percentage of females in business and financial operations occupations:
Here: 1.7% place: 7.2%
- Percentage of females in computer and mathematical occupations:
Here: 2.1% place: 1.4%
- Percentage of females in community and social services occupations:
Here: 1.9% place: 1.0%
- Percentage of females in legal occupations:
Here: 8.4% place: 3.0%
- Percentage of females in education, training, and library occupations:
Here: 6.0% place: 10.3%
- Percentage of females in healthcare practitioners and technical occupations:
Here: 1.9% place: 15.9%
- Percentage of females in service occupations:
Here: 27.9% place: 11.7%
- Percentage of females in sales and office occupations:
Here: 43.4% place: 29.0%
- Percentage of females in production occupations:
Here: 2.4% place: 0.7%
- Percentage of females in transportation occupations:
Here: 2.1% place: 0.4%
- Percentage of females in material moving occupations:
Here: 2.4% place: 1.9%
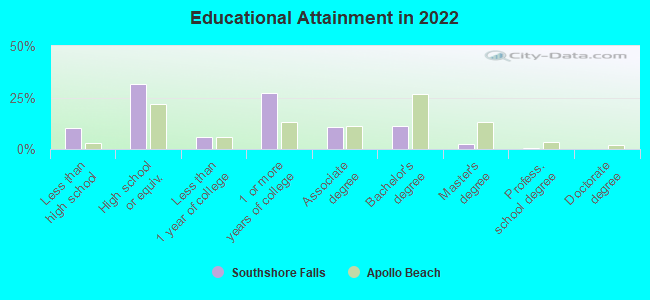
Education in this neighborhood (subdivision or community):
- Percentage of people 3 years and older in K-12 schools:
Southshore Falls: 20.7% Apollo Beach: 15.8%
- Percentage of people 3 years and older in undergraduate colleges:
Southshore Falls: 1.3% Apollo Beach: 4.4%
- Percentage of people 3 years and older in grad. or professional schools:
Southshore Falls: 0.9% Apollo Beach: 1.0%
- Percentage of students K-12 enrolled in private schools:
Southshore Falls: 4.2% Apollo Beach: 8.0%
Percentage of population below poverty level:
| Southshore Falls: | 7.9% |
| Apollo Beach: | 3.9% |
Median year owner moved in (as recorded in 2022):
Median year renter moved in (as recorded in 2022):
| Southshore Falls: | 2017 |
| Apollo Beach: | 2015 |
Median year renter moved in (as recorded in 2022):
| Southshore Falls: | 2015 |
| Apollo Beach: | 2019 |
Percentage of married-couple families with both working:
| Southshore Falls: | 100.0% |
| Apollo Beach: | 89.9% |
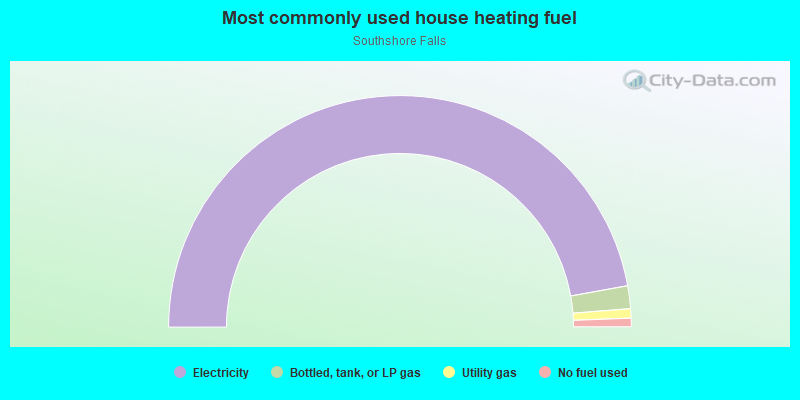
- 94.3%Electricity
- 3.2%Bottled, tank, or LP gas
- 1.3%Utility gas
- 1.2%No fuel used