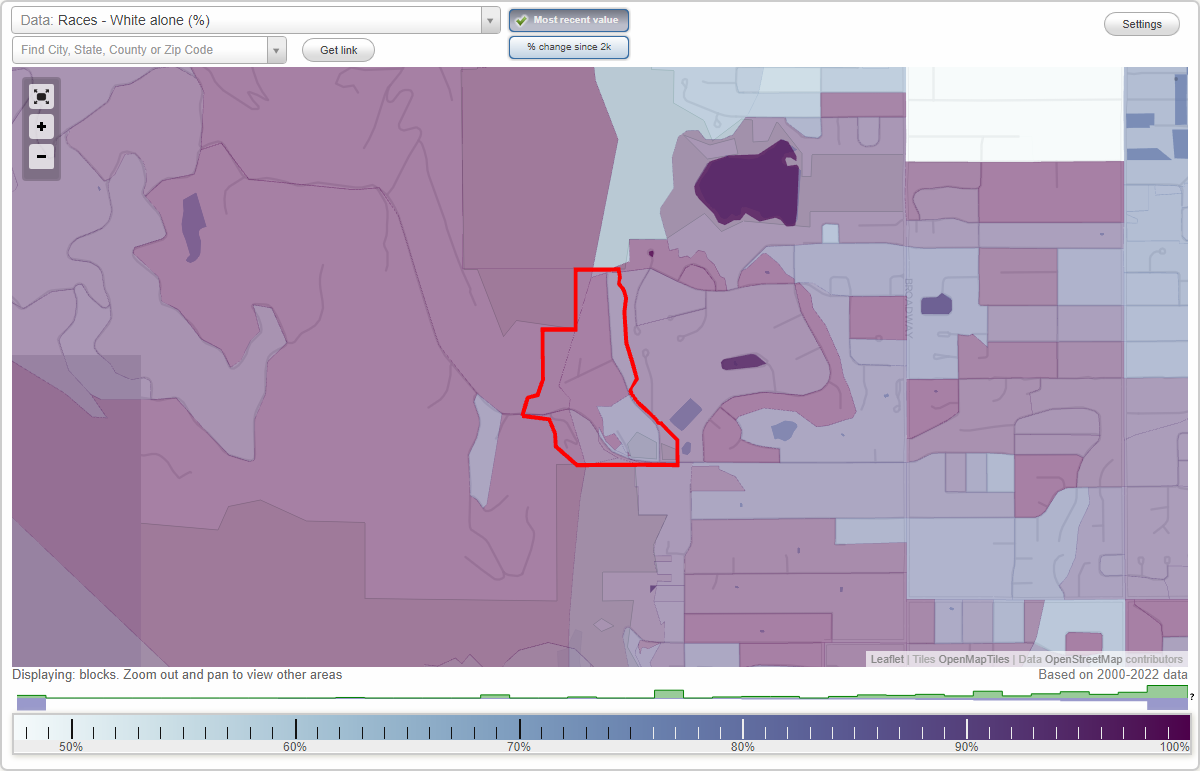
Spring Valley Estates neighborhood in Boulder, Colorado (CO), 80304 detailed profile
Settings
X

Business Search - 14 Million verified businesses
Area: 0.086 square miles
Population: 257
Population density:
| Spring Valley Estates: | 2,992 people per square mile |
| Boulder: | 4,328 people per square mile |

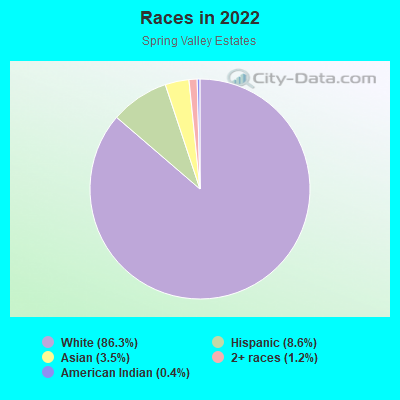
- 22086.3%White
- 228.6%Hispanic or Latino
- 93.5%Asian
- 31.2%Two or more races
- 10.4%American Indian
Median household income in 2022:
| Spring Valley Estates: | $144,223 |
| Boulder: | $81,608 |
Distribution of median household income
![Distribution of median household income]()
- 2Less than $10,000
- 10$10,000 to $19,999
- 4$20,000 to $29,999
- 4$30,000 to $39,999
- 14$40,000 to $49,999
- 17$50,000 to $59,999
- 8$60,000 to $74,999
- 3$75,000 to $99,999
- 19$100,000 to $124,999
- 19$125,000 to $149,999
- 14$150,000 to $199,999
- 36$200,000 or more

Distribution of owner-occupied house/condo value
![Distribution of owner-occupied house/condo value]()
- 5Less than $50,000
- 2$50,000 to $99,999
- 5$100,000 to $149,999
- 2$400,000 to $499,999
- 3$500,000 to $749,999
- 30$750,000 to $999,999
- 74$1,000,000 or more

Distribution of rent paid by renters
![Distribution of rent paid by renters]()
- 3Less than $100
- 3$100 to $199
- 5$200 to $299
- 4$400 to $499
- 2$500 to $599
- 2$600 to $699
- 4$900 to $999
- 2$1,000 to $1,249
- 5$1,250 to $1,499
- 2$1,500 to $1,999
- 21$2,000 or more

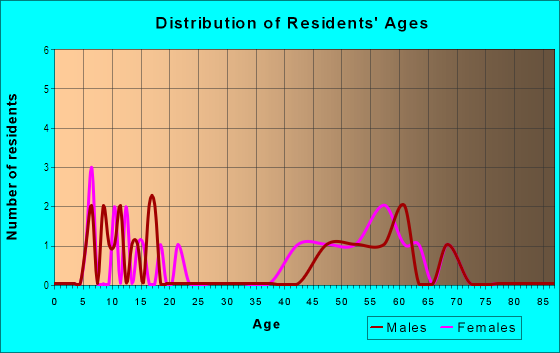
| Males: | 119 |
| Females: | 137 |
Males:
| This neighborhood: | 53.9 years |
| Whole city: | 28.3 years |
| This neighborhood: | 50.2 years |
| Whole city: | 29.2 years |
Average household size:
| Spring Valley Estates: | 2.2 people |
| Boulder: | 2.1 people |
Percentage of family households:
| Spring Valley Estates: | 38.2% |
| Boulder: | 26.9% |
| Here: | 70.6% |
| Boulder: | 30.4% |
Percentage of married-couple families with children (among all households):
| Spring Valley Estates: | 46.4% |
| Boulder: | 32.8% |
Percentage of single-mother households (among all households):
| Spring Valley Estates: | 23.7% |
| Boulder: | 6.3% |
Percentage of never married males 15 years old and over:
Percentage of never married females 15 years old and over:
| Spring Valley Estates: | 8.0% |
| Boulder: | 32.7% |
Percentage of never married females 15 years old and over:
| Spring Valley Estates: | 6.6% |
| city: | 28.3% |
Percentage of people that speak English not well or not at all:
| Spring Valley Estates: | 0.0% |
| Boulder: | 1.0% |
Percentage of people born in this state:
Percentage of people born in another U.S. state:
Percentage of native residents but born outside the U.S.:
Percentage of foreign born residents:
| Here: | 25.2% |
| Boulder: | 28.3% |
Percentage of people born in another U.S. state:
| Spring Valley Estates: | 60.6% |
| Boulder: | 60.5% |
Percentage of native residents but born outside the U.S.:
| Here: | 1.6% |
| city: | 2.1% |
Percentage of foreign born residents:
| Here: | 12.6% |
| Boulder: | 9.1% |
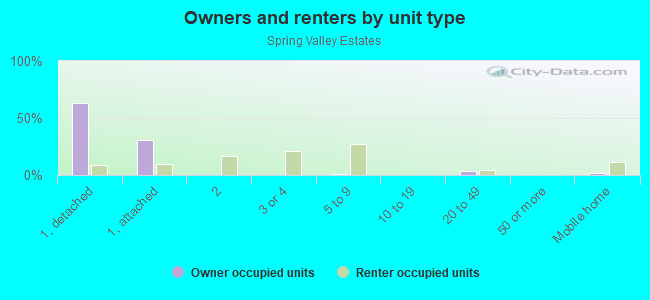
Owner-occupied
Renter-occupied

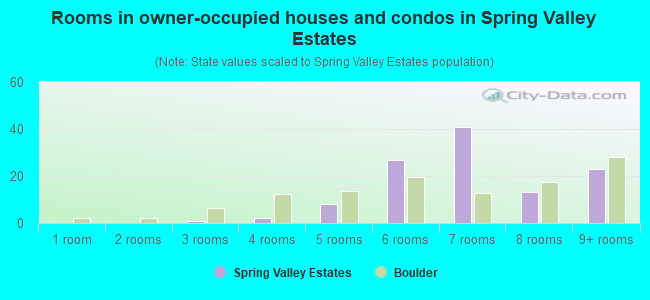
- Rooms in owner-occupied houses and condos in Spring Valley Estates
- 01 room
- 02 rooms
- 13 rooms
- 24 rooms
- 85 rooms
- 276 rooms
- 417 rooms
- 138 rooms
- 239+ rooms
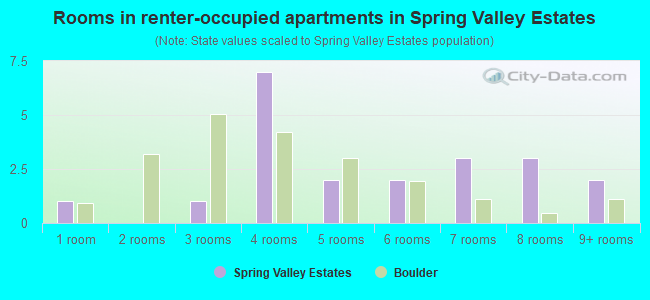
- Rooms in renter-occupied apartments in Spring Valley Estates
- 11 room
- 02 rooms
- 13 rooms
- 74 rooms
- 25 rooms
- 26 rooms
- 37 rooms
- 38 rooms
- 29+ rooms
Owner-occupied
Renter-occupied
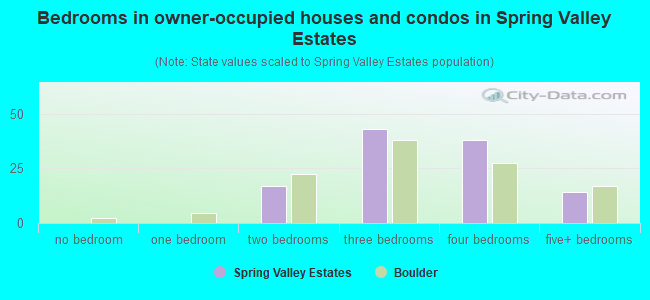
- Bedrooms in owner-occupied houses and condos in Spring Valley Estates
- 0no bedroom
- 01 bedroom
- 172 bedrooms
- 433 bedrooms
- 384 bedrooms
- 145+ bedrooms
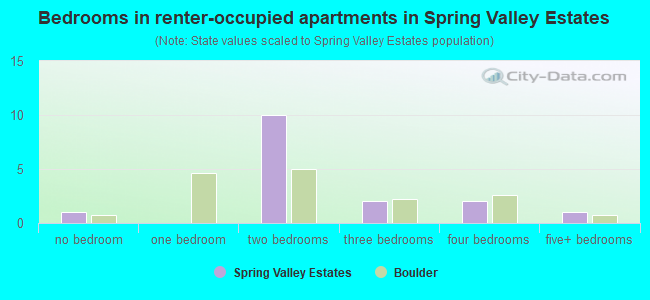
- Bedrooms in renter-occupied apartments in Spring Valley Estates
- 1no bedroom
- 01 bedroom
- 102 bedrooms
- 23 bedrooms
- 24 bedrooms
- 15+ bedrooms
Average number of cars or other vehicles available in houses/condos:
Average number of cars or other vehicles available in apartments:
| This neighborhood: | 0.6 |
| Boulder: | 1.8 |
Average number of cars or other vehicles available in apartments:
| Here: | 2.0 |
| city: | 1.6 |
Percentage of units with a mortgage:
| Spring Valley Estates: | 59.0% |
| Boulder: | 60.5% |
Housing prices:
- Average estimated value of detached houses in 2022 (66.4% of all units):
Spring Valley Estates: $1,489,004 Boulder: $1,567,950
- Average estimated value of townhouses or other attached units in 2022 (33.6% of all units):
This neighborhood: $1,470,339 city: $729,034
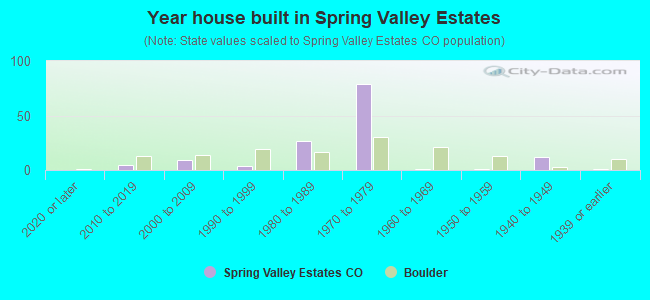
- Year house built in Spring Valley Estates
- 02020 or later
- 52010 to 2019
- 92000 to 2009
- 41990 to 1999
- 271980 to 1989
- 791970 to 1979
- 11960 to 1969
- 11950 to 1959
- 121940 to 1949
- 11939 or earlier
City-data.com crime index for city in 2020 (higher means more crime):
| City: | 275.1 |
| U.S. average: | 219.5 |
Travel time to work (commute)
![Travel time to work (commute)]()
- 1Less than 5 minutes
- 125 to 9 minutes
- 910 to 14 minutes
- 815 to 19 minutes
- 920 to 24 minutes
- 325 to 29 minutes
- 430 to 34 minutes
- 735 to 39 minutes
- 260 to 89 minutes
- 290 or more minutes

Means of transportation to work
![Means of transportation to work]()
- 38.6%37Drove a car alone
- 4.2%4Carpooled
- 2.1%2Bus
- 3.1%3Motorcycle
- 4.2%4Walked
- 9.4%9Other means
- 38.6%37Worked at home

Time leaving home to go to work
![Time leaving home to go to work]()
- 112:00 a.m. to 4:59 a.m.
- 25:00 a.m. to 5:29 a.m.
- 55:30 a.m. to 5:59 a.m.
- 36:00 a.m. to 6:29 a.m.
- 36:30 a.m. to 6:59 a.m.
- 57:00 a.m. to 7:29 a.m.
- 137:30 a.m. to 7:59 a.m.
- 88:00 a.m. to 8:29 a.m.
- 78:30 a.m. to 8:59 a.m.
- 139:00 a.m. to 9:59 a.m.
- 110:00 a.m. to 10:59 a.m.
- 811:00 a.m. to 11:59 a.m.
- 112:00 p.m. to 3:59 p.m.
- 104:00 p.m. to 11:59 p.m.

Occupations of males:
- Percentage of males in management occupations (except farmers):
Here: 35.8% city: 12.9%
- Percentage of males in business and financial operations occupations:
Here: 4.4% city: 7.6%
- Percentage of males in computer and mathematical occupations:
Here: 17.9% city: 10.0%
- Percentage of males in life, physical, and social science occupations:
Here: 1.9% city: 6.1%
- Percentage of males in education, training, and library occupations:
Here: 12.0% city: 8.1%
- Percentage of males in healthcare practitioners and technical occupations:
Here: 7.1% city: 1.9%
- Percentage of males in service occupations:
Here: 6.0% city: 14.4%
- Percentage of males in construction, extraction, and maintenance occupations:
Here: 3.3% city: 2.8%
- Percentage of males in production occupations:
Here: 9.2% city: 2.3%
Occupations of females:
- Percentage of females in management occupations (except farmers):
Here: 21.6% city: 8.8%
- Percentage of females in business and financial operations occupations:
Here: 13.3% city: 6.4%
- Percentage of females in computer and mathematical occupations:
Here: 3.0% city: 4.6%
- Percentage of females in legal occupations:
Here: 8.2% city: 1.4%
- Percentage of females in education, training, and library occupations:
Here: 11.9% city: 13.1%
- Percentage of females in arts, design, entertainment, sports, and media occupations:
Here: 2.1% city: 5.5%
- Percentage of females in healthcare practitioners and technical occupations:
Here: 12.3% city: 7.2%
- Percentage of females in service occupations:
Here: 6.9% city: 20.9%
- Percentage of females in sales and office occupations:
Here: 23.6% city: 19.4%
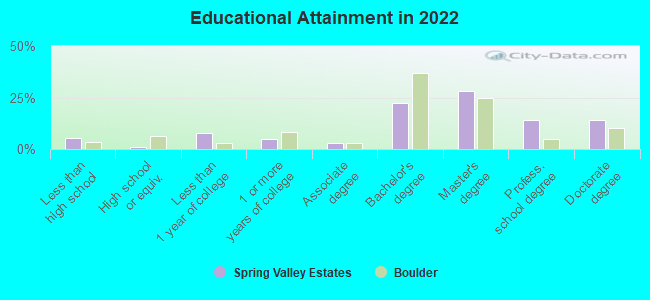
Education in this neighborhood (subdivision or community):
- Percentage of people 3 years and older in K-12 schools:
Spring Valley Estates: 12.8% Boulder: 8.8%
- Percentage of people 3 years and older in undergraduate colleges:
Spring Valley Estates: 2.4% Boulder: 28.2%
- Percentage of people 3 years and older in grad. or professional schools:
Spring Valley Estates: 6.0% Boulder: 6.1%
- Percentage of students K-12 enrolled in private schools:
Spring Valley Estates: 18.8% Boulder: 8.5%
Percentage of population below poverty level:
| Spring Valley Estates: | 5.2% |
| Boulder: | 24.1% |
Median year owner moved in (as recorded in 2022):
| Spring Valley Estates: | 2010 |
| Boulder: | 2012 |
Percentage of married-couple families with both working:
| Spring Valley Estates: | 73.0% |
| Boulder: | 76.2% |
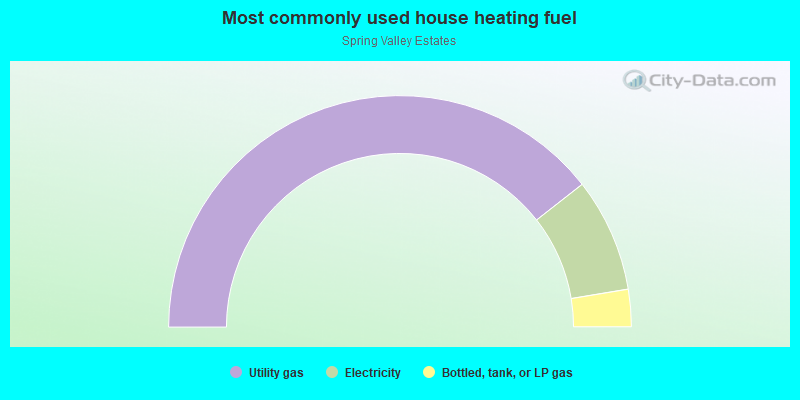
- 78.8%Utility gas
- 15.9%Electricity
- 5.2%Bottled, tank, or LP gas
Roads and streets:
Spring Valley Rd
Length: 0.48 miles
Directions: N-S, SE-NW
Address range: 3700 to 3899
Directions: N-S, SE-NW
Address range: 3700 to 3899
Linden Dr
Length: 0.25 miles
Directions: E-W, SE-NW
Address range: 1 to 591
Directions: E-W, SE-NW
Address range: 1 to 591
Cactus Ct
Length: 0.19 miles
Directions: E-W, N-S
Address range: 200 to 299
Directions: E-W, N-S
Address range: 200 to 299
Cholla Ct
Length: 0.17 miles
Directions: E-W, N-S, SE-NW, SW-NE
Address range: 3651 to 3689
Directions: E-W, N-S, SE-NW, SW-NE
Address range: 3651 to 3689
Linden Ave
Length: 0.11 miles
Direction: E-W
Address range: 1 to 199
Direction: E-W
Address range: 1 to 199
Wild Plum Ct
Length: 0.07 miles
Directions: N-S, SE-NW
Address range: 3720 to 3799
Directions: N-S, SE-NW
Address range: 3720 to 3799
Arrowleaf Ct
Length: 0.05 miles
Direction: N-S
Direction: N-S
Other features:
Crest of Foothills Rdg
Length: 0.47 miles
Directions: N-S, SE-NW
Directions: N-S, SE-NW