Suburban Acres neighborhood in Norfolk, Virginia (VA), 23505 detailed profile
Settings
X


Business Search - 14 Million verified businesses
Area: 0.492 square miles
Population: 3,972
Population density:
| Suburban Acres: | 8,069 people per square mile |
| Norfolk: | 4,337 people per square mile |

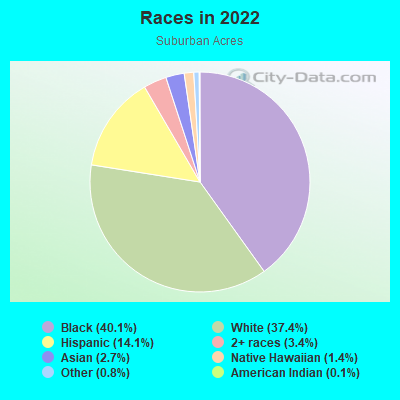
- 1,63040.1%Black
- 1,52137.4%White
- 57414.1%Hispanic or Latino
- 1373.4%Two or more races
- 1092.7%Asian
- 561.4%Native Hawaiian and Other
Pacific Islander - 340.8%Some other race
- 60.1%American Indian
Median household income in 2022:
| Suburban Acres: | $34,412 |
| Norfolk: | $61,090 |
Distribution of median household income
![Distribution of median household income]()
- 313Less than $10,000
- 448$10,000 to $19,999
- 244$20,000 to $29,999
- 273$30,000 to $39,999
- 213$40,000 to $49,999
- 108$50,000 to $59,999
- 133$60,000 to $74,999
- 96$75,000 to $99,999
- 83$100,000 to $124,999
- 45$125,000 to $149,999
- 37$150,000 to $199,999
- 112$200,000 or more

Distribution of owner-occupied house/condo value
![Distribution of owner-occupied house/condo value]()
- 63$50,000 to $99,999
- 40$100,000 to $149,999
- 88$150,000 to $199,999
- 111$200,000 to $249,999
- 193$250,000 to $299,999
- 48$300,000 to $399,999
- 8$400,000 to $499,999
- 36$500,000 to $749,999
- 9$1,000,000 or more

Distribution of rent paid by renters
![Distribution of rent paid by renters]()
- 39Less than $100
- 660$100 to $199
- 408$200 to $299
- 163$300 to $399
- 43$400 to $499
- 125$500 to $599
- 30$600 to $699
- 73$700 to $799
- 280$800 to $899
- 155$900 to $999
- 123$1,000 to $1,249
- 258$1,250 to $1,499
- 152$1,500 to $1,999
- 30$2,000 or more

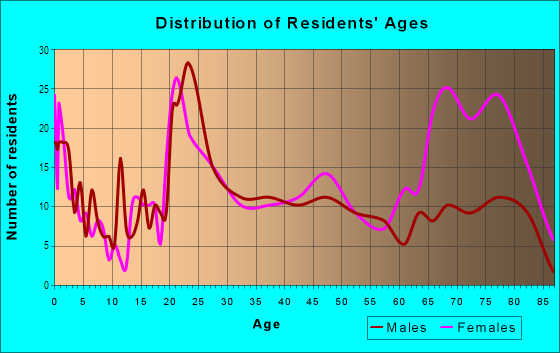
| Males: | 1,753 |
| Females: | 2,218 |
Males:
| This neighborhood: | 27.5 years |
| Whole city: | 31.3 years |
| This neighborhood: | 38.6 years |
| Whole city: | 34.4 years |
Average household size:
| Suburban Acres: | 2.7 people |
| Norfolk: | 2.3 people |
Percentage of family households:
| Suburban Acres: | 31.1% |
| Norfolk: | 41.3% |
| Here: | 18.8% |
| Norfolk: | 31.7% |
Percentage of married-couple families with children (among all households):
| Suburban Acres: | 10.3% |
| Norfolk: | 20.2% |
Percentage of single-mother households (among all households):
| Suburban Acres: | 33.5% |
| Norfolk: | 16.3% |
Percentage of never married males 15 years old and over:
Percentage of never married females 15 years old and over:
| Suburban Acres: | 17.8% |
| Norfolk: | 25.4% |
Percentage of never married females 15 years old and over:
| Suburban Acres: | 19.6% |
| city: | 20.5% |
Percentage of people that speak English not well or not at all:
| Suburban Acres: | 2.3% |
| Norfolk: | 1.4% |
Percentage of people born in this state:
Percentage of people born in another U.S. state:
Percentage of native residents but born outside the U.S.:
Percentage of foreign born residents:
| Here: | 43.4% |
| Norfolk: | 51.1% |
Percentage of people born in another U.S. state:
| Suburban Acres: | 43.5% |
| Norfolk: | 40.8% |
Percentage of native residents but born outside the U.S.:
| Here: | 1.8% |
| city: | 1.6% |
Percentage of foreign born residents:
| Here: | 11.4% |
| Norfolk: | 6.5% |
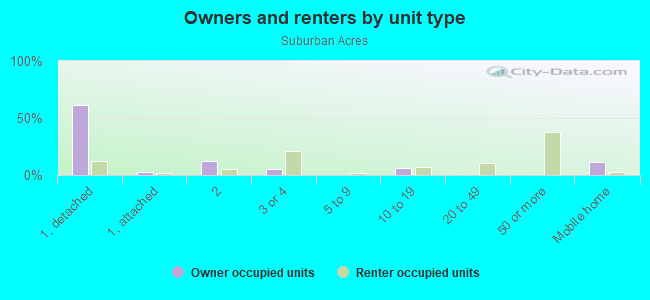
Owner-occupied
Renter-occupied

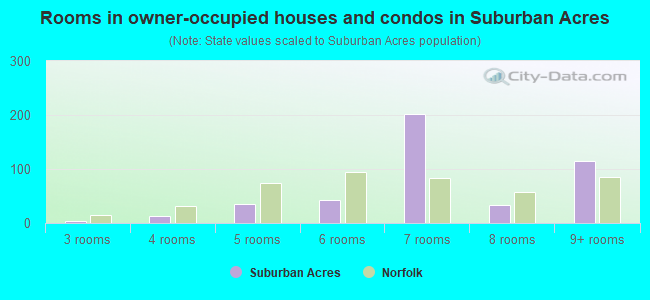
- Rooms in owner-occupied houses and condos in Suburban Acres
- 01 room
- 02 rooms
- 33 rooms
- 134 rooms
- 365 rooms
- 426 rooms
- 2017 rooms
- 338 rooms
- 1149+ rooms
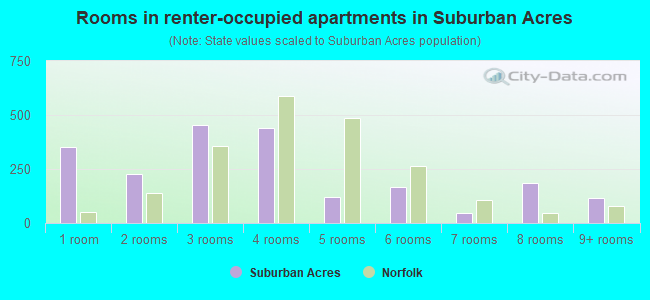
- Rooms in renter-occupied apartments in Suburban Acres
- 3531 room
- 2292 rooms
- 4553 rooms
- 4414 rooms
- 1225 rooms
- 1666 rooms
- 457 rooms
- 1878 rooms
- 1179+ rooms
Owner-occupied
Renter-occupied
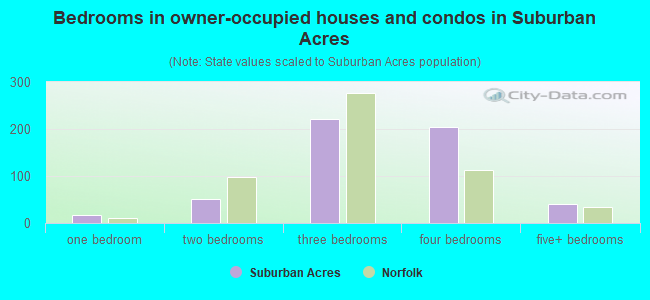
- Bedrooms in owner-occupied houses and condos in Suburban Acres
- 0no bedroom
- 161 bedroom
- 512 bedrooms
- 2223 bedrooms
- 2054 bedrooms
- 405+ bedrooms
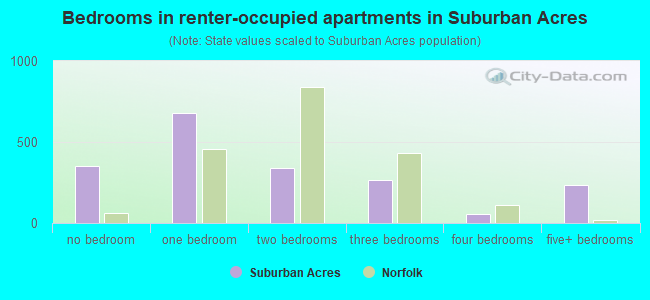
- Bedrooms in renter-occupied apartments in Suburban Acres
- 353no bedroom
- 6761 bedroom
- 3372 bedrooms
- 2673 bedrooms
- 554 bedrooms
- 2355+ bedrooms
Average number of cars or other vehicles available in houses/condos:
Average number of cars or other vehicles available in apartments:
| This neighborhood: | 2.6 |
| Norfolk: | 2.0 |
Average number of cars or other vehicles available in apartments:
| Here: | 0.9 |
| city: | 1.3 |
Percentage of units with a mortgage:
| Suburban Acres: | 77.4% |
| Norfolk: | 70.0% |
Average estimated value of detached houses in 2022 (24.9% of all units):
| Suburban Acres: | $252,251 |
| Norfolk: | $337,508 |
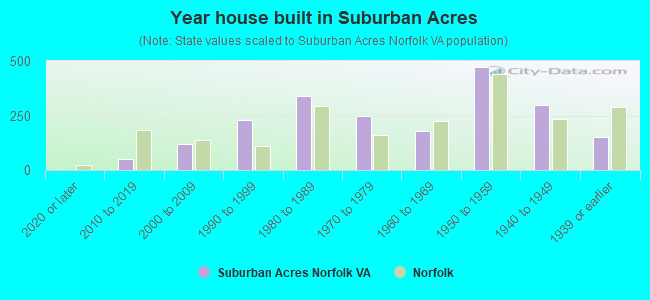
- Year house built in Suburban Acres
- 02020 or later
- 502010 to 2019
- 1202000 to 2009
- 2311990 to 1999
- 3401980 to 1989
- 2461970 to 1979
- 1801960 to 1969
- 4721950 to 1959
- 2991940 to 1949
- 1531939 or earlier
City-data.com crime index for city in 2020 (higher means more crime):
| City: | 327.9 |
| U.S. average: | 219.5 |
Travel time to work (commute)
![Travel time to work (commute)]()
- 169Less than 5 minutes
- 1105 to 9 minutes
- 26110 to 14 minutes
- 30915 to 19 minutes
- 35520 to 24 minutes
- 11225 to 29 minutes
- 25730 to 34 minutes
- 11035 to 39 minutes
- 640 to 44 minutes
- 1245 to 59 minutes
- 1860 to 89 minutes
- 3790 or more minutes

Means of transportation to work
![Means of transportation to work]()
- 79.6%1,226Drove a car alone
- 9.8%151Carpooled
- 2.6%40Bus
- 0.5%7Motorcycle
- 0.3%4Bicycle
- 6.9%106Walked
- 3.3%51Other means
- 2.6%40Worked at home

Time leaving home to go to work
![Time leaving home to go to work]()
- 7912:00 a.m. to 4:59 a.m.
- 805:00 a.m. to 5:29 a.m.
- 1385:30 a.m. to 5:59 a.m.
- 936:00 a.m. to 6:29 a.m.
- 1506:30 a.m. to 6:59 a.m.
- 897:00 a.m. to 7:29 a.m.
- 2057:30 a.m. to 7:59 a.m.
- 2148:00 a.m. to 8:29 a.m.
- 1778:30 a.m. to 8:59 a.m.
- 1979:00 a.m. to 9:59 a.m.
- 3510:00 a.m. to 10:59 a.m.
- 13512:00 p.m. to 3:59 p.m.
- 1444:00 p.m. to 11:59 p.m.

Occupations of males:
- Percentage of males in management occupations (except farmers):
Here: 2.6% city: 8.2%
- Percentage of males in business and financial operations occupations:
Here: 4.3% city: 4.4%
- Percentage of males in computer and mathematical occupations:
Here: 11.4% city: 4.2%
- Percentage of males in architecture and engineering occupations:
Here: 6.5% city: 3.7%
- Percentage of males in life, physical, and social science occupations:
Here: 3.0% city: 1.2%
- Percentage of males in legal occupations:
Here: 1.8% city: 1.0%
- Percentage of males in education, training, and library occupations:
Here: 3.1% city: 3.9%
- Percentage of males in arts, design, entertainment, sports, and media occupations:
Here: 5.3% city: 2.2%
- Percentage of males in service occupations:
Here: 14.2% city: 16.9%
- Percentage of males in sales and office occupations:
Here: 19.6% city: 15.6%
- Percentage of males in construction, extraction, and maintenance occupations:
Here: 4.9% city: 9.8%
- Percentage of males in production occupations:
Here: 22.0% city: 6.5%
Occupations of females:
- Percentage of females in management occupations (except farmers):
Here: 5.5% city: 7.7%
- Percentage of females in business and financial operations occupations:
Here: 1.4% city: 5.2%
- Percentage of females in life, physical, and social science occupations:
Here: 1.9% city: 0.9%
- Percentage of females in community and social services occupations:
Here: 8.8% city: 3.1%
- Percentage of females in education, training, and library occupations:
Here: 9.4% city: 9.1%
- Percentage of females in arts, design, entertainment, sports, and media occupations:
Here: 2.5% city: 1.3%
- Percentage of females in healthcare practitioners and technical occupations:
Here: 4.0% city: 9.6%
- Percentage of females in service occupations:
Here: 25.0% city: 22.3%
- Percentage of females in sales and office occupations:
Here: 42.7% city: 28.7%
- Percentage of females in production occupations:
Here: 1.6% city: 2.7%
- Percentage of females in transportation occupations:
Here: 3.3% city: 1.6%
Percentage of people 16-64 in Armed Forces:
| Suburban Acres: | 6.9% |
| Norfolk: | 15.8% |
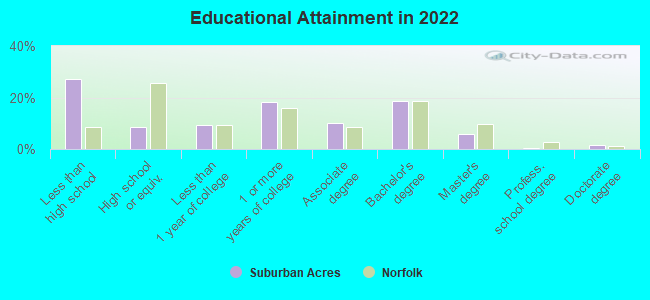
Education in this neighborhood (subdivision or community):
- Percentage of people 3 years and older in K-12 schools:
Suburban Acres: 22.6% Norfolk: 14.3%
- Percentage of people 3 years and older in undergraduate colleges:
Suburban Acres: 7.5% Norfolk: 8.0%
- Percentage of people 3 years and older in grad. or professional schools:
Suburban Acres: 6.3% Norfolk: 2.1%
- Percentage of students K-12 enrolled in private schools:
Suburban Acres: 8.8% Norfolk: 16.2%
Percentage of population below poverty level:
| Suburban Acres: | 23.3% |
| Norfolk: | 17.7% |
Median year owner moved in (as recorded in 2022):
Median year renter moved in (as recorded in 2022):
| Suburban Acres: | 2001 |
| Norfolk: | 2013 |
Median year renter moved in (as recorded in 2022):
| Suburban Acres: | 2018 |
| Norfolk: | 2020 |
Percentage of married-couple families with both working:
| Suburban Acres: | 83.7% |
| Norfolk: | 65.5% |
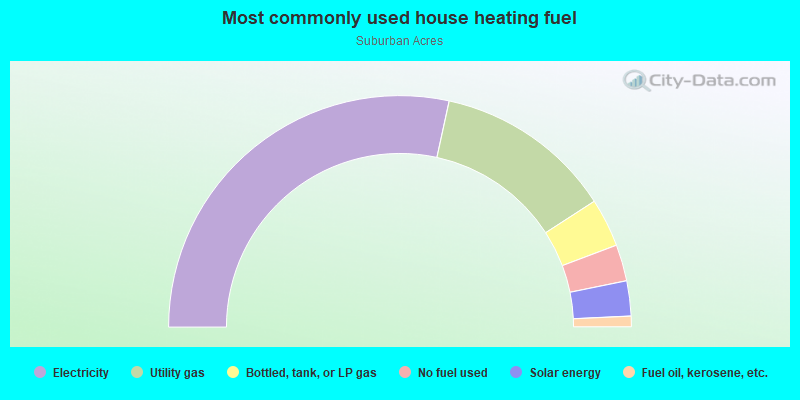
- 56.9%Electricity
- 24.9%Utility gas
- 6.8%Bottled, tank, or LP gas
- 5.1%No fuel used
- 4.9%Solar energy
- 1.5%Fuel oil, kerosene, etc.
Roads and streets:
Thole St
Length: 0.98 miles
Direction: E-W
Address range: 200 to 599
Direction: E-W
Address range: 200 to 599
Suburban Pkwy
Length: 0.94 miles
Directions: E-W, N-S, SE-NW
Address range: 134 to 599
Directions: E-W, N-S, SE-NW
Address range: 134 to 599
Kirby Cres
Length: 0.80 miles
Directions: E-W, N-S, SE-NW, SW-NE
Address range: 7000 to 7343
Directions: E-W, N-S, SE-NW, SW-NE
Address range: 7000 to 7343
Virginian Dr
Length: 0.56 miles
Directions: E-W, N-S, SE-NW
Address range: 200 to 7543
Directions: E-W, N-S, SE-NW
Address range: 200 to 7543
Yorktown Dr
Length: 0.54 miles
Directions: E-W, N-S, SE-NW, SW-NE
Address range: 7300 to 7599
Directions: E-W, N-S, SE-NW, SW-NE
Address range: 7300 to 7599
Parkdale Dr
Length: 0.46 miles
Directions: E-W, N-S, SE-NW, SW-NE
Address range: 7300 to 7419
Directions: E-W, N-S, SE-NW, SW-NE
Address range: 7300 to 7419
Suburban Arch
Length: 0.44 miles
Directions: E-W, N-S, SE-NW, SW-NE
Address range: 7000 to 7099
Directions: E-W, N-S, SE-NW, SW-NE
Address range: 7000 to 7099
Galveston Blvd
Length: 0.43 miles
Directions: N-S, SW-NE
Address range: 7100 to 7499
Directions: N-S, SW-NE
Address range: 7100 to 7499
Granby Park
Length: 0.37 miles
Directions: E-W, SE-NW
Address range: 101 to 299
Directions: E-W, SE-NW
Address range: 101 to 299
Carl St
Length: 0.35 miles
Directions: E-W, SW-NE
Address range: 400 to 599
Directions: E-W, SW-NE
Address range: 400 to 599
Glen Echo Dr
Length: 0.30 miles
Directions: E-W, N-S, SE-NW, SW-NE
Address range: 200 to 299
Directions: E-W, N-S, SE-NW, SW-NE
Address range: 200 to 299
Midfield St
Length: 0.30 miles
Directions: N-S, SW-NE
Address range: 7122 to 7399
Directions: N-S, SW-NE
Address range: 7122 to 7399
W Kenmore Dr
Length: 0.28 miles
Directions: E-W, N-S, SE-NW, SW-NE
Address range: 7300 to 7499
Directions: E-W, N-S, SE-NW, SW-NE
Address range: 7300 to 7499
E Kenmore Dr
Length: 0.27 miles
Directions: E-W, SW-NE
Address range: 7300 to 7499
Directions: E-W, SW-NE
Address range: 7300 to 7499
Brickby Rd
Length: 0.24 miles
Direction: SE-NW
Address range: 400 to 499
Direction: SE-NW
Address range: 400 to 499
Forsythe St
Length: 0.18 miles
Direction: E-W
Address range: 200 to 254
Direction: E-W
Address range: 200 to 254
Woodfin Ave
Length: 0.16 miles
Directions: E-W, N-S, SE-NW, SW-NE
Address range: 7300 to 7399
Directions: E-W, N-S, SE-NW, SW-NE
Address range: 7300 to 7399
Gunn Ct
Length: 0.13 miles
Directions: E-W, N-S, SE-NW
Address range: 300 to 7098
Directions: E-W, N-S, SE-NW
Address range: 300 to 7098
Fife Ln
Length: 0.11 miles
Directions: E-W, N-S, SE-NW, SW-NE
Address range: 200 to 7299
Directions: E-W, N-S, SE-NW, SW-NE
Address range: 200 to 7299
Caton St
Length: 0.09 miles
Direction: E-W
Address range: 300 to 399
Direction: E-W
Address range: 300 to 399
Louisiana Dr
Length: 0.09 miles
Directions: E-W, SW-NE
Address range: 160 to 199
Directions: E-W, SW-NE
Address range: 160 to 199
Norva Park
Length: 0.07 miles
Directions: E-W, N-S, SE-NW, SW-NE
Directions: E-W, N-S, SE-NW, SW-NE
Sue Ln
Length: 0.06 miles
Directions: E-W, N-S, SE-NW
Address range: 245 to 252
Directions: E-W, N-S, SE-NW
Address range: 245 to 252
Fife St
Length: 0.03 miles
Direction: SW-NE
Address range: 200 to 299
Direction: SW-NE
Address range: 200 to 299
Other features:
Branch Wayne Crk
Length: 0.70 miles
Directions: N-S, SE-NW, SW-NE
Directions: N-S, SE-NW, SW-NE