Tempe Royal Estates neighborhood in Tempe, Arizona (AZ), 85283 detailed profile
Settings
X

Business Search - 14 Million verified businesses
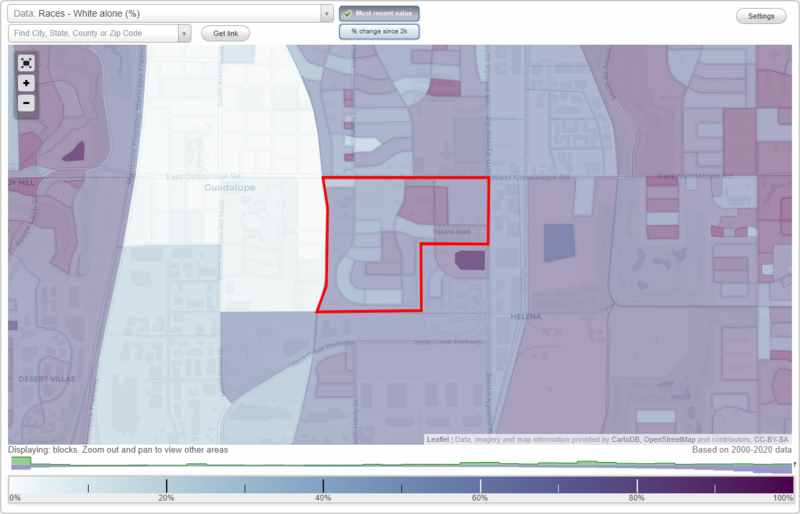
Area: 0.238 square miles
Population: 1,468
Population density:
| Tempe Royal Estates: | 6,168 people per square mile |
| Tempe: | 4,641 people per square mile |

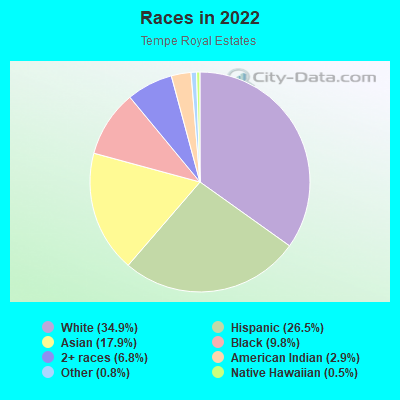
- 51134.9%White
- 38826.5%Hispanic or Latino
- 26317.9%Asian
- 1439.8%Black
- 996.8%Two or more races
- 422.9%American Indian
- 120.8%Some other race
- 80.5%Native Hawaiian and Other
Pacific Islander
Median household income in 2022:
| Tempe Royal Estates: | $70,768 |
| Tempe: | $76,007 |
Distribution of median household income
![Distribution of median household income]()
- 22Less than $10,000
- 21$10,000 to $19,999
- 43$20,000 to $29,999
- 44$30,000 to $39,999
- 35$40,000 to $49,999
- 39$50,000 to $59,999
- 200$60,000 to $74,999
- 83$75,000 to $99,999
- 61$100,000 to $124,999
- 65$125,000 to $149,999
- 46$150,000 to $199,999
- 19$200,000 or more

Distribution of owner-occupied house/condo value
![Distribution of owner-occupied house/condo value]()
- 1Less than $50,000
- 25$50,000 to $99,999
- 23$100,000 to $149,999
- 16$150,000 to $199,999
- 10$200,000 to $249,999
- 49$250,000 to $299,999
- 43$300,000 to $399,999
- 33$400,000 to $499,999
- 8$500,000 to $749,999

Distribution of rent paid by renters
![Distribution of rent paid by renters]()
- 2$300 to $399
- 8$500 to $599
- 20$600 to $699
- 46$700 to $799
- 11$800 to $899
- 24$900 to $999
- 137$1,000 to $1,249
- 208$1,250 to $1,499
- 144$1,500 to $1,999
- 19$2,000 or more

Median rent in 2022:
| Tempe Royal Estates: | $1,365 |
| Tempe: | $1,566 |
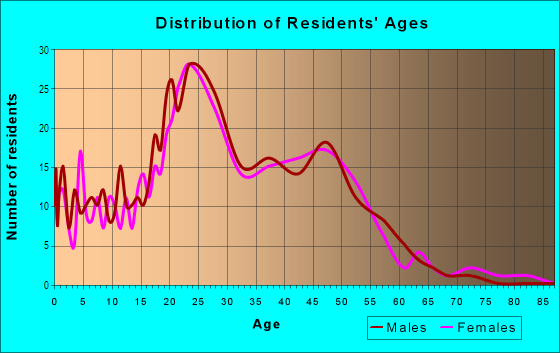
| Males: | 763 |
| Females: | 705 |
Males:
| This neighborhood: | 37.1 years |
| Whole city: | 28.9 years |
| This neighborhood: | 35.9 years |
| Whole city: | 30.5 years |
Average household size:
| Tempe Royal Estates: | 2.4 people |
| Tempe: | 2.3 people |
Percentage of family households:
| Tempe Royal Estates: | 53.9% |
| Tempe: | 36.3% |
| Here: | 40.1% |
| Tempe: | 32.6% |
Percentage of married-couple families with children (among all households):
| Tempe Royal Estates: | 27.2% |
| Tempe: | 26.9% |
Percentage of single-mother households (among all households):
| Tempe Royal Estates: | 7.1% |
| Tempe: | 8.3% |
Percentage of never married males 15 years old and over:
Percentage of never married females 15 years old and over:
| Tempe Royal Estates: | 24.0% |
| Tempe: | 32.9% |
Percentage of never married females 15 years old and over:
| Tempe Royal Estates: | 14.1% |
| city: | 21.7% |
Percentage of people that speak English not well or not at all:
| Tempe Royal Estates: | 5.0% |
| Tempe: | 2.0% |
Percentage of people born in this state:
Percentage of people born in another U.S. state:
Percentage of native residents but born outside the U.S.:
Percentage of foreign born residents:
| Here: | 38.2% |
| Tempe: | 39.3% |
Percentage of people born in another U.S. state:
| Tempe Royal Estates: | 43.7% |
| Tempe: | 46.0% |
Percentage of native residents but born outside the U.S.:
| Here: | 2.3% |
| city: | 1.8% |
Percentage of foreign born residents:
| Here: | 15.9% |
| Tempe: | 12.9% |
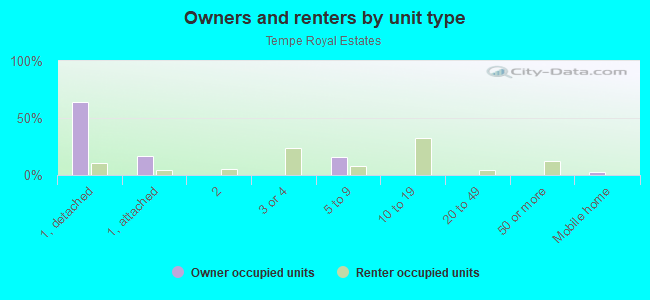
Owner-occupied
Renter-occupied

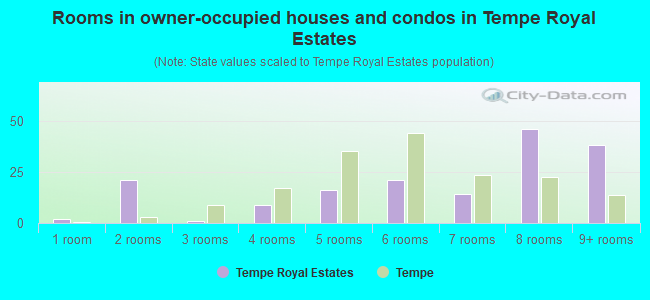
- Rooms in owner-occupied houses and condos in Tempe Royal Estates
- 21 room
- 212 rooms
- 13 rooms
- 94 rooms
- 165 rooms
- 216 rooms
- 147 rooms
- 468 rooms
- 389+ rooms
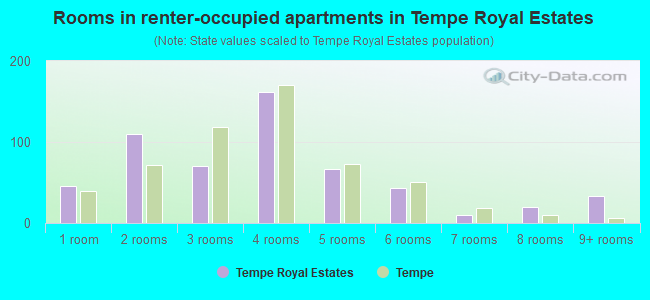
- Rooms in renter-occupied apartments in Tempe Royal Estates
- 461 room
- 1102 rooms
- 703 rooms
- 1624 rooms
- 675 rooms
- 436 rooms
- 107 rooms
- 208 rooms
- 339+ rooms
Owner-occupied
Renter-occupied
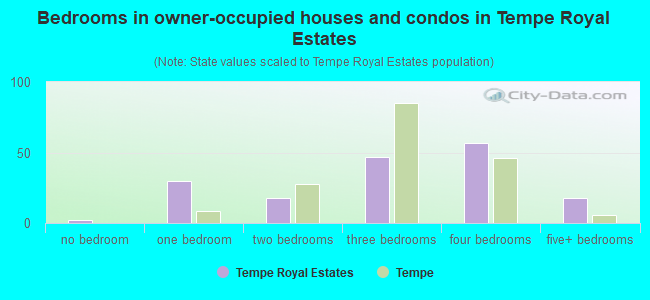
- Bedrooms in owner-occupied houses and condos in Tempe Royal Estates
- 2no bedroom
- 301 bedroom
- 182 bedrooms
- 473 bedrooms
- 574 bedrooms
- 185+ bedrooms
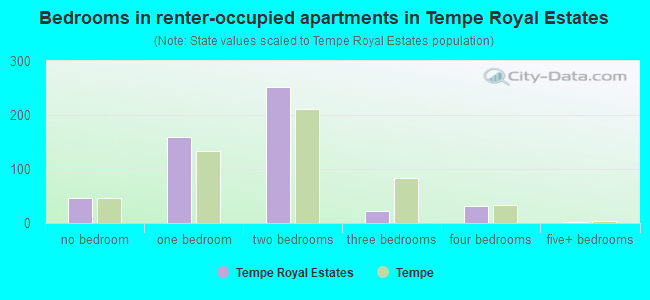
- Bedrooms in renter-occupied apartments in Tempe Royal Estates
- 46no bedroom
- 1591 bedroom
- 2512 bedrooms
- 223 bedrooms
- 324 bedrooms
- 25+ bedrooms
Average number of cars or other vehicles available in houses/condos:
Average number of cars or other vehicles available in apartments:
| This neighborhood: | 2.0 |
| Tempe: | 2.0 |
Average number of cars or other vehicles available in apartments:
| Here: | 1.4 |
| city: | 1.6 |
Percentage of units with a mortgage:
| Tempe Royal Estates: | 47.6% |
| Tempe: | 69.2% |
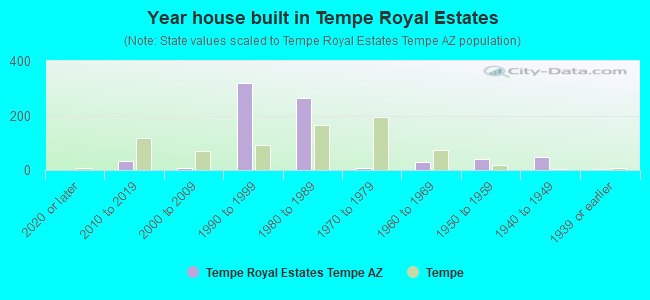
- Year house built in Tempe Royal Estates
- 02020 or later
- 322010 to 2019
- 82000 to 2009
- 3201990 to 1999
- 2651980 to 1989
- 81970 to 1979
- 301960 to 1969
- 411950 to 1959
- 461940 to 1949
- 21939 or earlier
City-data.com crime index for city in 2020 (higher means more crime):
| City: | 347.1 |
| U.S. average: | 219.5 |
Travel time to work (commute)
![Travel time to work (commute)]()
- 64Less than 5 minutes
- 965 to 9 minutes
- 16610 to 14 minutes
- 18515 to 19 minutes
- 21720 to 24 minutes
- 12325 to 29 minutes
- 14230 to 34 minutes
- 4035 to 39 minutes
- 740 to 44 minutes
- 4945 to 59 minutes
- 3560 to 89 minutes
- 790 or more minutes

Means of transportation to work
![Means of transportation to work]()
- 86.4%702Drove a car alone
- 1.1%9Carpooled
- 0.6%5Bus
- 1.2%10Light rail, streetcar or trolley
- 0.4%3Taxi
- 2.5%20Motorcycle
- 1.6%13Bicycle
- 0.7%6Walked
- 3.1%25Other means
- 3.1%25Worked at home

Time leaving home to go to work
![Time leaving home to go to work]()
- 8112:00 a.m. to 4:59 a.m.
- 285:00 a.m. to 5:29 a.m.
- 725:30 a.m. to 5:59 a.m.
- 786:00 a.m. to 6:29 a.m.
- 916:30 a.m. to 6:59 a.m.
- 1507:00 a.m. to 7:29 a.m.
- 1247:30 a.m. to 7:59 a.m.
- 1398:00 a.m. to 8:29 a.m.
- 498:30 a.m. to 8:59 a.m.
- 629:00 a.m. to 9:59 a.m.
- 1510:00 a.m. to 10:59 a.m.
- 3611:00 a.m. to 11:59 a.m.
- 10212:00 p.m. to 3:59 p.m.
- 1084:00 p.m. to 11:59 p.m.

Occupations of males:
- Percentage of males in management occupations (except farmers):
Here: 11.1% city: 10.2%
- Percentage of males in business and financial operations occupations:
Here: 5.0% city: 6.5%
- Percentage of males in computer and mathematical occupations:
Here: 16.1% city: 8.4%
- Percentage of males in architecture and engineering occupations:
Here: 9.1% city: 5.0%
- Percentage of males in education, training, and library occupations:
Here: 1.9% city: 6.1%
- Percentage of males in arts, design, entertainment, sports, and media occupations:
Here: 7.2% city: 2.8%
- Percentage of males in service occupations:
Here: 14.9% city: 14.4%
- Percentage of males in sales and office occupations:
Here: 15.8% city: 19.0%
- Percentage of males in construction, extraction, and maintenance occupations:
Here: 6.3% city: 5.1%
- Percentage of males in production occupations:
Here: 4.4% city: 4.4%
- Percentage of males in transportation occupations:
Here: 2.8% city: 3.9%
- Percentage of males in material moving occupations:
Here: 3.5% city: 3.5%
Occupations of females:
- Percentage of females in business and financial operations occupations:
Here: 18.9% city: 9.3%
- Percentage of females in computer and mathematical occupations:
Here: 3.4% city: 3.3%
- Percentage of females in community and social services occupations:
Here: 3.5% city: 3.4%
- Percentage of females in legal occupations:
Here: 2.9% city: 1.4%
- Percentage of females in education, training, and library occupations:
Here: 3.0% city: 12.0%
- Percentage of females in arts, design, entertainment, sports, and media occupations:
Here: 5.5% city: 3.1%
- Percentage of females in healthcare practitioners and technical occupations:
Here: 9.3% city: 7.4%
- Percentage of females in service occupations:
Here: 18.0% city: 18.9%
- Percentage of females in sales and office occupations:
Here: 34.3% city: 26.9%
- Percentage of females in production occupations:
Here: 4.1% city: 1.5%
- Percentage of females in material moving occupations:
Here: 6.3% city: 1.4%
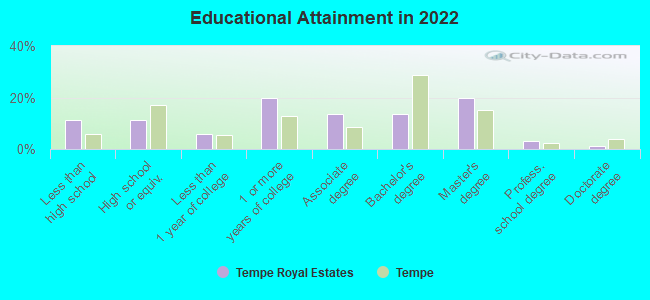
Education in this neighborhood (subdivision or community):
- Percentage of people 3 years and older in K-12 schools:
Tempe Royal Estates: 20.3% Tempe: 12.5%
- Percentage of people 3 years and older in undergraduate colleges:
Tempe Royal Estates: 15.0% Tempe: 15.4%
- Percentage of people 3 years and older in grad. or professional schools:
Tempe Royal Estates: 2.0% Tempe: 6.3%
- Percentage of students K-12 enrolled in private schools:
Tempe Royal Estates: 8.7% Tempe: 9.2%
Percentage of population below poverty level:
| Tempe Royal Estates: | 10.3% |
| Tempe: | 15.0% |
Median year owner moved in (as recorded in 2022):
Median year renter moved in (as recorded in 2022):
| Tempe Royal Estates: | 2002 |
| Tempe: | 2013 |
Median year renter moved in (as recorded in 2022):
| Tempe Royal Estates: | 2016 |
| Tempe: | 2022 |
Percentage of married-couple families with both working:
| Tempe Royal Estates: | 39.4% |
| Tempe: | 77.6% |
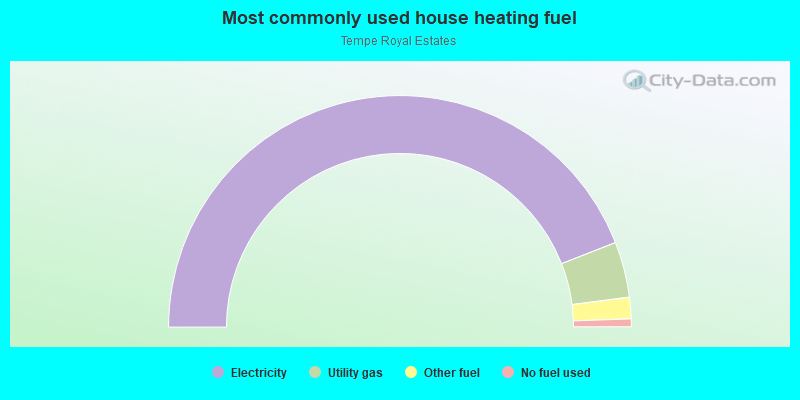
- 88.2%Electricity
- 7.8%Utility gas
- 3.0%Other fuel
- 1.1%No fuel used
Roads and streets:
McKemy St
Length: 0.49 miles
Directions: E-W, N-S, SE-NW, SW-NE
Address range: 6422 to 6899
Directions: E-W, N-S, SE-NW, SW-NE
Address range: 6422 to 6899
Hardy Dr (S Hardy Dr)
Length: 0.45 miles
Directions: N-S, SE-NW, SW-NE
Address range: 6400 to 6829
Directions: N-S, SE-NW, SW-NE
Address range: 6400 to 6829
W Vaughn St
Length: 0.44 miles
Directions: E-W, N-S, SE-NW
Directions: E-W, N-S, SE-NW
W Strahan Dr
Length: 0.44 miles
Direction: E-W
Address range: 600 to 1099
Direction: E-W
Address range: 600 to 1099
W Paseo Way
Length: 0.33 miles
Directions: E-W, SE-NW
Address range: 600 to 1099
Directions: E-W, SE-NW
Address range: 600 to 1099
W Diamond Dr
Length: 0.32 miles
Directions: E-W, SE-NW, SW-NE
Address range: 724 to 999
Directions: E-W, SE-NW, SW-NE
Address range: 724 to 999
W Lodge Dr
Length: 0.30 miles
Directions: E-W, SE-NW
Address range: 812 to 1099
Directions: E-W, SE-NW
Address range: 812 to 1099
Mitchell Dr
Length: 0.26 miles
Directions: N-S, SW-NE
Address range: 6602 to 6899
Directions: N-S, SW-NE
Address range: 6602 to 6899
S Roosevelt St
Length: 0.23 miles
Directions: E-W, N-S
Address range: 6442 to 6703
Directions: E-W, N-S
Address range: 6442 to 6703
W Bell de Mar Dr
Length: 0.22 miles
Directions: E-W, SE-NW
Address range: 380 to 999
Directions: E-W, SE-NW
Address range: 380 to 999
W Vaugh St
Length: 0.19 miles
Direction: E-W
Address range: 300 to 1099
Direction: E-W
Address range: 300 to 1099
W Redfield Rd
Length: 0.16 miles
Direction: E-W
Address range: 801 to 999
Direction: E-W
Address range: 801 to 999
S Carney Ave
Length: 0.16 miles
Directions: E-W, N-S, SE-NW
Address range: 6700 to 6899
Directions: E-W, N-S, SE-NW
Address range: 6700 to 6899
S Marilyn Ann Dr
Length: 0.16 miles
Directions: N-S, SE-NW
Address range: 6500 to 6699
Directions: N-S, SE-NW
Address range: 6500 to 6699
W Woodman Dr
Length: 0.15 miles
Direction: E-W
Address range: 600 to 1099
Direction: E-W
Address range: 600 to 1099
Wilson St
Length: 0.14 miles
Directions: N-S, SE-NW
Address range: 6401 to 6599
Directions: N-S, SE-NW
Address range: 6401 to 6599
W Carmen St
Length: 0.13 miles
Directions: E-W, SE-NW
Address range: 900 to 999
Directions: E-W, SE-NW
Address range: 900 to 999
S Towers St
Length: 0.10 miles
Directions: N-S, SE-NW
Address range: 6700 to 6839
Directions: N-S, SE-NW
Address range: 6700 to 6839
S Farmer Ave
Length: 0.08 miles
Direction: N-S
Address range: 6500 to 6599
Direction: N-S
Address range: 6500 to 6599
Vaugh St
Length: 0.03 miles
Direction: SW-NE
Direction: SW-NE