Top of the Hill (Top-of-the-hill) neighborhood in Daly City, California (CA), 94014 detailed profile
Settings
X

Business Search - 14 Million verified businesses
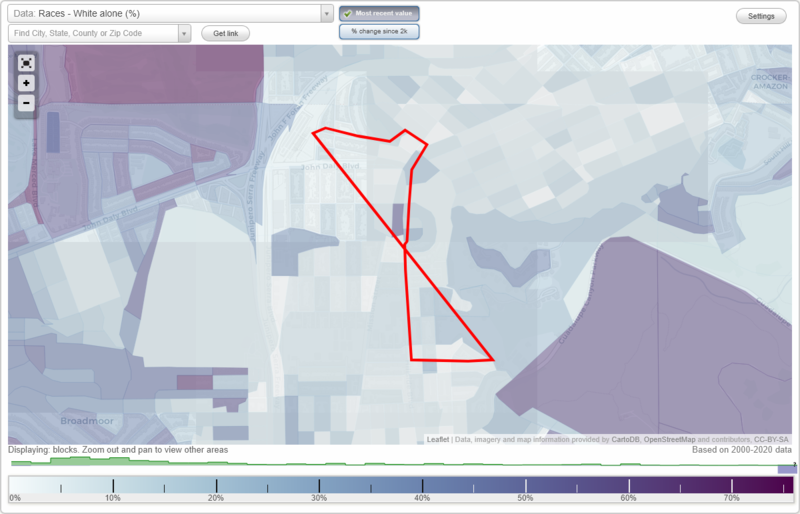
Area: 0.131 square miles
Population: 2,076
Population density:
| Top of the Hill (Top-of-the-hill): | 15,792 people per square mile |
| Daly City: | 13,224 people per square mile |

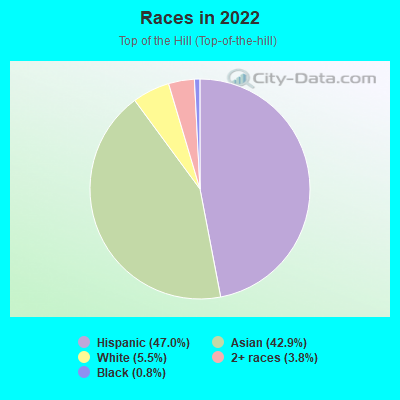
- 98047.0%Hispanic or Latino
- 89542.9%Asian
- 1145.5%White
- 793.8%Two or more races
- 170.8%Black
Median household income in 2022:
| Top of the Hill (Top-of-the-hill): | $108,914 |
| Daly City: | $109,227 |
Distribution of median household income
![Distribution of median household income]()
- 11Less than $10,000
- 19$10,000 to $19,999
- 23$20,000 to $29,999
- 53$30,000 to $39,999
- 46$40,000 to $49,999
- 68$50,000 to $59,999
- 54$60,000 to $74,999
- 57$75,000 to $99,999
- 124$100,000 to $124,999
- 64$125,000 to $149,999
- 85$150,000 to $199,999
- 109$200,000 or more

Distribution of owner-occupied house/condo value
![Distribution of owner-occupied house/condo value]()
- 15Less than $50,000
- 47$500,000 to $749,999
- 43$750,000 to $999,999
- 124$1,000,000 or more

Distribution of rent paid by renters
![Distribution of rent paid by renters]()
- 8$100 to $199
- 11$600 to $699
- 6$700 to $799
- 30$800 to $899
- 69$1,000 to $1,249
- 22$1,250 to $1,499
- 105$1,500 to $1,999
- 295$2,000 or more

Median rent in 2022:
| Top of the Hill (Top-of-the-hill): | $2,114 |
| Daly City: | $2,001 |
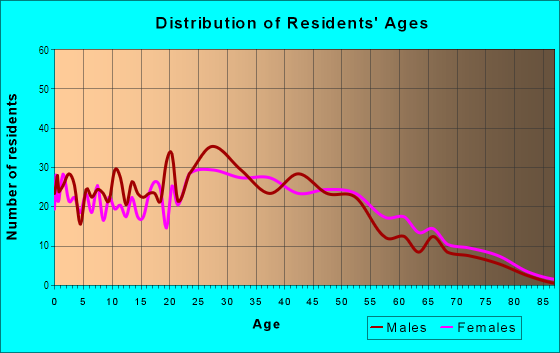
| Males: | 1,131 |
| Females: | 945 |
Males:
| This neighborhood: | 32.0 years |
| Whole city: | 40.9 years |
| This neighborhood: | 43.5 years |
| Whole city: | 44.8 years |
Average household size:
| Top of the Hill (Top-of-the-hill): | 3.1 people |
| Daly City: | 3.1 people |
Percentage of family households:
| Top of the Hill (Top-of-the-hill): | 50.8% |
| Daly City: | 40.3% |
| Here: | 52.5% |
| Daly City: | 50.3% |
Percentage of married-couple families with children (among all households):
| Top of the Hill (Top-of-the-hill): | 24.1% |
| Daly City: | 23.9% |
Percentage of single-mother households (among all households):
| Top of the Hill (Top-of-the-hill): | 11.7% |
| Daly City: | 5.7% |
Percentage of never married males 15 years old and over:
Percentage of never married females 15 years old and over:
| Top of the Hill (Top-of-the-hill): | 30.1% |
| Daly City: | 22.6% |
Percentage of never married females 15 years old and over:
| Top of the Hill (Top-of-the-hill): | 15.4% |
| city: | 17.9% |
Percentage of people that speak English not well or not at all:
| Top of the Hill (Top-of-the-hill): | 11.2% |
| Daly City: | 11.2% |
Percentage of people born in this state:
Percentage of people born in another U.S. state:
Percentage of native residents but born outside the U.S.:
Percentage of foreign born residents:
| Here: | 42.6% |
| Daly City: | 41.1% |
Percentage of people born in another U.S. state:
| Top of the Hill (Top-of-the-hill): | 2.8% |
| Daly City: | 5.1% |
Percentage of native residents but born outside the U.S.:
| Here: | 0.9% |
| city: | 1.8% |
Percentage of foreign born residents:
| Here: | 53.6% |
| Daly City: | 52.0% |
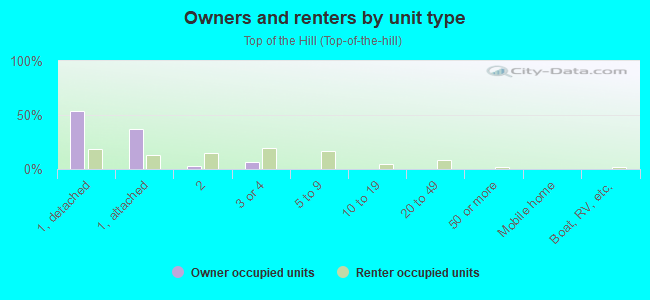
Owner-occupied
Renter-occupied

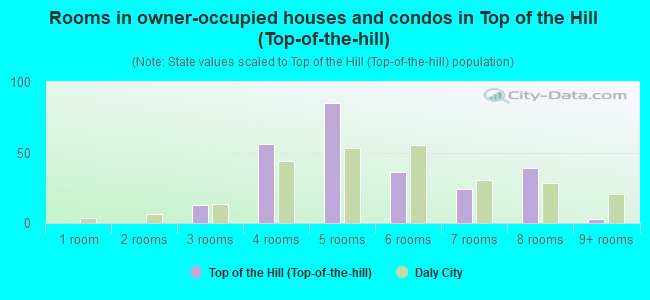
- Rooms in owner-occupied houses and condos in Top of the Hill <
> - 01 room
- 02 rooms
- 133 rooms
- 564 rooms
- 855 rooms
- 366 rooms
- 247 rooms
- 398 rooms
- 39+ rooms
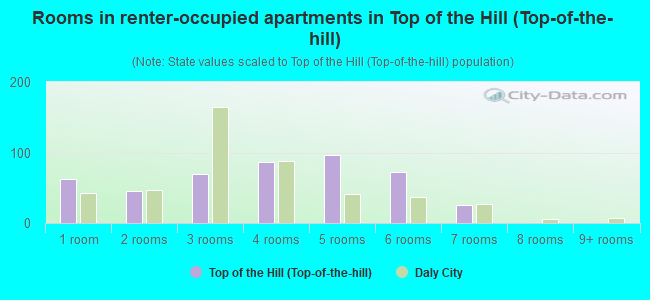
- Rooms in renter-occupied apartments in Top of the Hill <
> - 631 room
- 462 rooms
- 693 rooms
- 864 rooms
- 975 rooms
- 736 rooms
- 267 rooms
- 08 rooms
- 09+ rooms
Owner-occupied
Renter-occupied
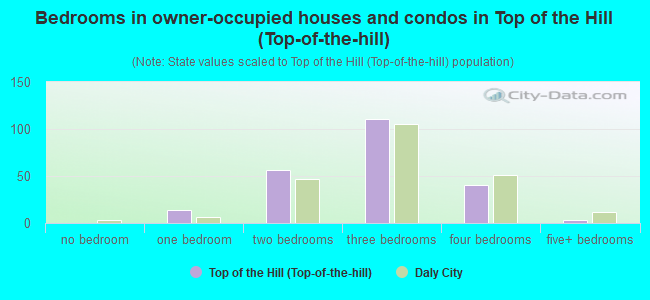
- Bedrooms in owner-occupied houses and condos in Top of the Hill <
> - 0no bedroom
- 141 bedroom
- 562 bedrooms
- 1113 bedrooms
- 404 bedrooms
- 35+ bedrooms
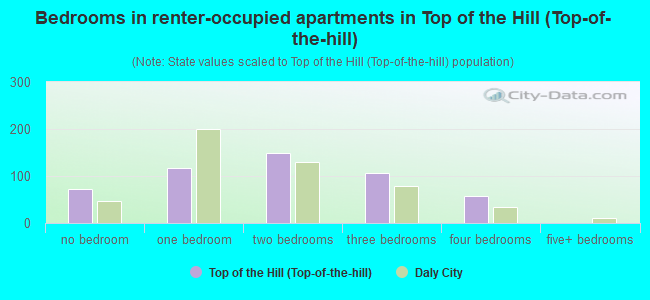
- Bedrooms in renter-occupied apartments in Top of the Hill <
> - 72no bedroom
- 1161 bedroom
- 1482 bedrooms
- 1063 bedrooms
- 584 bedrooms
- 05+ bedrooms
Average number of cars or other vehicles available in houses/condos:
Average number of cars or other vehicles available in apartments:
| This neighborhood: | 2.4 |
| Daly City: | 2.1 |
Average number of cars or other vehicles available in apartments:
| Here: | 1.9 |
| city: | 1.6 |
Percentage of units with a mortgage:
| Top of the Hill (Top-of-the-hill): | 66.6% |
| Daly City: | 61.0% |
Housing prices:
- Average estimated value of detached houses in 2022 (29.3% of all units):
Top of the Hill (Top-of-the-hill): $871,029 California: $988,808
- Average estimated value of townhouses or other attached units in 2022 (25.4% of all units):
This neighborhood: $1,107,746 California: $838,546
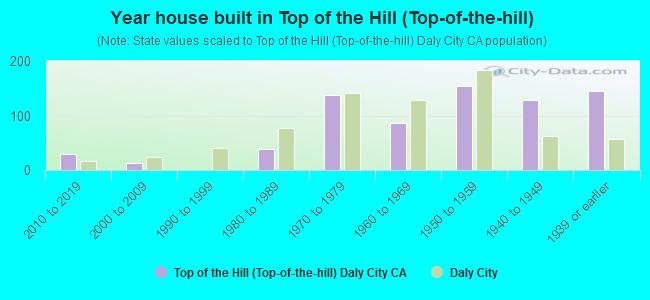
- Year house built in Top of the Hill <
> - 02020 or later
- 292010 to 2019
- 122000 to 2009
- 01990 to 1999
- 381980 to 1989
- 1371970 to 1979
- 871960 to 1969
- 1541950 to 1959
- 1291940 to 1949
- 1451939 or earlier
City-data.com crime index for city in 2020 (higher means more crime):
| City: | 129.4 |
| U.S. average: | 219.5 |
Travel time to work (commute)
![Travel time to work (commute)]()
- 18Less than 5 minutes
- 325 to 9 minutes
- 13610 to 14 minutes
- 23615 to 19 minutes
- 18820 to 24 minutes
- 2525 to 29 minutes
- 26530 to 34 minutes
- 1435 to 39 minutes
- 540 to 44 minutes
- 14445 to 59 minutes
- 10460 to 89 minutes
- 1290 or more minutes

Means of transportation to work
![Means of transportation to work]()
- 50.2%644Drove a car alone
- 19.9%255Carpooled
- 6.9%88Bus
- 16.2%208Subway or elevated rail
- 1.6%20Long-distance train or commuter rail
- 1.2%16Light rail, streetcar or trolley
- 2.5%32Taxi
- 3.7%48Motorcycle
- 0.8%10Bicycle
- 3.0%38Walked
- 0.6%8Other means
- 9.2%118Worked at home

Time leaving home to go to work
![Time leaving home to go to work]()
- 4912:00 a.m. to 4:59 a.m.
- 195:00 a.m. to 5:29 a.m.
- 285:30 a.m. to 5:59 a.m.
- 946:00 a.m. to 6:29 a.m.
- 736:30 a.m. to 6:59 a.m.
- 1087:00 a.m. to 7:29 a.m.
- 957:30 a.m. to 7:59 a.m.
- 338:00 a.m. to 8:29 a.m.
- 638:30 a.m. to 8:59 a.m.
- 2279:00 a.m. to 9:59 a.m.
- 2810:00 a.m. to 10:59 a.m.
- 3511:00 a.m. to 11:59 a.m.
- 9212:00 p.m. to 3:59 p.m.
- 1464:00 p.m. to 11:59 p.m.

Occupations of males:
- Percentage of males in management occupations (except farmers):
Here: 10.1% city: 7.8%
- Percentage of males in business and financial operations occupations:
Here: 3.8% city: 4.6%
- Percentage of males in computer and mathematical occupations:
Here: 7.9% city: 5.8%
- Percentage of males in life, physical, and social science occupations:
Here: 2.2% city: 1.0%
- Percentage of males in service occupations:
Here: 23.7% city: 17.3%
- Percentage of males in sales and office occupations:
Here: 23.0% city: 17.7%
- Percentage of males in construction, extraction, and maintenance occupations:
Here: 6.8% city: 8.6%
- Percentage of males in production occupations:
Here: 4.0% city: 4.3%
- Percentage of males in transportation occupations:
Here: 3.4% city: 9.3%
- Percentage of males in material moving occupations:
Here: 3.2% city: 4.8%
Occupations of females:
- Percentage of females in management occupations (except farmers):
Here: 7.3% city: 8.1%
- Percentage of females in business and financial operations occupations:
Here: 6.3% city: 8.4%
- Percentage of females in computer and mathematical occupations:
Here: 1.2% city: 2.0%
- Percentage of females in legal occupations:
Here: 2.3% city: 0.8%
- Percentage of females in education, training, and library occupations:
Here: 8.1% city: 5.1%
- Percentage of females in arts, design, entertainment, sports, and media occupations:
Here: 8.1% city: 2.0%
- Percentage of females in healthcare practitioners and technical occupations:
Here: 7.4% city: 10.8%
- Percentage of females in service occupations:
Here: 37.1% city: 25.2%
- Percentage of females in sales and office occupations:
Here: 22.3% city: 27.7%
- Percentage of females in material moving occupations:
Here: 1.9% city: 2.5%
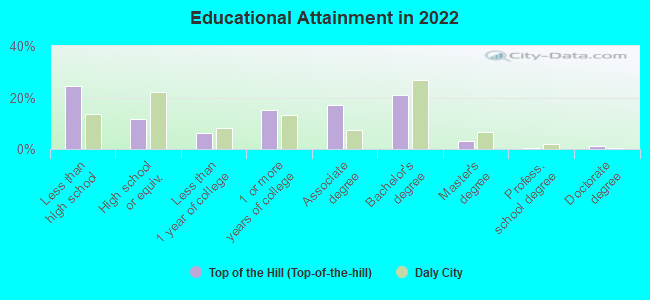
Education in this neighborhood (subdivision or community):
- Percentage of people 3 years and older in K-12 schools:
Top of the Hill (Top-of-the-hill): 10.3% Daly City: 11.4%
- Percentage of people 3 years and older in undergraduate colleges:
Top of the Hill (Top-of-the-hill): 6.8% Daly City: 6.1%
- Percentage of people 3 years and older in grad. or professional schools:
Top of the Hill (Top-of-the-hill): 0.0% Daly City: 2.0%
- Percentage of students K-12 enrolled in private schools:
Top of the Hill (Top-of-the-hill): 23.9% Daly City: 20.0%
Percentage of population below poverty level:
| Top of the Hill (Top-of-the-hill): | 8.3% |
| Daly City: | 11.3% |
Median year owner moved in (as recorded in 2022):
Median year renter moved in (as recorded in 2022):
| Top of the Hill (Top-of-the-hill): | 1999 |
| Daly City: | 2003 |
Median year renter moved in (as recorded in 2022):
| Top of the Hill (Top-of-the-hill): | 2014 |
| Daly City: | 2019 |
Percentage of married-couple families with both working:
| Top of the Hill (Top-of-the-hill): | 94.9% |
| Daly City: | 65.5% |
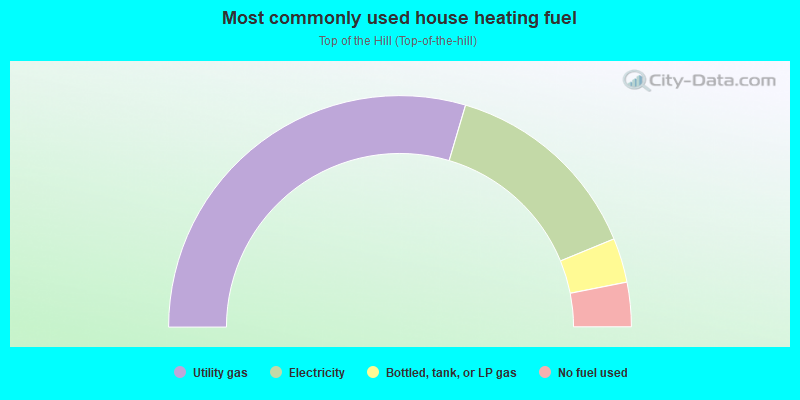
- 59.1%Utility gas
- 28.4%Electricity
- 6.2%Bottled, tank, or LP gas
- 6.2%No fuel used
Highways in this neighborhood:
State Hwy 82 (Mission St)
Length: 0.38 miles
Directions: E-W, N-S, SW-NE
Address range: 6286 to 6718
Directions: E-W, N-S, SW-NE
Address range: 6286 to 6718
State Hwy 82 (San Jose Ave)
Length: 0.03 miles
Direction: SW-NE
Address range: 6259 to 6284
Direction: SW-NE
Address range: 6259 to 6284
Roads and streets:
Santa Barbara Ave
Length: 0.39 miles
Directions: E-W, N-S, SW-NE
Address range: 200 to 499
Directions: E-W, N-S, SW-NE
Address range: 200 to 499
Los Olivos Ave
Length: 0.37 miles
Direction: E-W
Address range: 1 to 299
Direction: E-W
Address range: 1 to 299
Vista Grande Ave
Length: 0.37 miles
Direction: E-W
Address range: 1 to 399
Direction: E-W
Address range: 1 to 399
Knowles Ave
Length: 0.37 miles
Direction: E-W
Address range: 1 to 399
Direction: E-W
Address range: 1 to 399
San Diego Ave
Length: 0.36 miles
Direction: N-S
Address range: 200 to 499
Direction: N-S
Address range: 200 to 499
Hillcrest Dr
Length: 0.36 miles
Directions: E-W, SE-NW, SW-NE
Address range: 1 to 199
Directions: E-W, SE-NW, SW-NE
Address range: 1 to 199
John Daly Blvd
Length: 0.30 miles
Direction: E-W
Direction: E-W
Miriam St
Length: 0.29 miles
Direction: N-S
Address range: 1 to 199
Direction: N-S
Address range: 1 to 199
Hillside Blvd
Length: 0.26 miles
Directions: N-S, SE-NW
Address range: 1 to 220
Directions: N-S, SE-NW
Address range: 1 to 220
Woodrow St
Length: 0.23 miles
Directions: N-S, SE-NW
Address range: 1 to 199
Directions: N-S, SE-NW
Address range: 1 to 199
Parkview Ave
Length: 0.20 miles
Direction: E-W
Address range: 1 to 209
Direction: E-W
Address range: 1 to 209
Los Banos Ave
Length: 0.18 miles
Direction: E-W
Address range: 100 to 199
Direction: E-W
Address range: 100 to 199
Theta Ave
Length: 0.10 miles
Direction: E-W
Address range: 1 to 99
Direction: E-W
Address range: 1 to 99
N Parkview Ave
Length: 0.09 miles
Directions: E-W, SE-NW
Address range: 180 to 299
Directions: E-W, SE-NW
Address range: 180 to 299
Bepler St
Length: 0.07 miles
Direction: SE-NW
Address range: 1 to 48
Direction: SE-NW
Address range: 1 to 48
Mission Cir
Length: 0.07 miles
Directions: N-S, SW-NE
Address range: 1 to 99
Directions: N-S, SW-NE
Address range: 1 to 99
Alp Ave
Length: 0.05 miles
Direction: E-W
Address range: 1 to 99
Direction: E-W
Address range: 1 to 99
State Hwy 82
Length: 0.02 miles
Direction: SE-NW
Direction: SE-NW