Warnersville neighborhood in Greensboro, North Carolina (NC), 27406 detailed profile
Settings
X


Business Search - 14 Million verified businesses
Area: 0.225 square miles
Population: 996
Population density:
| Warnersville: | 4,420 people per square mile |
| Greensboro: | 2,876 people per square mile |

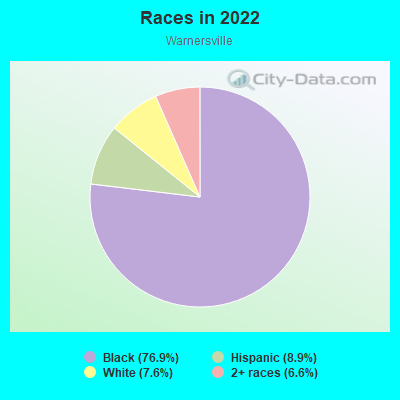
- 85676.9%Black
- 998.9%Hispanic or Latino
- 857.6%White
- 736.6%Two or more races
Distribution of median household income
![Distribution of median household income]()
- 32Less than $10,000
- 75$10,000 to $19,999
- 34$20,000 to $29,999
- 132$30,000 to $39,999
- 182$40,000 to $49,999
- 29$50,000 to $59,999
- 64$60,000 to $74,999
- 16$75,000 to $99,999
- 28$100,000 to $124,999
- 9$125,000 to $149,999
- 6$150,000 to $199,999
- 6$200,000 or more

Distribution of owner-occupied house/condo value
![Distribution of owner-occupied house/condo value]()
- 11Less than $50,000
- 56$50,000 to $99,999
- 52$100,000 to $149,999
- 21$150,000 to $199,999
- 14$200,000 to $249,999
- 257$250,000 to $299,999
- 1$300,000 to $399,999
- 46$500,000 to $749,999

Distribution of rent paid by renters
![Distribution of rent paid by renters]()
- 62Less than $100
- 25$100 to $199
- 65$200 to $299
- 107$300 to $399
- 14$400 to $499
- 99$500 to $599
- 51$600 to $699
- 90$700 to $799
- 64$800 to $899
- 32$900 to $999
- 2$1,000 to $1,249
- 19$1,250 to $1,499
- 68$1,500 to $1,999
- 73$2,000 or more

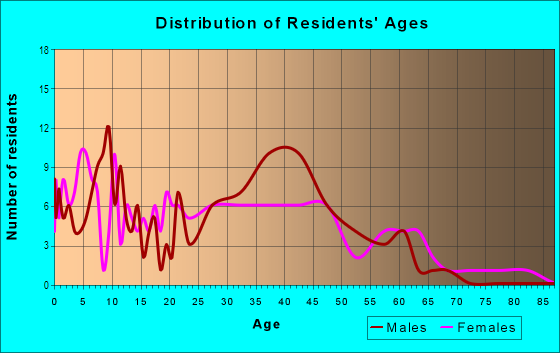
| Males: | 384 |
| Females: | 612 |
Males:
| This neighborhood: | 16.4 years |
| Whole city: | 32.4 years |
| This neighborhood: | 31.7 years |
| Whole city: | 35.3 years |
Average household size:
| Warnersville: | 2.4 people |
| Greensboro: | 2.3 people |
Percentage of family households:
| Warnersville: | 31.3% |
| Greensboro: | 43.6% |
| Here: | 7.4% |
| Greensboro: | 36.2% |
Percentage of married-couple families with children (among all households):
| Warnersville: | 5.3% |
| Greensboro: | 22.4% |
Percentage of single-mother households (among all households):
| Warnersville: | 37.5% |
| Greensboro: | 15.5% |
Percentage of never married males 15 years old and over:
Percentage of never married females 15 years old and over:
| Warnersville: | 27.7% |
| Greensboro: | 20.8% |
Percentage of never married females 15 years old and over:
| Warnersville: | 47.3% |
| city: | 23.9% |
Percentage of people that speak English not well or not at all:
| Warnersville: | 1.4% |
| Greensboro: | 2.7% |
Percentage of people born in this state:
Percentage of people born in another U.S. state:
Percentage of native residents but born outside the U.S.:
Percentage of foreign born residents:
| Here: | 77.4% |
| Greensboro: | 52.7% |
Percentage of people born in another U.S. state:
| Warnersville: | 19.6% |
| Greensboro: | 33.7% |
Percentage of native residents but born outside the U.S.:
| Here: | 0.2% |
| city: | 1.6% |
Percentage of foreign born residents:
| Here: | 2.9% |
| Greensboro: | 12.0% |
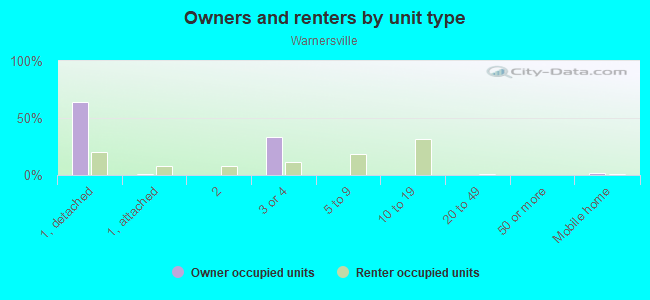
Owner-occupied
Renter-occupied

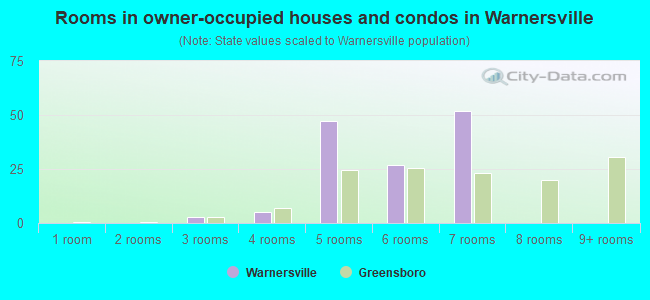
- Rooms in owner-occupied houses and condos in Warnersville
- 01 room
- 02 rooms
- 33 rooms
- 54 rooms
- 475 rooms
- 276 rooms
- 527 rooms
- 08 rooms
- 09+ rooms
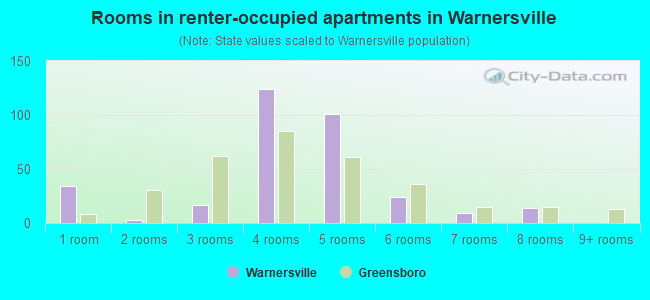
- Rooms in renter-occupied apartments in Warnersville
- 341 room
- 32 rooms
- 173 rooms
- 1244 rooms
- 1015 rooms
- 246 rooms
- 97 rooms
- 148 rooms
- 09+ rooms
Owner-occupied
Renter-occupied
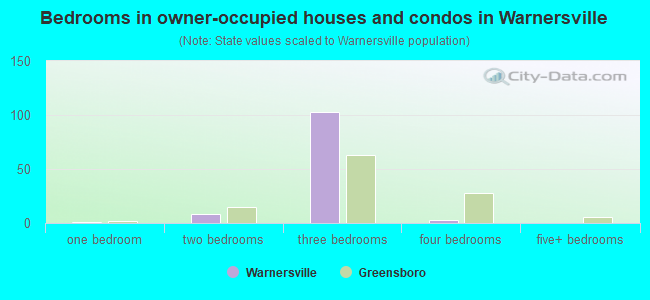
- Bedrooms in owner-occupied houses and condos in Warnersville
- 0no bedroom
- 11 bedroom
- 82 bedrooms
- 1033 bedrooms
- 34 bedrooms
- 05+ bedrooms
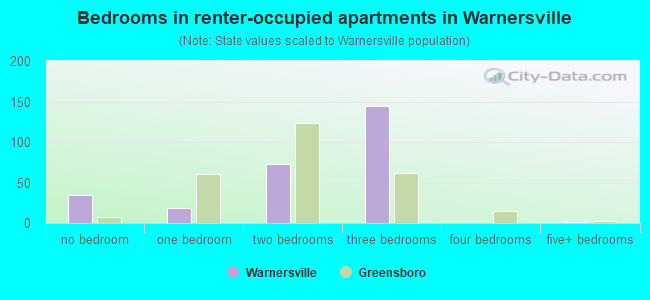
- Bedrooms in renter-occupied apartments in Warnersville
- 34no bedroom
- 191 bedroom
- 732 bedrooms
- 1443 bedrooms
- 04 bedrooms
- 15+ bedrooms
Average number of cars or other vehicles available in houses/condos:
Average number of cars or other vehicles available in apartments:
| This neighborhood: | 2.0 |
| Greensboro: | 2.0 |
Average number of cars or other vehicles available in apartments:
| Here: | 1.8 |
| city: | 1.4 |
Percentage of units with a mortgage:
| Warnersville: | 39.4% |
| Greensboro: | 67.4% |
Average estimated value of detached houses in 2022 (29.7% of all units):
| Warnersville: | $242,960 |
| Greensboro: | $297,193 |
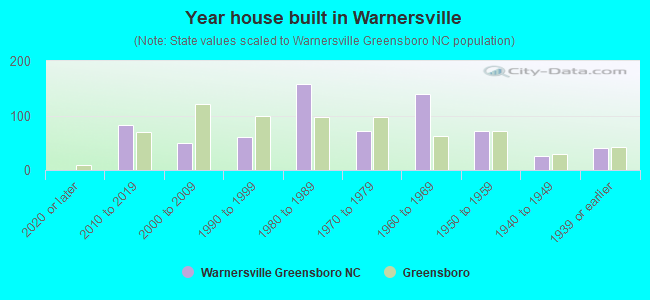
- Year house built in Warnersville
- 02020 or later
- 832010 to 2019
- 502000 to 2009
- 611990 to 1999
- 1571980 to 1989
- 721970 to 1979
- 1401960 to 1969
- 721950 to 1959
- 251940 to 1949
- 411939 or earlier
City-data.com crime index for city in 2020 (higher means more crime):
| City: | 435.6 |
| U.S. average: | 219.5 |
Travel time to work (commute)
![Travel time to work (commute)]()
- 11Less than 5 minutes
- 735 to 9 minutes
- 2410 to 14 minutes
- 9015 to 19 minutes
- 6120 to 24 minutes
- 3525 to 29 minutes
- 7630 to 34 minutes
- 235 to 39 minutes
- 240 to 44 minutes
- 12445 to 59 minutes
- 260 to 89 minutes
- 390 or more minutes

Means of transportation to work
![Means of transportation to work]()
- 64.0%299Drove a car alone
- 25.7%120Carpooled
- 13.3%62Bus
- 2.1%10Walked
- 4.7%22Other means
- 10.7%50Worked at home

Time leaving home to go to work
![Time leaving home to go to work]()
- 1412:00 a.m. to 4:59 a.m.
- 305:00 a.m. to 5:29 a.m.
- 25:30 a.m. to 5:59 a.m.
- 226:00 a.m. to 6:29 a.m.
- 386:30 a.m. to 6:59 a.m.
- 287:00 a.m. to 7:29 a.m.
- 637:30 a.m. to 7:59 a.m.
- 268:00 a.m. to 8:29 a.m.
- 338:30 a.m. to 8:59 a.m.
- 329:00 a.m. to 9:59 a.m.
- 410:00 a.m. to 10:59 a.m.
- 311:00 a.m. to 11:59 a.m.
- 8012:00 p.m. to 3:59 p.m.
- 324:00 p.m. to 11:59 p.m.

Occupations of males:
- Percentage of males in community and social services occupations:
Here: 1.1% city: 1.4%
- Percentage of males in service occupations:
Here: 53.7% city: 14.3%
- Percentage of males in sales and office occupations:
Here: 7.0% city: 17.1%
- Percentage of males in construction, extraction, and maintenance occupations:
Here: 14.7% city: 6.0%
- Percentage of males in production occupations:
Here: 1.1% city: 7.5%
- Percentage of males in transportation occupations:
Here: 5.9% city: 6.8%
- Percentage of males in material moving occupations:
Here: 32.3% city: 9.6%
Occupations of females:
- Percentage of females in business and financial operations occupations:
Here: 11.2% city: 5.5%
- Percentage of females in computer and mathematical occupations:
Here: 1.6% city: 2.1%
- Percentage of females in education, training, and library occupations:
Here: 15.3% city: 10.3%
- Percentage of females in healthcare practitioners and technical occupations:
Here: 1.2% city: 8.6%
- Percentage of females in service occupations:
Here: 28.0% city: 19.4%
- Percentage of females in sales and office occupations:
Here: 24.4% city: 29.0%
- Percentage of females in production occupations:
Here: 17.4% city: 5.2%
- Percentage of females in transportation occupations:
Here: 5.5% city: 1.5%
- Percentage of females in material moving occupations:
Here: 7.1% city: 2.7%
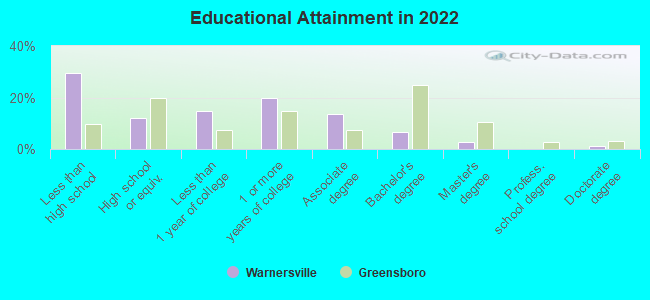
Education in this neighborhood (subdivision or community):
- Percentage of people 3 years and older in K-12 schools:
Warnersville: 34.2% Greensboro: 17.6%
- Percentage of people 3 years and older in undergraduate colleges:
Warnersville: 41.9% Greensboro: 11.2%
- Percentage of people 3 years and older in grad. or professional schools:
Warnersville: 1.3% Greensboro: 2.6%
- Percentage of students K-12 enrolled in private schools:
Warnersville: 3.1% Greensboro: 13.3%
Percentage of population below poverty level:
| Warnersville: | 54.3% |
| Greensboro: | 21.9% |
Median year renter moved in (as recorded in 2022):
| Warnersville: | 2017 |
| Greensboro: | 2020 |
Percentage of married-couple families with both working:
| Warnersville: | 83.9% |
| Greensboro: | 70.9% |
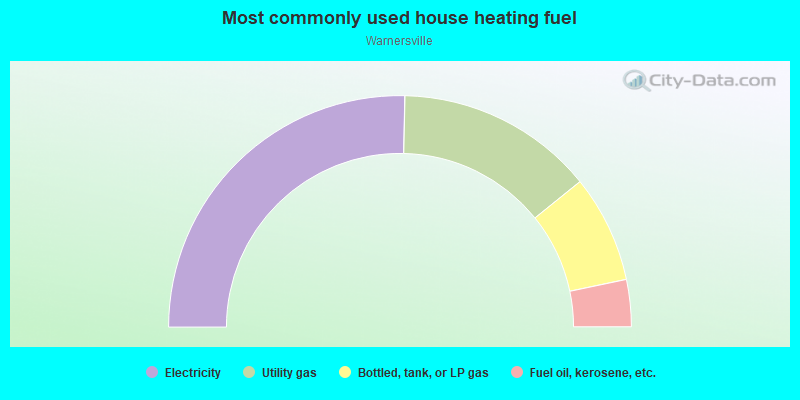
- 50.7%Electricity
- 27.7%Utility gas
- 15.0%Bottled, tank, or LP gas
- 6.6%Fuel oil, kerosene, etc.
Highways in this neighborhood:
State Hwy 6 (W Lee St)
Length: 0.17 miles
Direction: E-W
Address range: 300 to 348
Direction: E-W
Address range: 300 to 348
Roads and streets:
Bilbro St
Length: 0.51 miles
Directions: E-W, N-S, SW-NE
Address range: 800 to 1299
Directions: E-W, N-S, SW-NE
Address range: 800 to 1299
S Eugene St
Length: 0.41 miles
Direction: N-S
Address range: 700 to 1299
Direction: N-S
Address range: 700 to 1299
W Whittington St
Length: 0.41 miles
Direction: E-W
Address range: 100 to 399
Direction: E-W
Address range: 100 to 399
Ashe St
Length: 0.33 miles
Directions: E-W, N-S, SE-NW
Address range: 900 to 1109
Directions: E-W, N-S, SE-NW
Address range: 900 to 1109
S Elm St
Length: 0.29 miles
Direction: N-S
Address range: 800 to 999
Direction: N-S
Address range: 800 to 999
Arlington St
Length: 0.26 miles
Direction: N-S
Address range: 600 to 999
Direction: N-S
Address range: 600 to 999
Austin Ct
Length: 0.18 miles
Directions: E-W, N-S, SE-NW, SW-NE
Address range: 1 to 99
Directions: E-W, N-S, SE-NW, SW-NE
Address range: 1 to 99
W Bragg St
Length: 0.16 miles
Direction: E-W
Address range: 100 to 299
Direction: E-W
Address range: 100 to 299
Milburn St
Length: 0.14 miles
Direction: E-W
Address range: 300 to 399
Direction: E-W
Address range: 300 to 399
Ireland St
Length: 0.13 miles
Direction: E-W
Address range: 500 to 599
Direction: E-W
Address range: 500 to 599
E McCulloch St
Length: 0.11 miles
Direction: E-W
Address range: 100 to 199
Direction: E-W
Address range: 100 to 199
E Whittington St
Length: 0.11 miles
Direction: E-W
Address range: 100 to 199
Direction: E-W
Address range: 100 to 199
E Bragg St
Length: 0.11 miles
Direction: E-W
Address range: 100 to 199
Direction: E-W
Address range: 100 to 199
St James Apt Ent
Length: 0.09 miles
Direction: E-W
Direction: E-W
W McCulloch St
Length: 0.06 miles
Direction: SW-NE
Address range: 100 to 199
Direction: SW-NE
Address range: 100 to 199
Tipton Ct
Length: 0.04 miles
Direction: E-W
Address range: 1 to 11
Direction: E-W
Address range: 1 to 11
Railroad features:
Norfolk Southern Rlwy
Length: 0.30 miles
Direction: N-S
Direction: N-S