Latest news about poverty in Durham, NC collected exclusively by city-data.com from local newspapers, TV, and radio stations
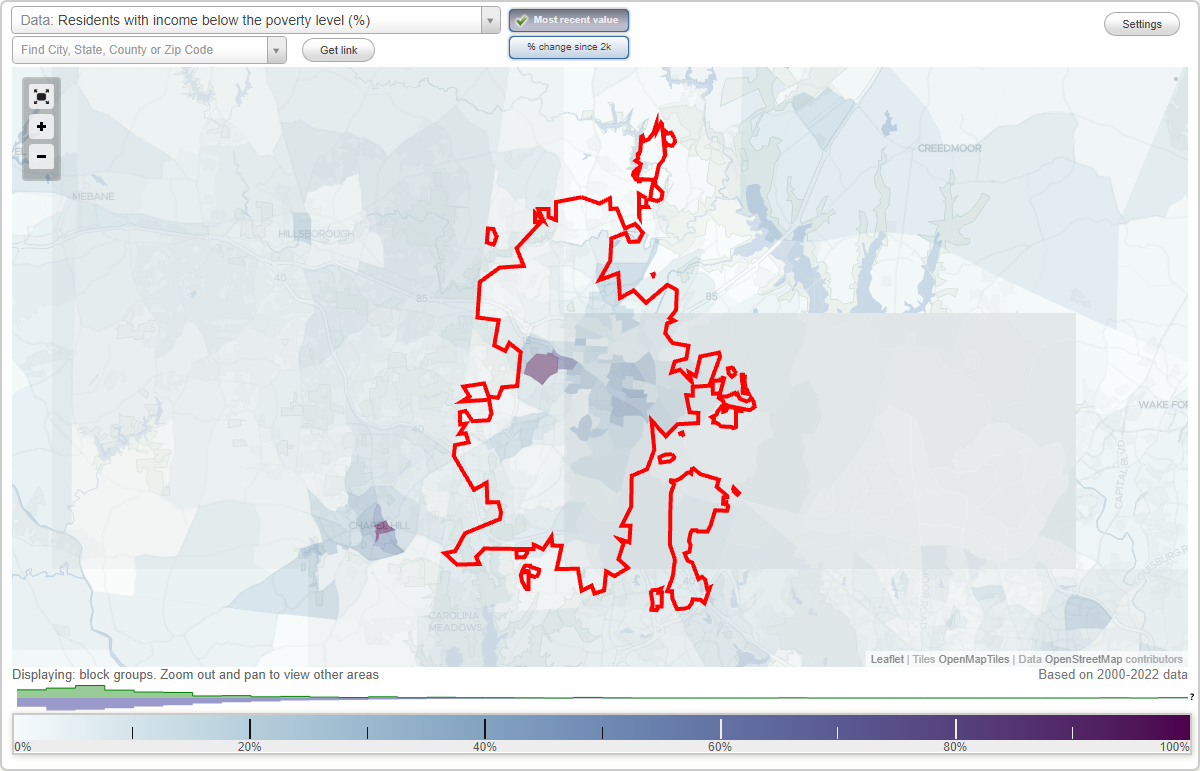
11.2% of Durham, NC residents had an income below the poverty level in 2022, which was 14.2% less than the poverty level of 12.8% across the entire state of North Carolina. 7.4% of high school graduates and 22.3% of non high school graduates live in poverty. The poverty rate was 17.2% among disabled residents. The renting rate among poor residents was 78.1%. For comparison, it was 33.5% among residents with income above the poverty level.
Poverty rates in Durham, NC
Residents with income below the poverty level in 2022:
Durham:
11.2%
Whole state:
12.8%
Residents with income below 50% of the poverty level in 2022:
Durham:
4.6%
Whole state:
6.0%
Poverty rate among disabled residents:
Durham:
17.2%
North Carolina:
20.4%
Disability rate in this city among poor residents (it is 10.7% among residents who are not classified as poor):
Durham:
17.6%
North Carolina:
22.0%
Renting rate in this city among poor and not poor residents:
Residents below poverty level:
78.1%
Residents above poverty level:
33.5%
Poverty by age in Durham, NC
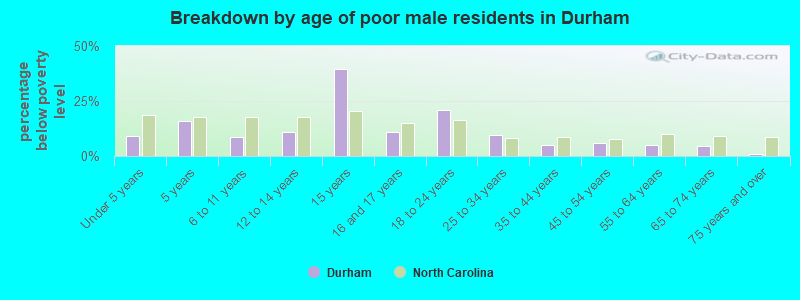
Breakdown by age of poor male residents in Durham,NC (percentage below poverty level)
14.6%Under 5 years
0.0%5 years
10.5%6 to 11 years
8.3%12 to 14 years
20.9%15 years
23.5%16 and 17 years
13.9%18 to 24 years
12.4%25 to 34 years
6.7%35 to 44 years
4.4%45 to 54 years
12.9%55 to 64 years
6.8%65 to 74 years
6.4%75 years and over
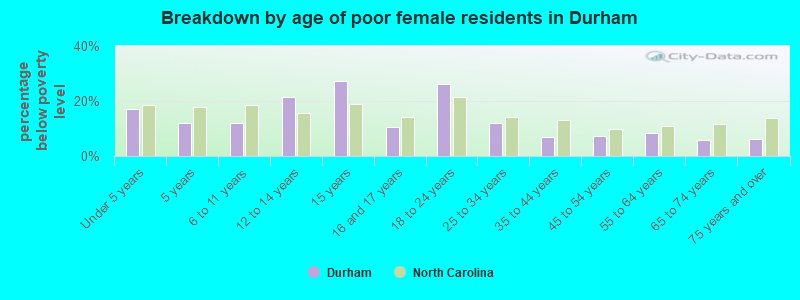
Breakdown by age of poor female residents in Durham,NC (percentage below poverty level)
28.1%Under 5 years
21.2%5 years
16.6%6 to 11 years
23.4%12 to 14 years
6.4%15 years
23.1%16 and 17 years
18.1%18 to 24 years
9.1%25 to 34 years
10.1%35 to 44 years
7.8%45 to 54 years
6.9%55 to 64 years
6.0%65 to 74 years
10.8%75 years and over
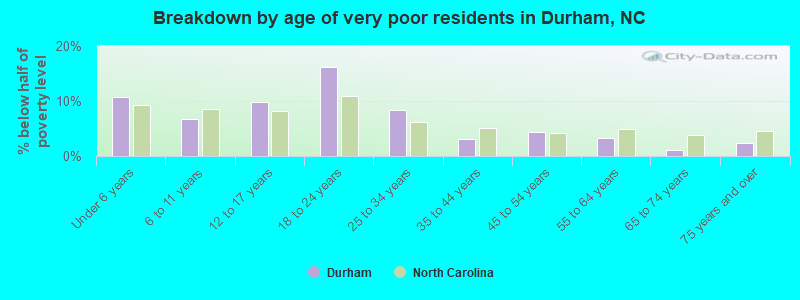
Breakdown by age of very poor residents in Durham,NC (% below half of poverty level)
10.0%Under 6 years
3.9%6 to 11 years
4.0%12 to 17 years
9.3%18 to 24 years
5.5%25 to 34 years
3.8%35 to 44 years
1.7%45 to 54 years
3.9%55 to 64 years
1.9%65 to 74 years
1.9%75 years and over
Poverty by race and place of birth in Durham, NC
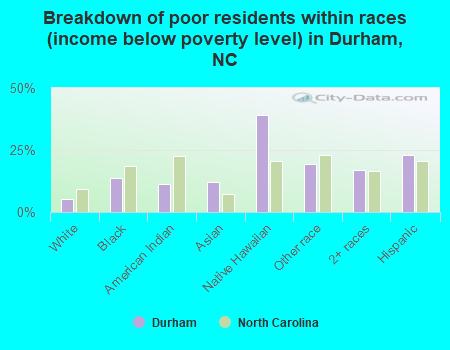
Breakdown of poor residents within races in Durham, NC (%)
5.2%White
13.6%Black
11.3%American Indian
12.1%Asian
39.2%Native Hawaiian
19.2%Other race
16.8%2+ races
23.0%Hispanic
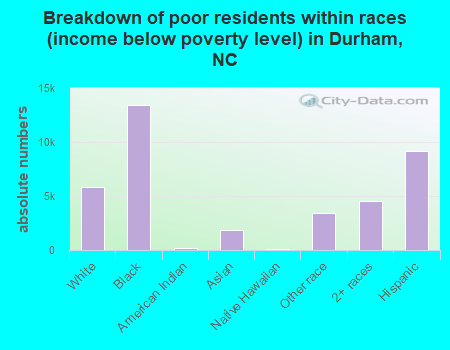
Breakdown of poor residents within races in Durham, NC (absolute numbers)
5,850White
13,440Black
139American Indian
1,818Asian
58Native Hawaiian
3,441Other race
4,5202+ races
9,140Hispanic
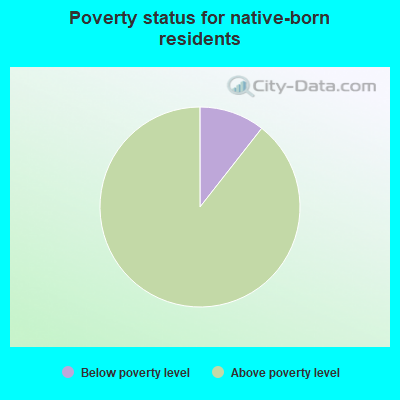
10.6%Below poverty level
89.4%Above poverty level
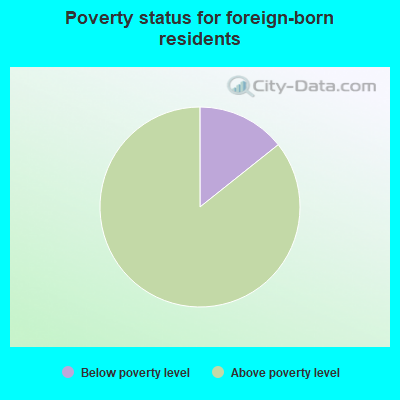
14.3%Below poverty level
85.7%Above poverty level
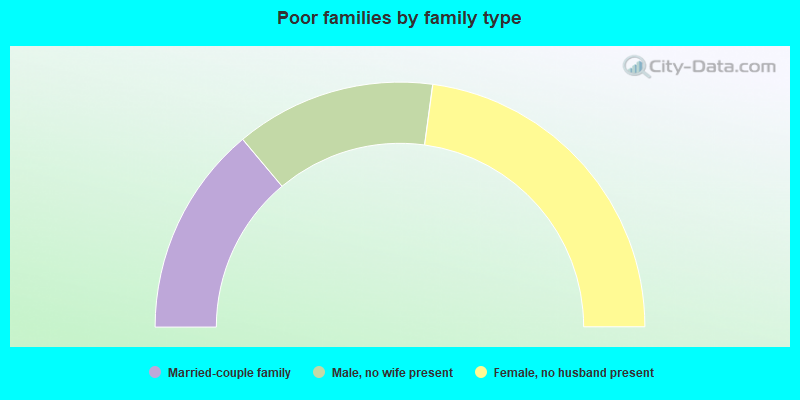
Poverty in families in Durham, NC
Children below poverty level:
Durham, North Carolina:
17.3%
State:
16.9%
Poverty rate among high school graduates:
Durham:
7.4%
North Carolina:
8.9%
Poverty rate among people who did not graduate high school: