Riverside, Oregon (OR) Poverty Rate Data
Information about poor and low-income residents
Settings
X


Recent posts about poverty in Riverside, Oregon on our local forum with over 2,400,000 registered users:
 | Fight Housing Prices (34 replies) |
| Thinking about moving to McMinnville? (111 replies) |
| Portland Private school wait lists (19 replies) |
| Pizza jobs? (39 replies) |
| Wanting to move to Oregon, but.. (12 replies) |
| Private elementary school in Beaverton area (37 replies) |
Latest news about poverty in Riverside, OR collected exclusively by city-data.com from local newspapers, TV, and radio stations
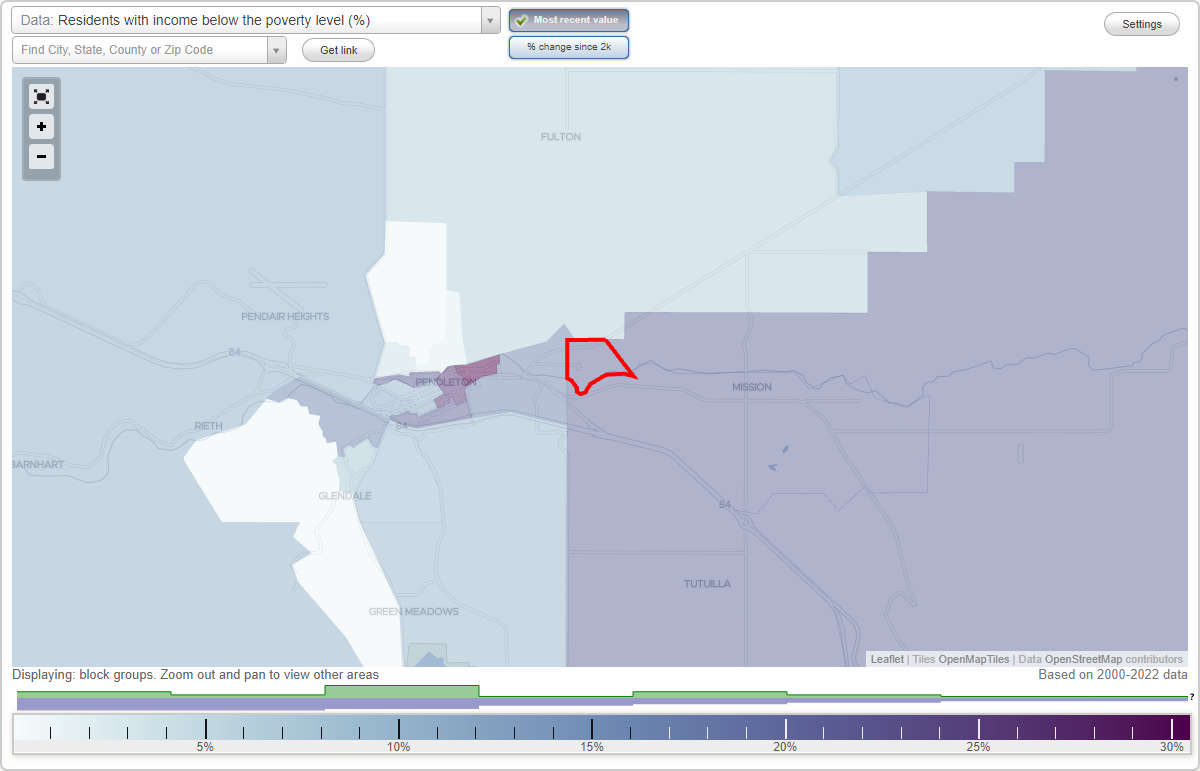
4.3% of Riverside, OR residents had an income below the poverty level in 2022, which was 179.3% less than the poverty level of 12.1% across the entire state of Oregon.
Poverty rates in Riverside, OR
Residents with income below the poverty level in 2022:
| Riverside: | 4.3% |
| Whole state: | 12.1% |
Poverty by age in Riverside, OR
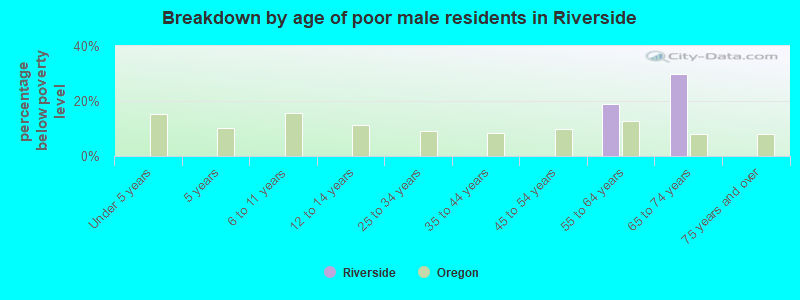
- Breakdown by age of poor male residents in Riverside,OR (percentage below poverty level)
- 0.0%Under 5 years
- 0.0%5 years
- 0.0%6 to 11 years
- 0.0%12 to 14 years
- 0.0%25 to 34 years
- 0.0%35 to 44 years
- 0.0%45 to 54 years
- 19.0%55 to 64 years
- 30.0%65 to 74 years
- 0.0%75 years and over
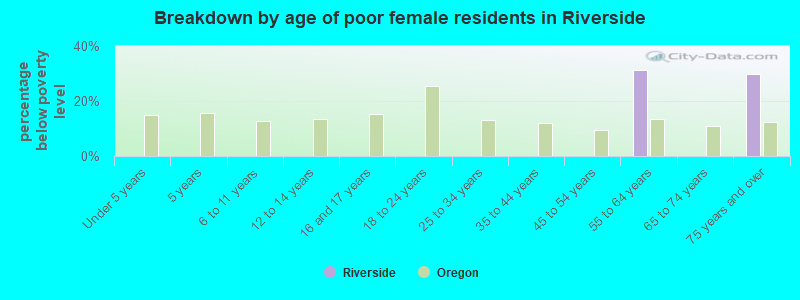
- Breakdown by age of poor female residents in Riverside,OR (percentage below poverty level)
- 0.0%Under 5 years
- 0.0%5 years
- 0.0%6 to 11 years
- 0.0%12 to 14 years
- 0.0%16 and 17 years
- 0.0%18 to 24 years
- 0.0%25 to 34 years
- 0.0%35 to 44 years
- 0.0%45 to 54 years
- 31.2%55 to 64 years
- 0.0%65 to 74 years
- 30.0%75 years and over
Poverty by race and place of birth in Riverside, OR
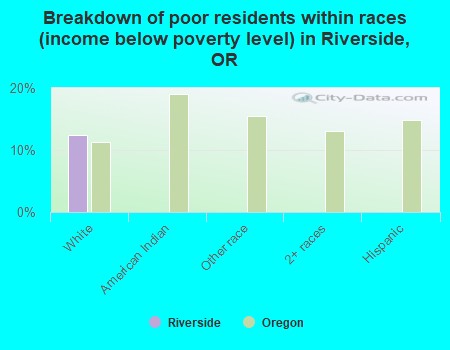
- Breakdown of poor residents within races in Riverside, OR (%)
- 12.5%White
- 0.0%American Indian
- 0.0%Other race
- 0.0%2+ races
- 0.0%Hispanic
- Breakdown of poor residents within races in Riverside, OR (absolute numbers)
- 15White
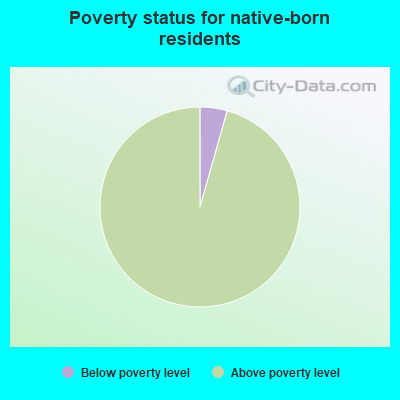
- 4.4%Below poverty level
- 95.6%Above poverty level
Poverty in families in Riverside, OR
Children below poverty level:
| Riverside, Oregon: | 0.0% |
| State: | 13.3% |
Poverty rate among high school graduates:
| Riverside: | 9.9% |
| Oregon: | 9.5% |
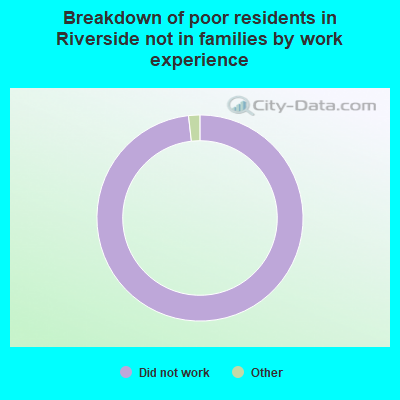
- 0.0%Worked full-time, year-round
- 0.0%Worked part-time
- 100.0%Did not work
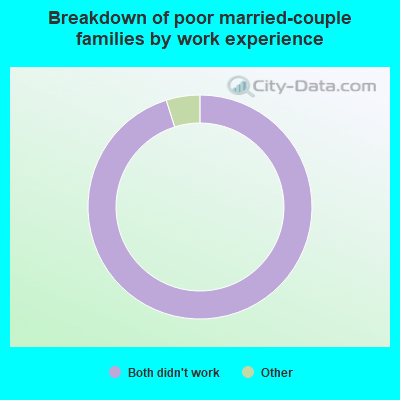
- 0.0%Both worked full-time
- 0.0%One full-time, other part-time
- 0.0%One full-time, other didn't work
- 0.0%Both worked part-time
- 0.0%One part-time, other didn't work
- 100.0%Both didn't work
Other data
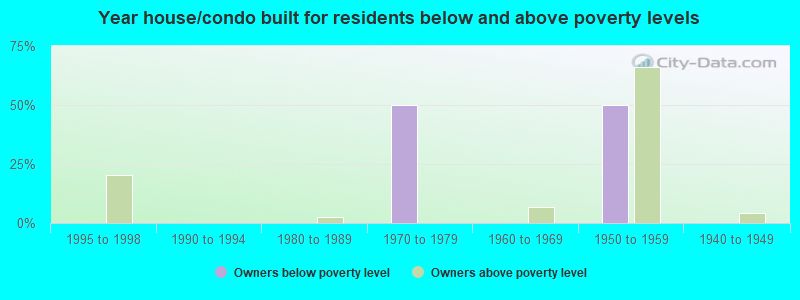
- Owners below poverty level
- 0.0%1999 to 2000
- 0.0%1995 to 1998
- 0.0%1990 to 1994
- 0.0%1980 to 1989
- 50.0%1970 to 1979
- 0.0%1960 to 1969
- 50.0%1950 to 1959
- 0.0%1940 to 1949
- 0.0%1939 or earlier
- Owners above poverty level
- 0.0%1999 to 2000
- 20.3%1995 to 1998
- 0.0%1990 to 1994
- 2.7%1980 to 1989
- 0.0%1970 to 1979
- 6.8%1960 to 1969
- 66.2%1950 to 1959
- 4.1%1940 to 1949
- 0.0%1939 or earlier