Running Water, South Dakota (SD) Poverty Rate Data
Information about poor and low-income residents
Data:
Taking into account residents not living in families, 17.9% of high school graduates and 37.5% of non high school graduates live in poverty.
Poverty in families in Running Water, SD
Poverty rate among high school graduates not in families:| Running Water: | 17.9% |
| South Dakota: | 20.2% |
Poverty rate among people who did not graduate high school not in families:| Running Water: | 37.5% |
| South Dakota: | 39.2% |
Other data

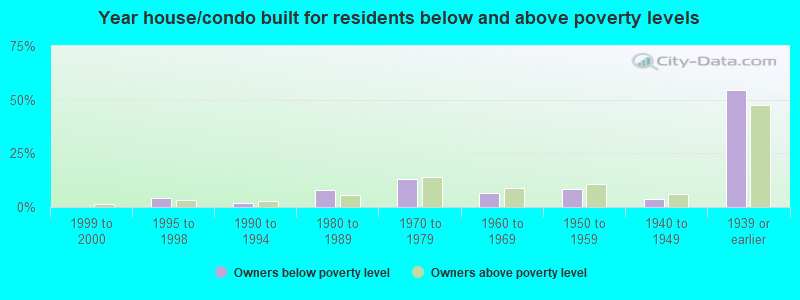
- Owners below poverty level
- 0.0%1999 to 2000
- 4.4%1995 to 1998
- 1.9%1990 to 1994
- 7.8%1980 to 1989
- 13.1%1970 to 1979
- 6.3%1960 to 1969
- 8.3%1950 to 1959
- 3.9%1940 to 1949
- 54.4%1939 or earlier
- Owners above poverty level
- 1.3%1999 to 2000
- 3.3%1995 to 1998
- 2.8%1990 to 1994
- 5.5%1980 to 1989
- 14.1%1970 to 1979
- 8.8%1960 to 1969
- 10.9%1950 to 1959
- 6.1%1940 to 1949
- 47.3%1939 or earlier