Races in Alabaster, Alabama (AL) Detailed Stats
Data:
Races - White alone (%)
Races - White alone (% change since 2000)
Races - Black alone (%)
Races - Black alone (% change since 2000)
Races - American Indian alone (%)
Races - American Indian alone (% change since 2000)
Races - Asian alone (%)
Races - Asian alone (% change since 2000)
Races - Hispanic (%)
Races - Hispanic (% change since 2000)
Races - Native Hawaiian and Other Pacific Islander alone (%)
Races - Native Hawaiian and Other Pacific Islander alone (% change since 2000)
Races - Two or more races(%)
Races - Two or more races(% change since 2000)
Races - Other race alone (%)
Races - Other race alone (% change since 2000)
Racial diversity
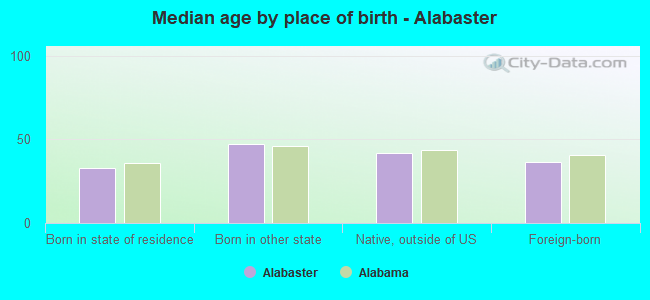
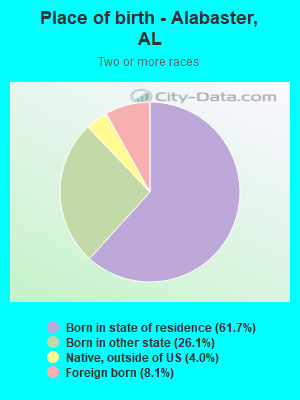
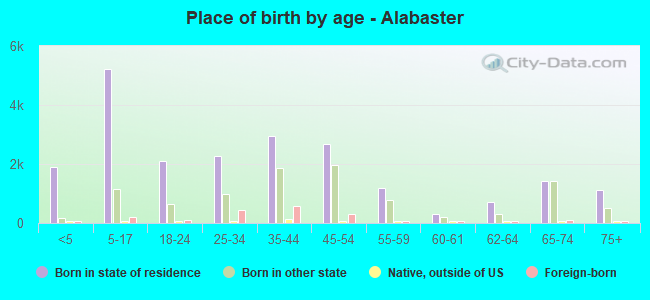
Place of birth - Born in state of residence (%)
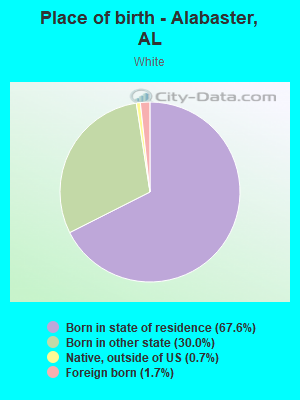
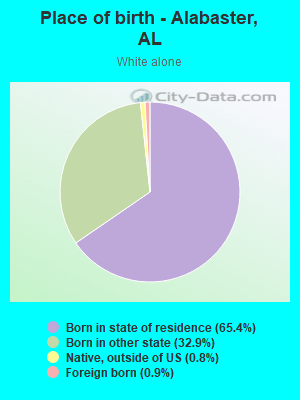
Place of birth - Born in state of residence (%) - White
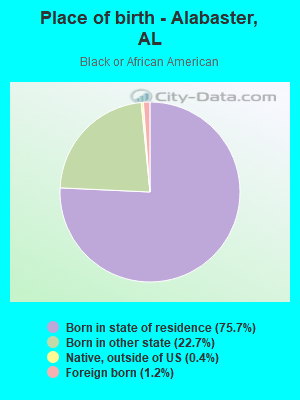
Place of birth - Born in state of residence (%) - Black or African American
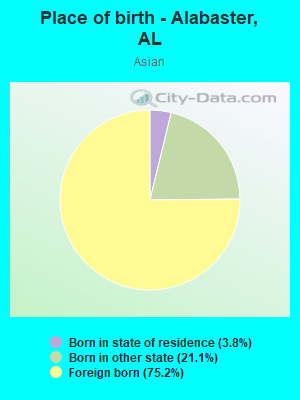
Place of birth - Born in state of residence (%) - Asian
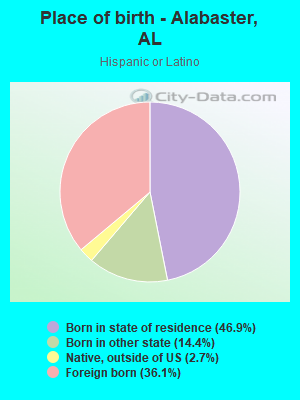
Place of birth - Born in state of residence (%) - Hispanic or Latino
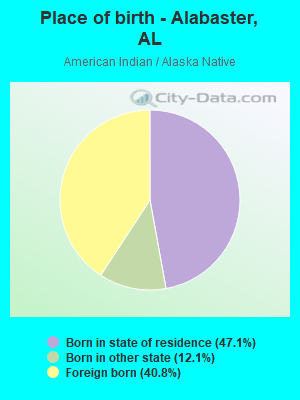
Place of birth - Born in state of residence (%) - American Indian and Alaska Native
Place of birth - Born in state of residence (%) - Multirace
Place of birth - Born in state of residence (%) - Other Race
Place of birth - Born in other state (%)
Place of birth - Born in other state (%) - White
Place of birth - Born in other state (%) - Black or African American
Place of birth - Born in other state (%) - Asian
Place of birth - Born in other state (%) - Hispanic or Latino
Place of birth - Born in other state (%) - American Indian and Alaska Native
Place of birth - Born in other state (%) - Multirace
Place of birth - Born in other state (%) - Other Race
Place of birth - Native, outside of US (%)
Place of birth - Native, outside of US (%) - White
Place of birth - Native, outside of US (%) - Black or African American
Place of birth - Native, outside of US (%) - Asian
Place of birth - Native, outside of US (%) - Hispanic or Latino
Place of birth - Native, outside of US (%) - American Indian and Alaska Native
Place of birth - Native, outside of US (%) - Multirace
Place of birth - Native, outside of US (%) - Other Race
Place of birth - Foreign born (%)
Place of birth - Foreign born (%) - White
Place of birth - Foreign born (%) - Black or African American
Place of birth - Foreign born (%) - Asian
Place of birth - Foreign born (%) - Hispanic or Latino
Place of birth - Foreign born (%) - American Indian and Alaska Native
Place of birth - Foreign born (%) - Multirace
Place of birth - Foreign born (%) - Other Race
Residents speaking English at home (%)
Residents speaking English at home - Born in the United States (%)
Residents speaking English at home - Native, born elsewhere (%)
Residents speaking English at home - Foreign born (%)
Residents speaking Spanish at home (%)
Residents speaking Spanish at home - Born in the United States (%)
Residents speaking Spanish at home - Native, born elsewhere (%)
Residents speaking Spanish at home - Foreign born (%)
Residents speaking other language at home (%)
Residents speaking other language at home - Born in the United States (%)
Residents speaking other language at home - Native, born elsewhere (%)
Residents speaking other language at home - Foreign born (%)
Marital status - Never married (%)
Marital status - Now married (%)
Marital status - Separated (%)
Marital status - Widowed (%)
Marital status - Divorced (%)
Ancestries Reported - Arab (%)
Ancestries Reported - Czech (%)
Ancestries Reported - Danish (%)
Ancestries Reported - Dutch (%)
Ancestries Reported - English (%)
Ancestries Reported - French (%)
Ancestries Reported - French Canadian (%)
Ancestries Reported - German (%)
Ancestries Reported - Greek (%)
Ancestries Reported - Hungarian (%)
Ancestries Reported - Irish (%)
Ancestries Reported - Italian (%)
Ancestries Reported - Lithuanian (%)
Ancestries Reported - Norwegian (%)
Ancestries Reported - Polish (%)
Ancestries Reported - Portuguese (%)
Ancestries Reported - Russian (%)
Ancestries Reported - Scotch-Irish (%)
Ancestries Reported - Scottish (%)
Ancestries Reported - Slovak (%)
Ancestries Reported - Subsaharan African (%)
Ancestries Reported - Swedish (%)
Ancestries Reported - Swiss (%)
Ancestries Reported - Ukrainian (%)
Ancestries Reported - United States (%)
Ancestries Reported - Welsh (%)
Ancestries Reported - West Indian (%)
Ancestries Reported - Other (%)
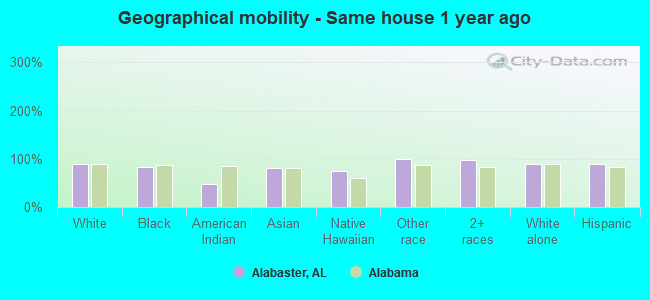
Geographical mobility - Same house 1 year ago (%)
Geographical mobility - Same house 1 year ago (%) - White
Geographical mobility - Same house 1 year ago (%) - Black or African American
Geographical mobility - Same house 1 year ago (%) - Asian
Geographical mobility - Same house 1 year ago (%) - Hispanic or Latino
Geographical mobility - Same house 1 year ago (%) - American Indian and Alaska Native
Geographical mobility - Same house 1 year ago (%) - Multirace
Geographical mobility - Same house 1 year ago (%) - Other Race
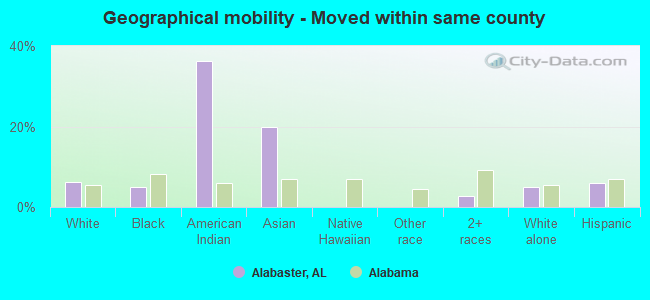
Geographical mobility - Moved within same county (%)
Geographical mobility - Moved within same county (%) - White
Geographical mobility - Moved within same county (%) - Black or African American
Geographical mobility - Moved within same county (%) - Asian
Geographical mobility - Moved within same county (%) - Hispanic or Latino
Geographical mobility - Moved within same county (%) - American Indian and Alaska Native
Geographical mobility - Moved within same county (%) - Multirace
Geographical mobility - Moved within same county (%) - Other Race
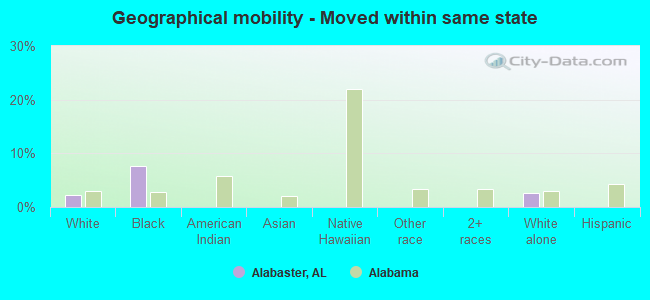
Geographical mobility - Moved from different county within same state (%)
Geographical mobility - Moved from different county within same state (%) - White
Geographical mobility - Moved from different county within same state (%) - Black or African American
Geographical mobility - Moved from different county within same state (%) - Asian
Geographical mobility - Moved from different county within same state (%) - Hispanic or Latino
Geographical mobility - Moved from different county within same state (%) - American Indian and Alaska Native
Geographical mobility - Moved from different county within same state (%) - Multirace
Geographical mobility - Moved from different county within same state (%) - Other Race
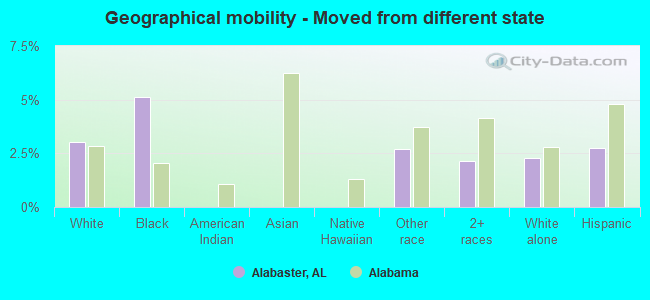
Geographical mobility - Moved from different state (%)
Geographical mobility - Moved from different state (%) - White
Geographical mobility - Moved from different state (%) - Black or African American
Geographical mobility - Moved from different state (%) - Asian
Geographical mobility - Moved from different state (%) - Hispanic or Latino
Geographical mobility - Moved from different state (%) - American Indian and Alaska Native
Geographical mobility - Moved from different state (%) - Multirace
Geographical mobility - Moved from different state (%) - Other Race
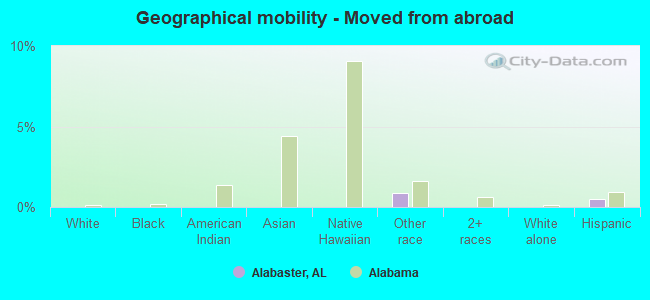
Geographical mobility - Moved from abroad (%)
Geographical mobility - Moved from abroad (%) - White
Geographical mobility - Moved from abroad (%) - Black or African American
Geographical mobility - Moved from abroad (%) - Asian
Geographical mobility - Moved from abroad (%) - Hispanic or Latino
Geographical mobility - Moved from abroad (%) - American Indian and Alaska Native
Geographical mobility - Moved from abroad (%) - Multirace
Geographical mobility - Moved from abroad (%) - Other Race
Place of birth for the foreign-born population - Ireland (%)
Place of birth for the foreign-born population - Denmark (%)
Place of birth for the foreign-born population - Norway (%)
Place of birth for the foreign-born population - Sweden (%)
Place of birth for the foreign-born population - United Kingdom (%)
Place of birth for the foreign-born population - England (%)
Place of birth for the foreign-born population - Scotland (%)
Place of birth for the foreign-born population - Other Northern Europe (%)
Place of birth for the foreign-born population - Austria (%)
Place of birth for the foreign-born population - Belgium (%)
Place of birth for the foreign-born population - France (%)
Place of birth for the foreign-born population - Germany (%)
Place of birth for the foreign-born population - Netherlands (%)
Place of birth for the foreign-born population - Switzerland (%)
Place of birth for the foreign-born population - Other Western Europe (%)
Place of birth for the foreign-born population - Greece (%)
Place of birth for the foreign-born population - Italy (%)
Place of birth for the foreign-born population - Portugal (%)
Place of birth for the foreign-born population - Spain (%)
Place of birth for the foreign-born population - Other Southern Europe (%)
Place of birth for the foreign-born population - Albania (%)
Place of birth for the foreign-born population - Belarus (%)
Place of birth for the foreign-born population - Bosnia and Herzegovina (%)
Place of birth for the foreign-born population - Bulgaria (%)
Place of birth for the foreign-born population - Croatia (%)
Place of birth for the foreign-born population - Czechoslovakia (%)
Place of birth for the foreign-born population - Hungary (%)
Place of birth for the foreign-born population - Latvia (%)
Place of birth for the foreign-born population - Lithuania (%)
Place of birth for the foreign-born population - North Macedonia (Macedonia) (%)
Place of birth for the foreign-born population - Moldova (%)
Place of birth for the foreign-born population - Poland (%)
Place of birth for the foreign-born population - Romania (%)
Place of birth for the foreign-born population - Russia (%)
Place of birth for the foreign-born population - Serbia (%)
Place of birth for the foreign-born population - Ukraine (%)
Place of birth for the foreign-born population - Other Eastern Europe (%)
Place of birth for the foreign-born population - China (%)
Place of birth for the foreign-born population - Hong Kong (%)
Place of birth for the foreign-born population - Taiwan (%)
Place of birth for the foreign-born population - Japan (%)
Place of birth for the foreign-born population - Korea (%)
Place of birth for the foreign-born population - Other Eastern Asia (%)
Place of birth for the foreign-born population - Afghanistan (%)
Place of birth for the foreign-born population - Bangladesh (%)
Place of birth for the foreign-born population - India (%)
Place of birth for the foreign-born population - Iran (%)
Place of birth for the foreign-born population - Kazakhstan (%)
Place of birth for the foreign-born population - Nepal (%)
Place of birth for the foreign-born population - Pakistan (%)
Place of birth for the foreign-born population - Sri Lanka (%)
Place of birth for the foreign-born population - Uzbekistan (%)
Place of birth for the foreign-born population - Other South Central Asia (%)
Place of birth for the foreign-born population - Burma (%)
Place of birth for the foreign-born population - Cambodia (%)
Place of birth for the foreign-born population - Indonesia (%)
Place of birth for the foreign-born population - Laos (%)
Place of birth for the foreign-born population - Malaysia (%)
Place of birth for the foreign-born population - Philippines (%)
Place of birth for the foreign-born population - Singapore (%)
Place of birth for the foreign-born population - Thailand (%)
Place of birth for the foreign-born population - Vietnam (%)
Place of birth for the foreign-born population - Other South Eastern Asia (%)
Place of birth for the foreign-born population - Armenia (%)
Place of birth for the foreign-born population - Iraq (%)
Place of birth for the foreign-born population - Israel (%)
Place of birth for the foreign-born population - Jordan (%)
Place of birth for the foreign-born population - Kuwait (%)
Place of birth for the foreign-born population - Lebanon (%)
Place of birth for the foreign-born population - Saudi Arabia (%)
Place of birth for the foreign-born population - Syria (%)
Place of birth for the foreign-born population - Turkey (%)
Place of birth for the foreign-born population - Yemen (%)
Place of birth for the foreign-born population - Other Western Asia (%)
Place of birth for the foreign-born population - Eritrea (%)
Place of birth for the foreign-born population - Ethiopia (%)
Place of birth for the foreign-born population - Kenya (%)
Place of birth for the foreign-born population - Somalia (%)
Place of birth for the foreign-born population - Uganda (%)
Place of birth for the foreign-born population - Zimbabwe (%)
Place of birth for the foreign-born population - Other Eastern Africa (%)
Place of birth for the foreign-born population - Cameroon (%)
Place of birth for the foreign-born population - Congo (%)
Place of birth for the foreign-born population - Democratic Republic of Congo (Zaire) (%)
Place of birth for the foreign-born population - Other Middle Africa (%)
Place of birth for the foreign-born population - Egypt (%)
Place of birth for the foreign-born population - Morocco (%)
Place of birth for the foreign-born population - Sudan (%)
Place of birth for the foreign-born population - Other Northern Africa (%)
Place of birth for the foreign-born population - South Africa (%)
Place of birth for the foreign-born population - Other Southern Africa (%)
Place of birth for the foreign-born population - Cabo Verde (%)
Place of birth for the foreign-born population - Ghana (%)
Place of birth for the foreign-born population - Liberia (%)
Place of birth for the foreign-born population - Nigeria (%)
Place of birth for the foreign-born population - Senegal (%)
Place of birth for the foreign-born population - Sierra Leone (%)
Place of birth for the foreign-born population - Other Western Africa (%)
Place of birth for the foreign-born population - Australia (%)
Place of birth for the foreign-born population - New Zealand (%)
Place of birth for the foreign-born population - Fiji (%)
Place of birth for the foreign-born population - Micronesia (%)
Place of birth for the foreign-born population - Bahamas (%)
Place of birth for the foreign-born population - Barbados (%)
Place of birth for the foreign-born population - Cuba (%)
Place of birth for the foreign-born population - Dominica (%)
Place of birth for the foreign-born population - Dominican Republic (%)
Place of birth for the foreign-born population - Grenada (%)
Place of birth for the foreign-born population - Haiti (%)
Place of birth for the foreign-born population - Jamaica (%)
Place of birth for the foreign-born population - St. Vincent and the Grenadines (%)
Place of birth for the foreign-born population - Trinidad and Tobago (%)
Place of birth for the foreign-born population - West Indies (%)
Place of birth for the foreign-born population - Other Caribbean (%)
Place of birth for the foreign-born population - Belize (%)
Place of birth for the foreign-born population - Costa Rica (%)
Place of birth for the foreign-born population - El Salvador (%)
Place of birth for the foreign-born population - Guatemala (%)
Place of birth for the foreign-born population - Honduras (%)
Place of birth for the foreign-born population - Mexico (%)
Place of birth for the foreign-born population - Nicaragua (%)
Place of birth for the foreign-born population - Panama (%)
Place of birth for the foreign-born population - Other Central America (%)
Place of birth for the foreign-born population - Argentina (%)
Place of birth for the foreign-born population - Bolivia (%)
Place of birth for the foreign-born population - Brazil (%)
Place of birth for the foreign-born population - Chile (%)
Place of birth for the foreign-born population - Colombia (%)
Place of birth for the foreign-born population - Ecuador (%)
Place of birth for the foreign-born population - Guyana (%)
Place of birth for the foreign-born population - Peru (%)
Place of birth for the foreign-born population - Uruguay (%)
Place of birth for the foreign-born population - Venezuela (%)
Place of birth for the foreign-born population - Other South America (%)
Place of birth for the foreign-born population - Canada (%)
Place of birth for the foreign-born population - Other Northern America (%)
Place of birth for the foreign-born population - Other (%)
Latest news about races in Alabaster, AL collected exclusively by city-data.com from local newspapers, TV, and radio stations
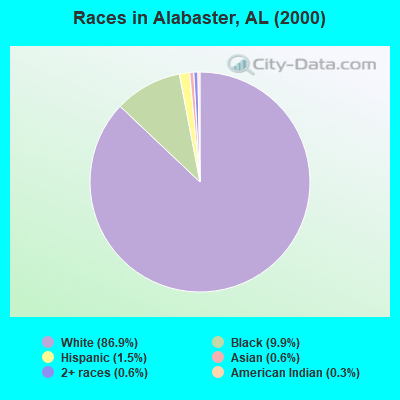
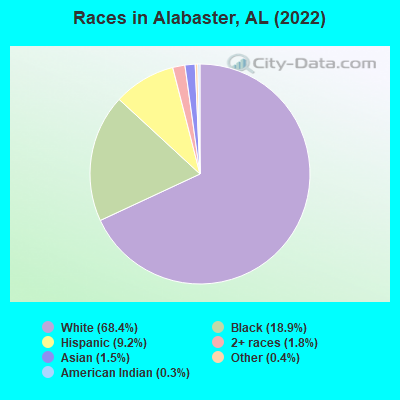
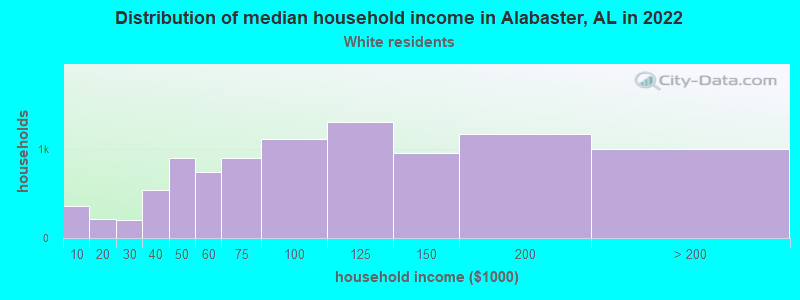
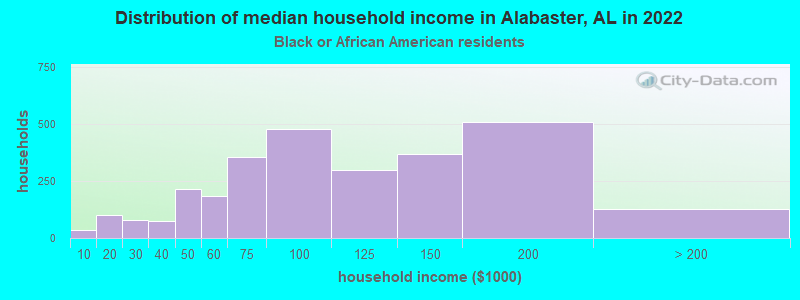
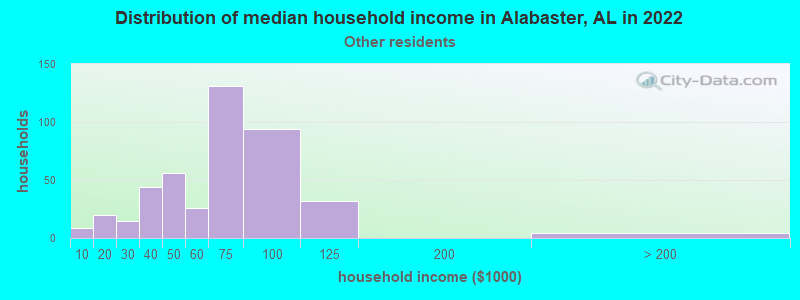
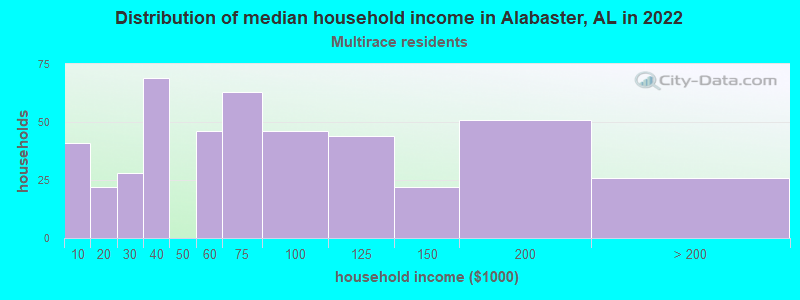
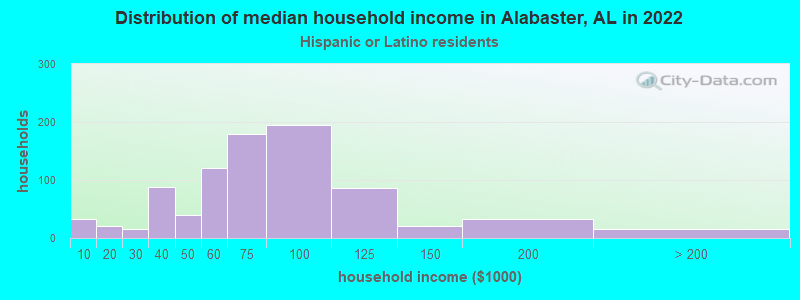
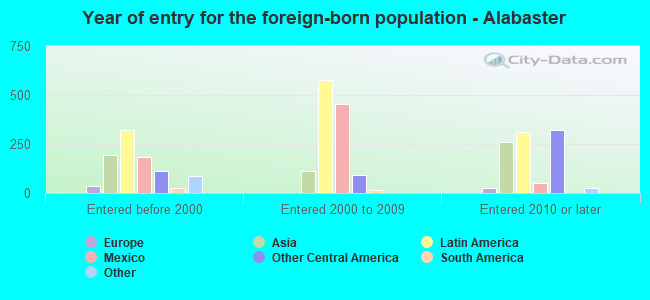
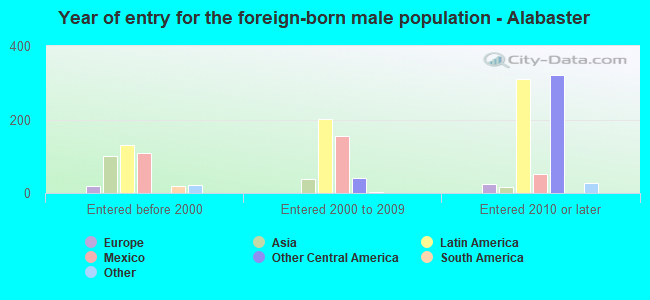
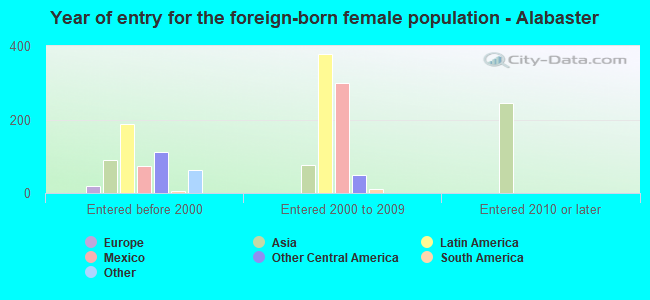
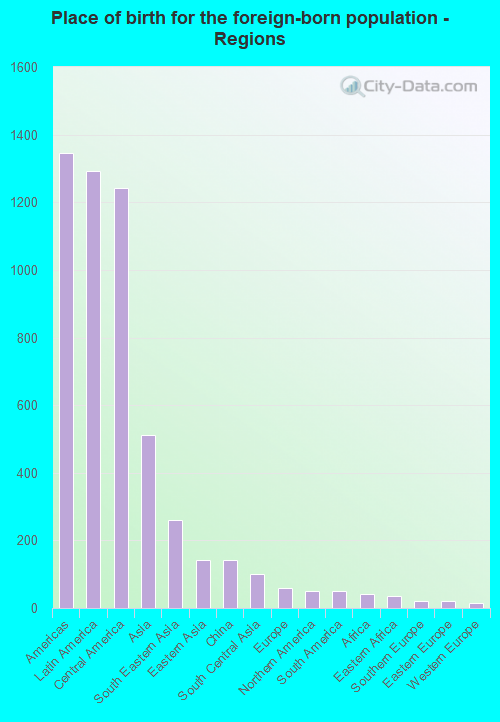
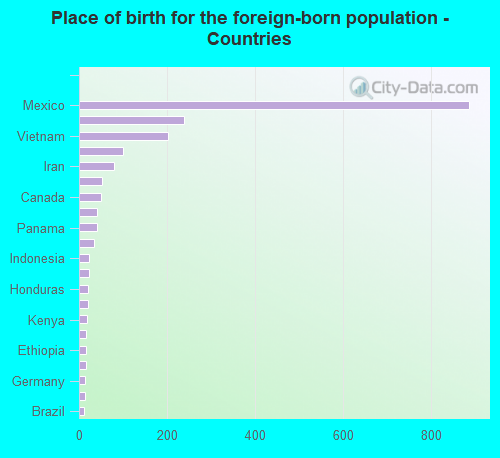
According to 2022 data, the most numerous races in Alabaster, AL are White alone (23,905 residents), Black alone (4,992 residents), and Hispanic (3,861 residents). 90.2% of Alabaster residents speak English at home. 5.6% of Alabaster, AL residents are foreign-born (3.8% born in Latin America, 1.5% born in Asia), which is 46.6% greater than the foreign-born rate of 3.0% across the entire state of Alabama.
Race distribution in Alabaster
2000 2022
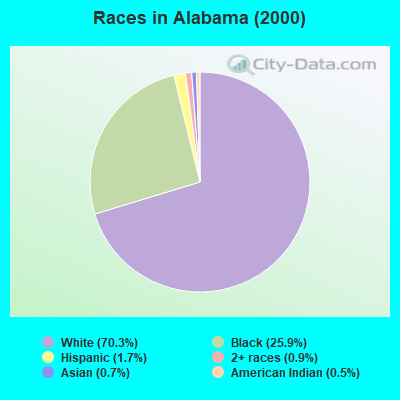
3,125,819 70.3% White alone 1,150,076 25.9% Black alone 75,830 1.7% Hispanic 39,086 0.9% Two or more races 30,989 0.7% Asian alone 21,618 0.5% American Indian alone 2,623 0.06% Other race alone 1,059 0.02% Native Hawaiian and Other
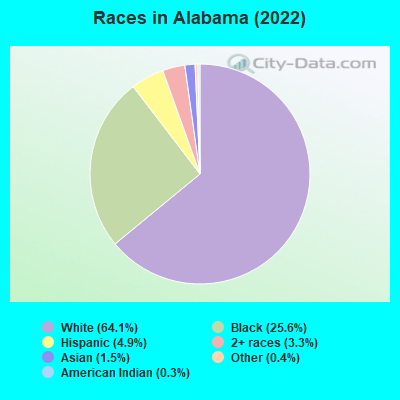
3,250,182 64.1% White alone 1,296,500 25.6% Black alone 246,477 4.9% Hispanic 169,880 3.3% Two or more races 76,682 1.5% Asian alone 19,927 0.4% Other race alone 12,694 0.3% American Indian alone 1,954 0.04% Native Hawaiian and Other
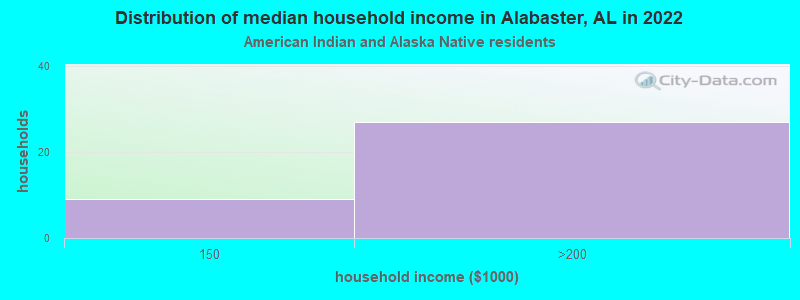
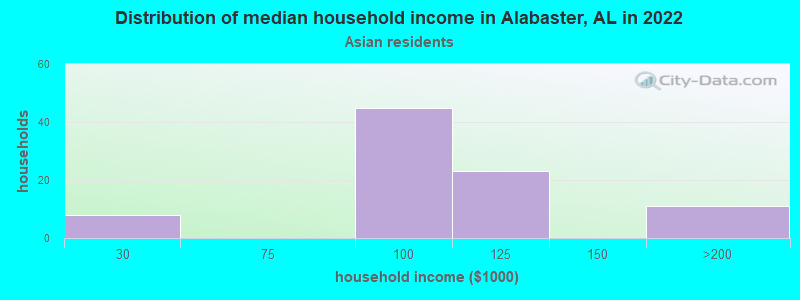
Income and house value in Alabaster Median household income in 2022 $96,794 White non-Hispanic householders$93,501 Black householders$127,063 American Indian and Alaska Native householders$50,923 Asian householders$43,363 Some other race householders$63,409 Two or more races householders$61,963 Hispanic or Latino race householdersMedian 2022 house value $325,316 White Non-Hispanic householders$306,719 Black or African American householders$112,105 American Indian or Alaska Native householders $589,341 Asian householders$258,786 Some other race householders$298,599 Hispanic or Latino householders
Median age by race in Alabaster
40.9 Median age for White residents41.7 39.5 42.1 Median age for Black or African American residents36.6 47.8 22.9 Median age for American Indian / Alaska Native residents28.0 21.1 40.7 Median age for Asian residents55.1 27.8 17.7 Median age for Other race residents13.3 15.6 20.9 Median age for Two or more races residents18.9 27.4 41.0 Median age for White alone residents41.6 40.3 15.7 Median age for Hispanic or Latino residents18.0 16.4
Owner/renter occupied households by race in Alabaster
House owners and renters - White residents 8,424 88.4% Owner occupied1,104 11.6% Renter occupiedHouse owners and renters - Black or African American residents 1,584 74.7% Owner occupied537 25.3% Renter occupiedHouse owners and renters - American Indian / Alaska Native residents 57 100.0% Owner occupiedHouse owners and renters - Asian residents 122 66.7% Owner occupied61 33.3% Renter occupiedHouse owners and renters - Other race residents 290 86.0% Owner occupied47 14.0% Renter occupiedHouse owners and renters - Two or more races residents 617 70.9% Owner occupied253 29.1% Renter occupiedHouse owners and renters - White alone residents 8,197 88.4% Owner occupied1,080 11.6% Renter occupiedHouse owners and renters - Hispanic or Latino residents 773 88.3% Owner occupied102 11.7% Renter occupied
Language usage in Alabaster
English speakers - Total 90.2% of residents of Alabaster speak English at home.
8.2% of residents speak Spanish at home 1,628 61.9% Speak English very well1,002 38.1% Speak English less than very well1.7% of residents speak other language at home 283 53.2% Speak English very well249 46.8% Speak English less than very well
English speakers - Born in the United States 95.2% of residents of Alabaster speak English at home.
3.9% of residents speak Spanish at home 296 77.9% Speak English very well84 22.1% Speak English less than very well0.8% of residents speak other language at home 80 100.0% Speak English very well
English speakers - Native, born elsewhere 71.0% of residents of Alabaster speak English at home.
28.7% of residents speak Spanish at home 97 100.0% Speak English very well
English speakers - Foreign-born 15.1% of residents of Alabaster speak English at home.
63.7% of residents speak Spanish at home 410 32.8% Speak English very well840 67.2% Speak English less than very well20.1% of residents speak other language at home 141 35.8% Speak English very well253 64.2% Speak English less than very well
White (Caucasian) - Speak only English Native:
98.6% (22,988)Foreign-born:
42.9% (183)
White (Caucasian) - Speak another language Native:
1.4% (321)Foreign-born:
60.0% (256)
Black or African American - Speak only English Native:
98.9% (4,683)Foreign-born:
94.8% (19)
Black or African American - Speak another language Native:
1.0% (49)Foreign-born:
16.8% (3)
American Indian / Alaska Native - Speak another language Native:
70.7% (69)Foreign-born:
100.0% (176)
Asian - Speak only English Native:
100.0% (57)Foreign-born:
32.1% (130)
Asian - Speak another language Native:
59.2% (34)Foreign-born:
70.7% (287)
Other race - Speak only English Native:
21.7% (296)Foreign-born:
3.9% (43)
Other race - Speak another language Native:
70.3% (958)Foreign-born:
95.5% (1,068)
Two or more races - Speak only English Native:
84.4% (1,275)Foreign-born:
25.2% (38)
Two or more races - Speak another language Native:
17.6% (265)Foreign-born:
54.0% (81)
White alone - Speak only English Native:
99.2% (22,752)Foreign-born:
70.1% (179)
White alone - Speak another language Native:
0.8% (191)Foreign-born:
34.2% (88)
Hispanic or Latino - Speak only English Native:
46.2% (925)Foreign-born:
5.9% (73)
Hispanic or Latino - Speak another language Native:
50.4% (1,008)Foreign-born:
93.6% (1,156)
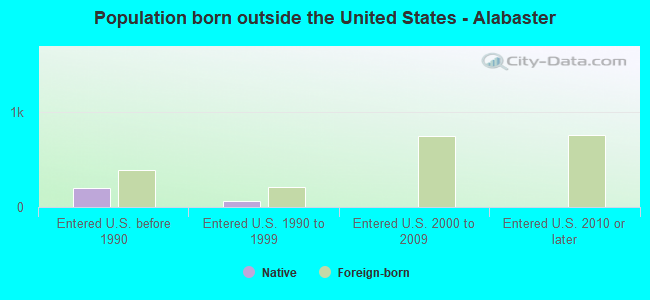
Foreign-born residents in Alabaster 1,959 residents are foreign born (3.8% Latin America , 1.5% Asia ).
This city:
5.6%Alabama:
100.0%
Marital status for residents in Alabaster Marital status - White (Caucasian) population 15 years and over
Males 24.0% Never married64.7% Now married0.7% Separated2.4% Widowed8.1% DivorcedFemales 21.7% Never married60.1% Now married0.7% Separated8.1% Widowed9.4% DivorcedWomen who gave birth in the past 12 months Now married:
100.0% (246)Unmarried:
0.0% (0)
Women who did not give birth in the past 12 months Now married:
57.9% (3,515)Unmarried:
42.1% (2,553)
Marital status - Black or African American population 15 years and over
Males 42.2% Never married50.3% Now married1.5% Separated1.1% Widowed4.9% DivorcedFemales 31.7% Never married44.9% Now married1.8% Separated15.1% Widowed6.5% DivorcedWomen who gave birth in the past 12 months Now married:
100.0% (48)Unmarried:
0.0% (0)
Women who did not give birth in the past 12 months Now married:
44.4% (557)Unmarried:
55.6% (697)
Marital status - American Indian / Alaska Native population 15 years and over
Males 37.8% Never married62.2% Now married0.0% Separated0.0% Widowed0.0% DivorcedFemales 13.2% Never married86.8% Now married0.0% Separated0.0% Widowed0.0% DivorcedWomen who gave birth in the past 12 months Now married:
100.0% (17)Unmarried:
0.0% (0)
Women who did not give birth in the past 12 months Now married:
64.3% (19)Unmarried:
35.7% (10)
Marital status - Asian population 15 years and over
Males 0.0% Never married100.0% Now married0.0% Separated0.0% Widowed0.0% DivorcedFemales 15.7% Never married63.4% Now married0.0% Separated0.0% Widowed20.8% DivorcedWomen who gave birth in the past 12 months Now married:
100.0% (13)Unmarried:
0.0% (0)
Women who did not give birth in the past 12 months Now married:
69.4% (131)Unmarried:
30.6% (58)
Marital status - Other race population 15 years and over
Males 59.8% Never married36.5% Now married0.6% Separated0.0% Widowed3.1% DivorcedFemales 38.5% Never married44.3% Now married5.9% Separated4.1% Widowed7.2% DivorcedWomen who gave birth in the past 12 months Now married:
100.0% (95)Unmarried:
0.0% (0)
Women who did not give birth in the past 12 months Now married:
43.1% (251)Unmarried:
56.9% (332)
Marital status - Two or more races population 15 years and over
Males 26.5% Never married66.0% Now married0.0% Separated0.0% Widowed7.4% DivorcedFemales 37.0% Never married42.0% Now married8.0% Separated8.4% Widowed4.6% DivorcedWomen who gave birth in the past 12 months Now married:
63.2% (24)Unmarried:
36.8% (14)
Women who did not give birth in the past 12 months Now married:
36.8% (116)Unmarried:
63.2% (199)
Marital status - White alone, not Hispanic / Latino population 15 years and over
Males 24.0% Never married64.5% Now married0.7% Separated2.5% Widowed8.3% DivorcedFemales 21.7% Never married60.1% Now married0.7% Separated8.2% Widowed9.4% DivorcedWomen who gave birth in the past 12 months Now married:
100.0% (205)Unmarried:
0.0% (0)
Women who did not give birth in the past 12 months Now married:
57.9% (3,434)Unmarried:
42.1% (2,501)
Marital status - Hispanic or Latino population 15 years and over
Males 52.7% Never married45.5% Now married0.5% Separated0.0% Widowed1.3% DivorcedFemales 33.8% Never married50.3% Now married3.6% Separated4.3% Widowed8.0% DivorcedWomen who gave birth in the past 12 months Now married:
95.1% (158)Unmarried:
4.9% (8)
Women who did not give birth in the past 12 months Now married:
48.3% (354)Unmarried:
51.7% (378)
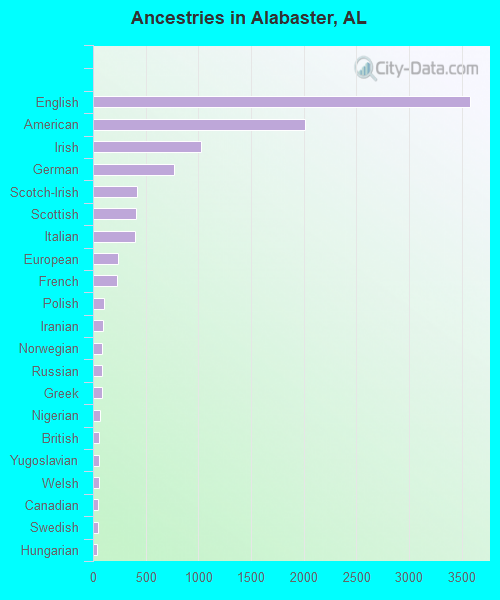
Ancestries in Alabaster
3,221 18.0% American2,627 14.7% English951 5.3% Irish758 4.2% European716 4.0% German501 2.8% Italian259 1.4% French247 1.4% Scottish236 1.3% Scotch-Irish173 1.0% Polish99 0.6% British90 0.5% African79 0.4% Russian77 0.4% Norwegian68 0.4% Scandinavian56 0.3% Swedish53 0.3% Welsh49 0.3% French Canadian46 0.3% Iranian34 0.2% Northern European30 0.2% Canadian25 0.1% Greek16 0.09% Danish14 0.08% Slavic13 0.07% Eastern European13 0.07% Ethiopian10 0.06% Dutch10 0.06% Cajun9 0.05% Lithuanian8 0.04% Lebanese6 0.03% Romanian4 0.02% Arab3 0.02% Czech2 0.01% Guyanese
Geographical mobility in Alabaster Same house 1 year ago 21,889 88.5% White (Caucasian)4,032 81.8% Black or African American109 46.7% American Indian / Alaska Native456 81.3% Asian6 74.4% Native Hawaiian / Pacific Islander3,058 99.9% Other race1,716 97.9% Two or more races21,512 90.3% White alone, not Hispanic / Latino3,177 89.9% Hispanic or LatinoMoved within same county 1,543 6.2% White / Caucasian241 4.9% Black or African American85 36.2% American Indian / Alaska Native112 20.0% Asian50 2.8% Two or more races1,190 5.0% White alone, not Hispanic / Latino212 6.0% Hispanic or LatinoMoved within same state 574 2.3% White / Caucasian380 7.7% Black or African American600 2.5% White alone, not Hispanic / Latino1 0.0% Hispanic or LatinoMoved from different state 753 3.0% White / Caucasian252 5.1% Black or African American82 2.7% Other race37 2.1% Two or more races546 2.3% White alone, not Hispanic / Latino97 2.7% Hispanic or LatinoMoved from abroad 26 0.8% Other race17 0.5% Hispanic or Latino
Children Nativity (place of birth) in Alabaster
Children under 6 years - Living with two parents Both parents native 1,248 100.0% Native0 0.0% Foreign-bornBoth parents foreign-born 576 92.3% Native48 7.7% Foreign-bornOne native, one foreign-born parent 173 100.0% NativeChildren under 6 years - Living with one parent Native parent 292 100.0% NativeForeign-born parent 29 100.0% NativeChildren 6 to 17 years - Living with two parents Both parents native 3,567 99.2% Native29 0.8% Foreign-bornBoth parents foreign-born 287 64.1% Native161 35.9% Foreign-bornOne native, one foreign-born parent 273 100.0% NativeChildren 6 to 17 years - Living with one parent Native parent 1,169 100.0% NativeForeign-born parent 358 52.3% Native326 47.7% Foreign-born
Grandparents responsible for own grandchildren in Alabaster
Grandparents (30 to 59 years) White / Caucasian 105 46.0% Responsible for grandchildren123 54.0% Not responsible for grandchildrenBlack or African American 9 39.5% Responsible for grandchildren13 60.5% Not responsible for grandchildrenAmerican Indian / Alaska Native 4 100.0% Responsible for grandchildrenOther race 16 100.0% Responsible for grandchildrenWhite alone, not Hispanic / Latino 101 45.2% Responsible for grandchildren123 54.8% Not responsible for grandchildrenHispanic or Latino 9 100.0% Not responsible for grandchildrenGrandparents (60 years and over) White / Caucasian 33 15.6% Responsible for grandchildren179 84.4% Not responsible for grandchildrenBlack or African American 30 19.6% Responsible for grandchildren122 80.4% Not responsible for grandchildrenWhite alone, not Hispanic / Latino 33 16.5% Responsible for grandchildren169 83.5% Not responsible for grandchildrenHispanic or Latino 20 100.0% Not responsible for grandchildren