Races in Anna, Texas (TX) Detailed Stats
Data:
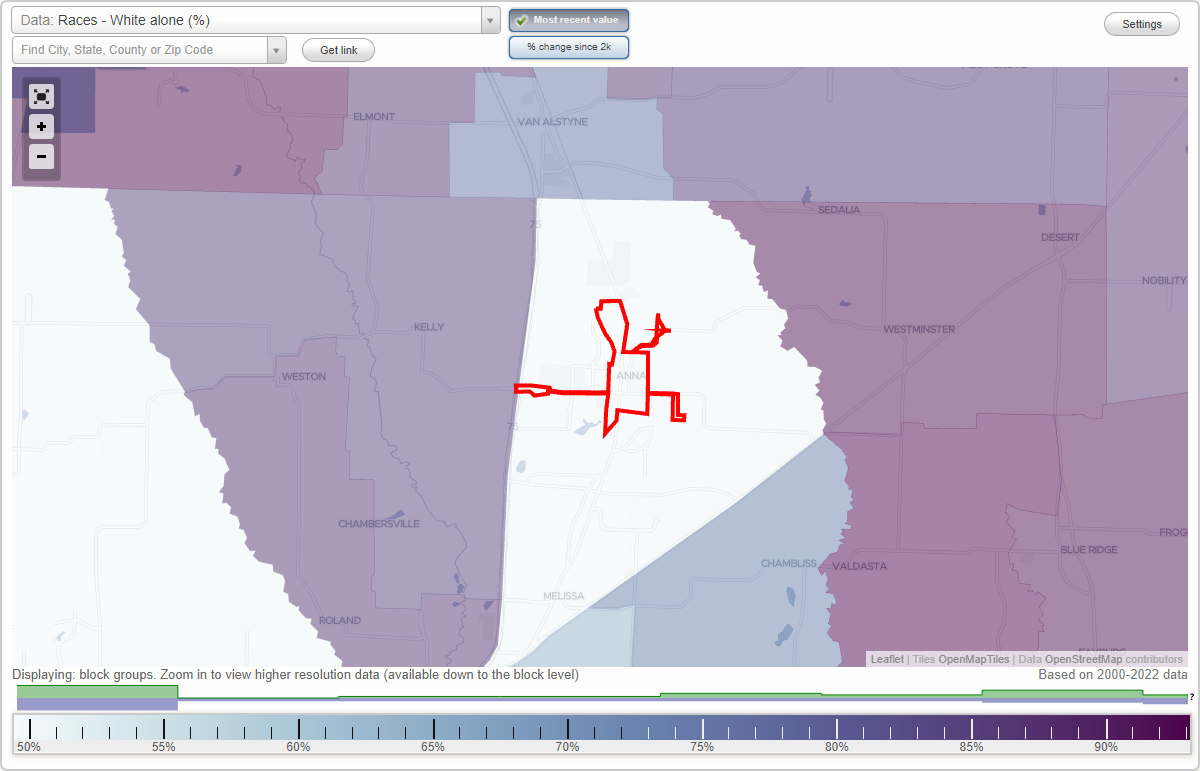
Races - White alone (%)
Races - White alone (% change since 2000)
Races - Black alone (%)
Races - Black alone (% change since 2000)
Races - American Indian alone (%)
Races - American Indian alone (% change since 2000)
Races - Asian alone (%)
Races - Asian alone (% change since 2000)
Races - Hispanic (%)
Races - Hispanic (% change since 2000)
Races - Native Hawaiian and Other Pacific Islander alone (%)
Races - Native Hawaiian and Other Pacific Islander alone (% change since 2000)
Races - Two or more races(%)
Races - Two or more races(% change since 2000)
Races - Other race alone (%)
Races - Other race alone (% change since 2000)
Racial diversity
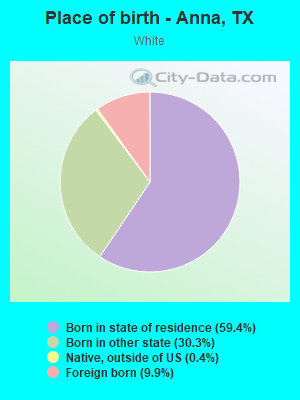
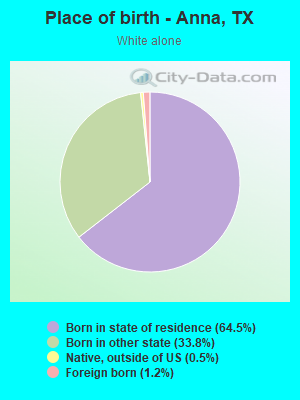
Place of birth - Born in state of residence (%)
Place of birth - Born in state of residence (%) - White
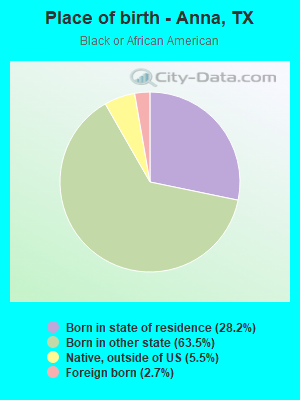
Place of birth - Born in state of residence (%) - Black or African American
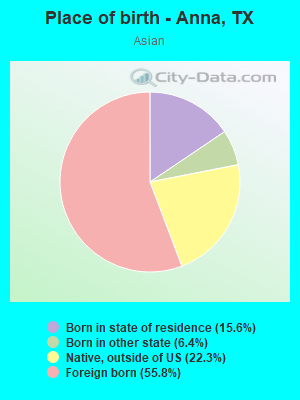
Place of birth - Born in state of residence (%) - Asian
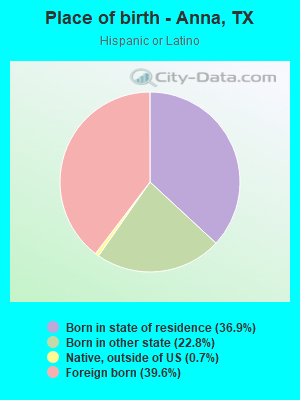
Place of birth - Born in state of residence (%) - Hispanic or Latino
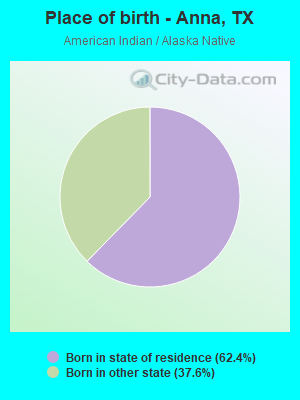
Place of birth - Born in state of residence (%) - American Indian and Alaska Native
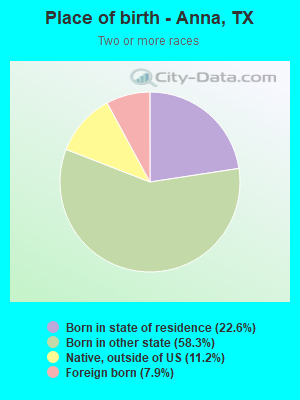
Place of birth - Born in state of residence (%) - Multirace
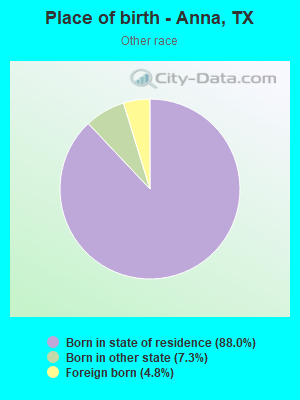
Place of birth - Born in state of residence (%) - Other Race
Place of birth - Born in other state (%)
Place of birth - Born in other state (%) - White
Place of birth - Born in other state (%) - Black or African American
Place of birth - Born in other state (%) - Asian
Place of birth - Born in other state (%) - Hispanic or Latino
Place of birth - Born in other state (%) - American Indian and Alaska Native
Place of birth - Born in other state (%) - Multirace
Place of birth - Born in other state (%) - Other Race
Place of birth - Native, outside of US (%)
Place of birth - Native, outside of US (%) - White
Place of birth - Native, outside of US (%) - Black or African American
Place of birth - Native, outside of US (%) - Asian
Place of birth - Native, outside of US (%) - Hispanic or Latino
Place of birth - Native, outside of US (%) - American Indian and Alaska Native
Place of birth - Native, outside of US (%) - Multirace
Place of birth - Native, outside of US (%) - Other Race
Place of birth - Foreign born (%)
Place of birth - Foreign born (%) - White
Place of birth - Foreign born (%) - Black or African American
Place of birth - Foreign born (%) - Asian
Place of birth - Foreign born (%) - Hispanic or Latino
Place of birth - Foreign born (%) - American Indian and Alaska Native
Place of birth - Foreign born (%) - Multirace
Place of birth - Foreign born (%) - Other Race
Residents speaking English at home (%)
Residents speaking English at home - Born in the United States (%)
Residents speaking English at home - Native, born elsewhere (%)
Residents speaking English at home - Foreign born (%)
Residents speaking Spanish at home (%)
Residents speaking Spanish at home - Born in the United States (%)
Residents speaking Spanish at home - Native, born elsewhere (%)
Residents speaking Spanish at home - Foreign born (%)
Residents speaking other language at home (%)
Residents speaking other language at home - Born in the United States (%)
Residents speaking other language at home - Native, born elsewhere (%)
Residents speaking other language at home - Foreign born (%)
Marital status - Never married (%)
Marital status - Now married (%)
Marital status - Separated (%)
Marital status - Widowed (%)
Marital status - Divorced (%)
Ancestries Reported - Arab (%)
Ancestries Reported - Czech (%)
Ancestries Reported - Danish (%)
Ancestries Reported - Dutch (%)
Ancestries Reported - English (%)
Ancestries Reported - French (%)
Ancestries Reported - French Canadian (%)
Ancestries Reported - German (%)
Ancestries Reported - Greek (%)
Ancestries Reported - Hungarian (%)
Ancestries Reported - Irish (%)
Ancestries Reported - Italian (%)
Ancestries Reported - Lithuanian (%)
Ancestries Reported - Norwegian (%)
Ancestries Reported - Polish (%)
Ancestries Reported - Portuguese (%)
Ancestries Reported - Russian (%)
Ancestries Reported - Scotch-Irish (%)
Ancestries Reported - Scottish (%)
Ancestries Reported - Slovak (%)
Ancestries Reported - Subsaharan African (%)
Ancestries Reported - Swedish (%)
Ancestries Reported - Swiss (%)
Ancestries Reported - Ukrainian (%)
Ancestries Reported - United States (%)
Ancestries Reported - Welsh (%)
Ancestries Reported - West Indian (%)
Ancestries Reported - Other (%)
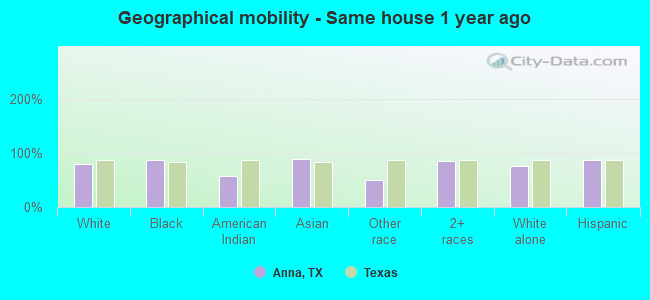
Geographical mobility - Same house 1 year ago (%)
Geographical mobility - Same house 1 year ago (%) - White
Geographical mobility - Same house 1 year ago (%) - Black or African American
Geographical mobility - Same house 1 year ago (%) - Asian
Geographical mobility - Same house 1 year ago (%) - Hispanic or Latino
Geographical mobility - Same house 1 year ago (%) - American Indian and Alaska Native
Geographical mobility - Same house 1 year ago (%) - Multirace
Geographical mobility - Same house 1 year ago (%) - Other Race
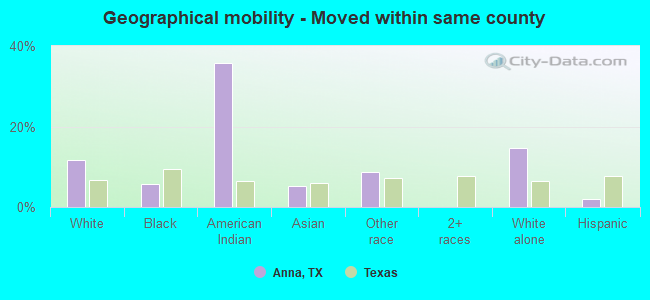
Geographical mobility - Moved within same county (%)
Geographical mobility - Moved within same county (%) - White
Geographical mobility - Moved within same county (%) - Black or African American
Geographical mobility - Moved within same county (%) - Asian
Geographical mobility - Moved within same county (%) - Hispanic or Latino
Geographical mobility - Moved within same county (%) - American Indian and Alaska Native
Geographical mobility - Moved within same county (%) - Multirace
Geographical mobility - Moved within same county (%) - Other Race
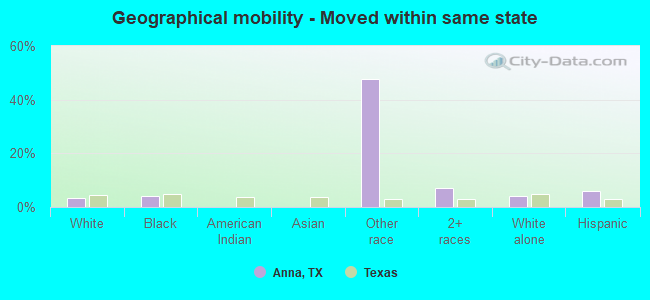
Geographical mobility - Moved from different county within same state (%)
Geographical mobility - Moved from different county within same state (%) - White
Geographical mobility - Moved from different county within same state (%) - Black or African American
Geographical mobility - Moved from different county within same state (%) - Asian
Geographical mobility - Moved from different county within same state (%) - Hispanic or Latino
Geographical mobility - Moved from different county within same state (%) - American Indian and Alaska Native
Geographical mobility - Moved from different county within same state (%) - Multirace
Geographical mobility - Moved from different county within same state (%) - Other Race
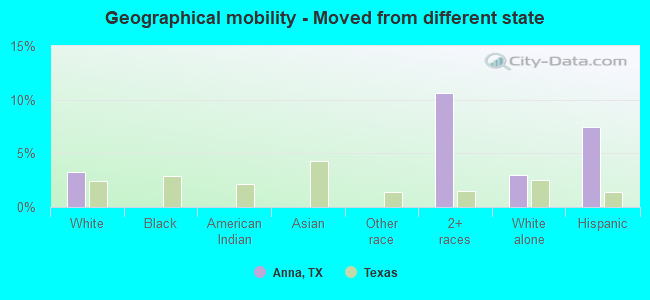
Geographical mobility - Moved from different state (%)
Geographical mobility - Moved from different state (%) - White
Geographical mobility - Moved from different state (%) - Black or African American
Geographical mobility - Moved from different state (%) - Asian
Geographical mobility - Moved from different state (%) - Hispanic or Latino
Geographical mobility - Moved from different state (%) - American Indian and Alaska Native
Geographical mobility - Moved from different state (%) - Multirace
Geographical mobility - Moved from different state (%) - Other Race
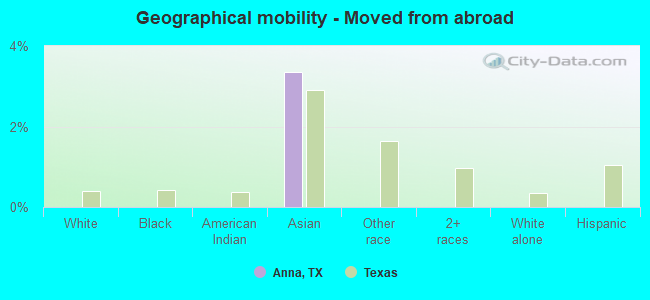
Geographical mobility - Moved from abroad (%)
Geographical mobility - Moved from abroad (%) - White
Geographical mobility - Moved from abroad (%) - Black or African American
Geographical mobility - Moved from abroad (%) - Asian
Geographical mobility - Moved from abroad (%) - Hispanic or Latino
Geographical mobility - Moved from abroad (%) - American Indian and Alaska Native
Geographical mobility - Moved from abroad (%) - Multirace
Geographical mobility - Moved from abroad (%) - Other Race
Place of birth for the foreign-born population - Ireland (%)
Place of birth for the foreign-born population - Denmark (%)
Place of birth for the foreign-born population - Norway (%)
Place of birth for the foreign-born population - Sweden (%)
Place of birth for the foreign-born population - United Kingdom (%)
Place of birth for the foreign-born population - England (%)
Place of birth for the foreign-born population - Scotland (%)
Place of birth for the foreign-born population - Other Northern Europe (%)
Place of birth for the foreign-born population - Austria (%)
Place of birth for the foreign-born population - Belgium (%)
Place of birth for the foreign-born population - France (%)
Place of birth for the foreign-born population - Germany (%)
Place of birth for the foreign-born population - Netherlands (%)
Place of birth for the foreign-born population - Switzerland (%)
Place of birth for the foreign-born population - Other Western Europe (%)
Place of birth for the foreign-born population - Greece (%)
Place of birth for the foreign-born population - Italy (%)
Place of birth for the foreign-born population - Portugal (%)
Place of birth for the foreign-born population - Spain (%)
Place of birth for the foreign-born population - Other Southern Europe (%)
Place of birth for the foreign-born population - Albania (%)
Place of birth for the foreign-born population - Belarus (%)
Place of birth for the foreign-born population - Bosnia and Herzegovina (%)
Place of birth for the foreign-born population - Bulgaria (%)
Place of birth for the foreign-born population - Croatia (%)
Place of birth for the foreign-born population - Czechoslovakia (%)
Place of birth for the foreign-born population - Hungary (%)
Place of birth for the foreign-born population - Latvia (%)
Place of birth for the foreign-born population - Lithuania (%)
Place of birth for the foreign-born population - North Macedonia (Macedonia) (%)
Place of birth for the foreign-born population - Moldova (%)
Place of birth for the foreign-born population - Poland (%)
Place of birth for the foreign-born population - Romania (%)
Place of birth for the foreign-born population - Russia (%)
Place of birth for the foreign-born population - Serbia (%)
Place of birth for the foreign-born population - Ukraine (%)
Place of birth for the foreign-born population - Other Eastern Europe (%)
Place of birth for the foreign-born population - China (%)
Place of birth for the foreign-born population - Hong Kong (%)
Place of birth for the foreign-born population - Taiwan (%)
Place of birth for the foreign-born population - Japan (%)
Place of birth for the foreign-born population - Korea (%)
Place of birth for the foreign-born population - Other Eastern Asia (%)
Place of birth for the foreign-born population - Afghanistan (%)
Place of birth for the foreign-born population - Bangladesh (%)
Place of birth for the foreign-born population - India (%)
Place of birth for the foreign-born population - Iran (%)
Place of birth for the foreign-born population - Kazakhstan (%)
Place of birth for the foreign-born population - Nepal (%)
Place of birth for the foreign-born population - Pakistan (%)
Place of birth for the foreign-born population - Sri Lanka (%)
Place of birth for the foreign-born population - Uzbekistan (%)
Place of birth for the foreign-born population - Other South Central Asia (%)
Place of birth for the foreign-born population - Burma (%)
Place of birth for the foreign-born population - Cambodia (%)
Place of birth for the foreign-born population - Indonesia (%)
Place of birth for the foreign-born population - Laos (%)
Place of birth for the foreign-born population - Malaysia (%)
Place of birth for the foreign-born population - Philippines (%)
Place of birth for the foreign-born population - Singapore (%)
Place of birth for the foreign-born population - Thailand (%)
Place of birth for the foreign-born population - Vietnam (%)
Place of birth for the foreign-born population - Other South Eastern Asia (%)
Place of birth for the foreign-born population - Armenia (%)
Place of birth for the foreign-born population - Iraq (%)
Place of birth for the foreign-born population - Israel (%)
Place of birth for the foreign-born population - Jordan (%)
Place of birth for the foreign-born population - Kuwait (%)
Place of birth for the foreign-born population - Lebanon (%)
Place of birth for the foreign-born population - Saudi Arabia (%)
Place of birth for the foreign-born population - Syria (%)
Place of birth for the foreign-born population - Turkey (%)
Place of birth for the foreign-born population - Yemen (%)
Place of birth for the foreign-born population - Other Western Asia (%)
Place of birth for the foreign-born population - Eritrea (%)
Place of birth for the foreign-born population - Ethiopia (%)
Place of birth for the foreign-born population - Kenya (%)
Place of birth for the foreign-born population - Somalia (%)
Place of birth for the foreign-born population - Uganda (%)
Place of birth for the foreign-born population - Zimbabwe (%)
Place of birth for the foreign-born population - Other Eastern Africa (%)
Place of birth for the foreign-born population - Cameroon (%)
Place of birth for the foreign-born population - Congo (%)
Place of birth for the foreign-born population - Democratic Republic of Congo (Zaire) (%)
Place of birth for the foreign-born population - Other Middle Africa (%)
Place of birth for the foreign-born population - Egypt (%)
Place of birth for the foreign-born population - Morocco (%)
Place of birth for the foreign-born population - Sudan (%)
Place of birth for the foreign-born population - Other Northern Africa (%)
Place of birth for the foreign-born population - South Africa (%)
Place of birth for the foreign-born population - Other Southern Africa (%)
Place of birth for the foreign-born population - Cabo Verde (%)
Place of birth for the foreign-born population - Ghana (%)
Place of birth for the foreign-born population - Liberia (%)
Place of birth for the foreign-born population - Nigeria (%)
Place of birth for the foreign-born population - Senegal (%)
Place of birth for the foreign-born population - Sierra Leone (%)
Place of birth for the foreign-born population - Other Western Africa (%)
Place of birth for the foreign-born population - Australia (%)
Place of birth for the foreign-born population - New Zealand (%)
Place of birth for the foreign-born population - Fiji (%)
Place of birth for the foreign-born population - Micronesia (%)
Place of birth for the foreign-born population - Bahamas (%)
Place of birth for the foreign-born population - Barbados (%)
Place of birth for the foreign-born population - Cuba (%)
Place of birth for the foreign-born population - Dominica (%)
Place of birth for the foreign-born population - Dominican Republic (%)
Place of birth for the foreign-born population - Grenada (%)
Place of birth for the foreign-born population - Haiti (%)
Place of birth for the foreign-born population - Jamaica (%)
Place of birth for the foreign-born population - St. Vincent and the Grenadines (%)
Place of birth for the foreign-born population - Trinidad and Tobago (%)
Place of birth for the foreign-born population - West Indies (%)
Place of birth for the foreign-born population - Other Caribbean (%)
Place of birth for the foreign-born population - Belize (%)
Place of birth for the foreign-born population - Costa Rica (%)
Place of birth for the foreign-born population - El Salvador (%)
Place of birth for the foreign-born population - Guatemala (%)
Place of birth for the foreign-born population - Honduras (%)
Place of birth for the foreign-born population - Mexico (%)
Place of birth for the foreign-born population - Nicaragua (%)
Place of birth for the foreign-born population - Panama (%)
Place of birth for the foreign-born population - Other Central America (%)
Place of birth for the foreign-born population - Argentina (%)
Place of birth for the foreign-born population - Bolivia (%)
Place of birth for the foreign-born population - Brazil (%)
Place of birth for the foreign-born population - Chile (%)
Place of birth for the foreign-born population - Colombia (%)
Place of birth for the foreign-born population - Ecuador (%)
Place of birth for the foreign-born population - Guyana (%)
Place of birth for the foreign-born population - Peru (%)
Place of birth for the foreign-born population - Uruguay (%)
Place of birth for the foreign-born population - Venezuela (%)
Place of birth for the foreign-born population - Other South America (%)
Place of birth for the foreign-born population - Canada (%)
Place of birth for the foreign-born population - Other Northern America (%)
Place of birth for the foreign-born population - Other (%)
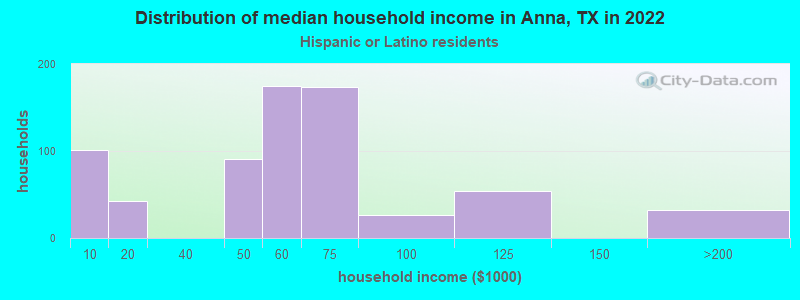
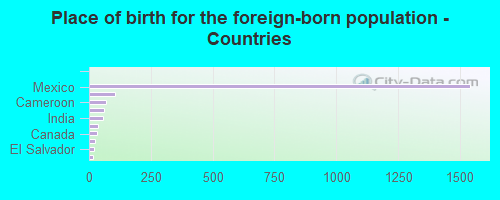
According to 2022 data, the most numerous races in Anna, TX are Hispanic (4,006 residents), White alone (11,408 residents), and Black alone (3,546 residents). 77.5% of Anna residents speak English at home. 9.8% of Anna, TX residents are foreign-born (8.1% born in Latin America), which is 73.0% less than the foreign-born rate of 17.0% across the entire state of Texas.
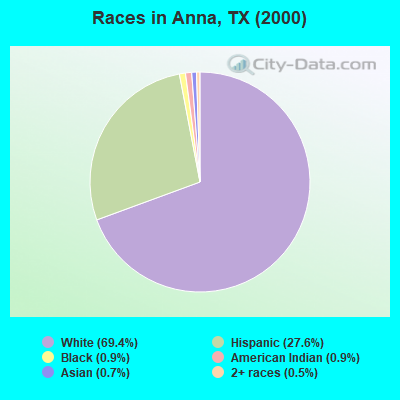
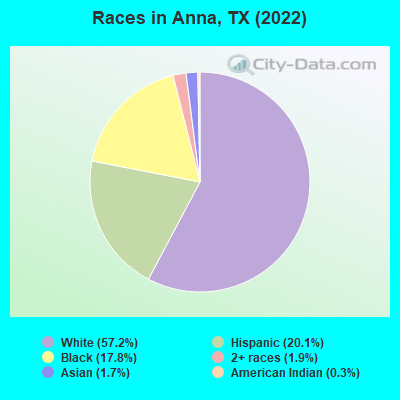
Race distribution in Anna
2000 2022
10,933,313 52.4% White alone 6,669,666 32.0% Hispanic 2,364,255 11.3% Black alone 554,445 2.7% Asian alone 230,567 1.1% Two or more races 68,859 0.3% American Indian alone 19,958 0.10% Other race alone 10,757 0.05% Native Hawaiian and Other
12,070,642 40.2% Hispanic 11,683,430 38.9% White alone 3,508,706 11.7% Black alone 1,608,173 5.4% Asian alone 956,560 3.2% Two or more races 125,763 0.4% Other race alone 47,023 0.2% American Indian alone 29,275 0.10% Native Hawaiian and Other
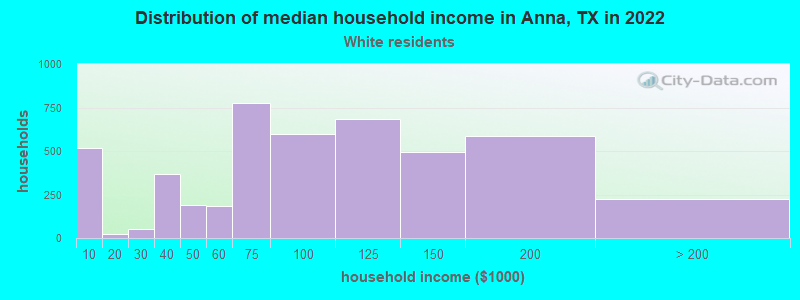
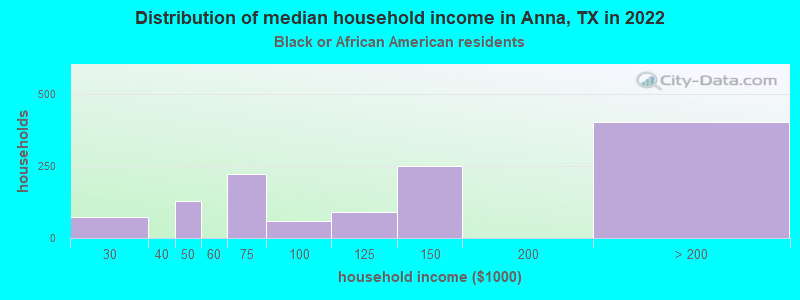
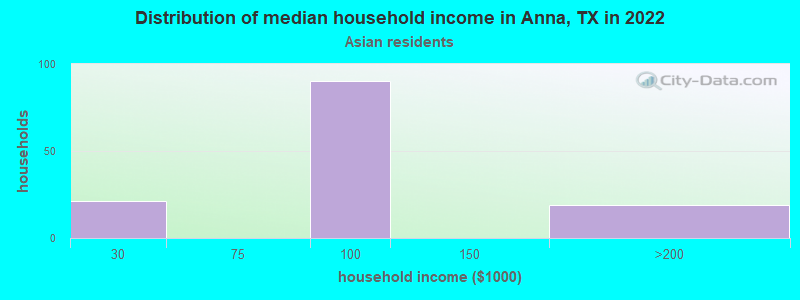
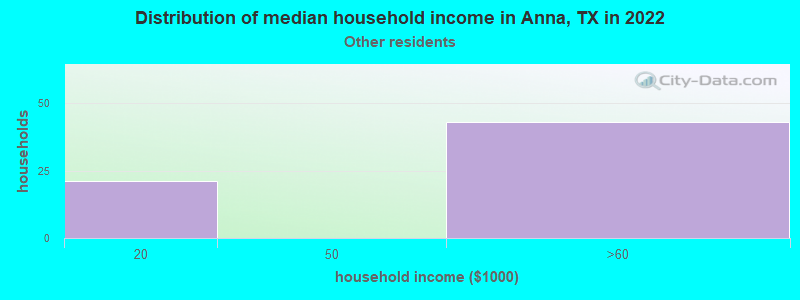
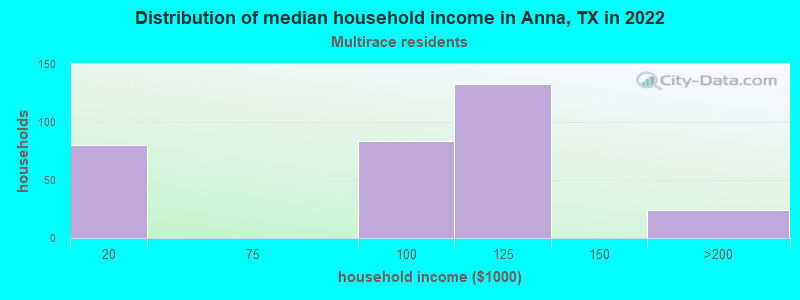
Income and house value in Anna Median household income in 2022 $96,836 White non-Hispanic householders$128,690 Black householders$88,241 Asian householders$105,666 Two or more races householders$51,761 Hispanic or Latino race householdersMedian 2022 house value $320,624 White Non-Hispanic householders$272,555 American Indian or Alaska Native householders$346,889 Some other race householders$446,000 Two or more races householders$346,889 Hispanic or Latino householders
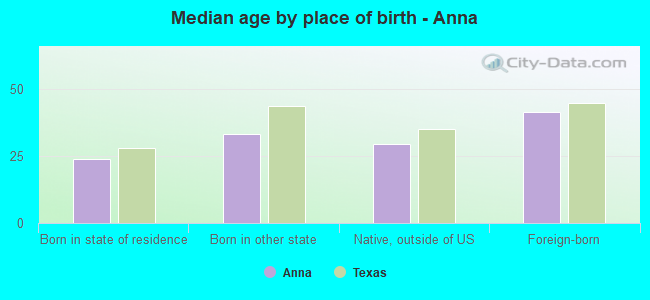
Median age by race in Anna
33.2 Median age for White residents33.1 33.1 37.4 Median age for Black or African American residents38.7 35.4 35.3 Median age for American Indian / Alaska Native residents-724,137,930.3 31.5 37.1 Median age for Asian residents37.9 36.3 -819,226,749.4 Median age for Native Hawaiian / Pacific Islander residents-770,894,787.8 -577,777,777.2 17.6 Median age for Other race residents17.9 34.3 30.3 Median age for Two or more races residents31.1 29.5 32.6 Median age for White alone residents33.0 31.6 28.5 Median age for Hispanic or Latino residents25.1 28.5
Owner/renter occupied households by race in Anna
House owners and renters - White residents 3,531 74.8% Owner occupied1,191 25.2% Renter occupiedHouse owners and renters - Black or African American residents 1,206 97.7% Owner occupied29 2.3% Renter occupiedHouse owners and renters - American Indian / Alaska Native residents 8 100.0% Owner occupiedHouse owners and renters - Asian residents 145 100.0% Owner occupiedHouse owners and renters - Other race residents 60 100.0% Owner occupiedHouse owners and renters - Two or more races residents 370 100.0% Owner occupiedHouse owners and renters - White alone residents 3,101 74.0% Owner occupied1,092 26.0% Renter occupiedHouse owners and renters - Hispanic or Latino residents 715 83.7% Owner occupied139 16.3% Renter occupied
Language usage in Anna
English speakers - Total 77.5% of residents of Anna speak English at home.
18.2% of residents speak Spanish at home 2,594 77.3% Speak English very well762 22.7% Speak English less than very well3.1% of residents speak other language at home 472 82.1% Speak English very well103 17.9% Speak English less than very well
English speakers - Born in the United States 89.7% of residents of Anna speak English at home.
7.8% of residents speak Spanish at home 542 100.0% Speak English very well1.1% of residents speak other language at home 76 100.0% Speak English very well
English speakers - Native, born elsewhere 65.1% of residents of Anna speak English at home.
6.7% of residents speak Spanish at home 29 100.0% Speak English very well20.9% of residents speak other language at home 91 100.0% Speak English very well
English speakers - Foreign-born 11.1% of residents of Anna speak English at home.
77.5% of residents speak Spanish at home 885 54.8% Speak English very well731 45.2% Speak English less than very well9.5% of residents speak other language at home 96 48.5% Speak English very well102 51.5% Speak English less than very well
White (Caucasian) - Speak only English Native:
90.5% (10,179)Foreign-born:
9.7% (131)
White (Caucasian) - Speak another language Native:
9.0% (1,013)Foreign-born:
88.5% (1,196)
Black or African American - Speak another language Native:
4.8% (155)Foreign-born:
100.0% (101)
Asian - Speak only English Native:
58.2% (86)Foreign-born:
52.6% (93)
Asian - Speak another language Native:
41.1% (61)Foreign-born:
53.0% (93)
Other race - Speak another language Native:
51.9% (238)Foreign-born:
100.0% (21)
Two or more races - Speak another language Native:
58.6% (524)Foreign-born:
100.0% (99)
White alone - Speak only English Native:
96.8% (10,077)Foreign-born:
93.2% (127)
Hispanic or Latino - Speak another language Native:
70.7% (1,535)Foreign-born:
98.9% (1,591)
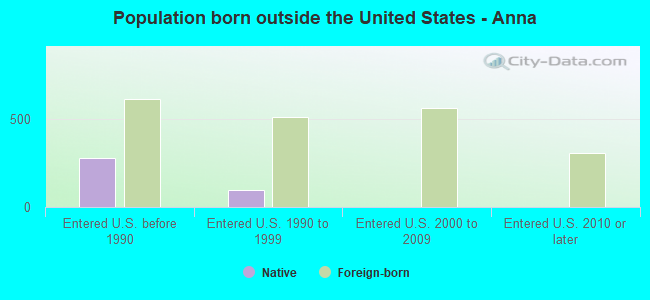
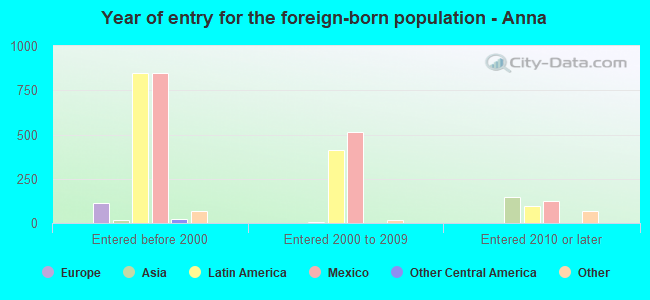
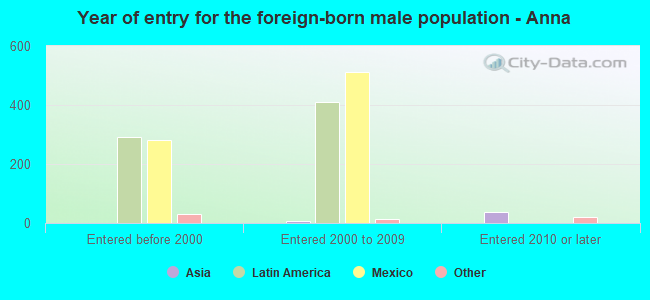
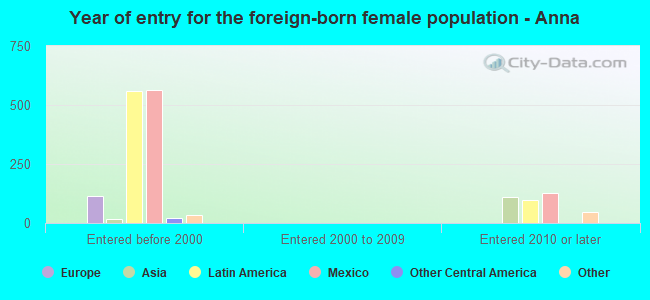
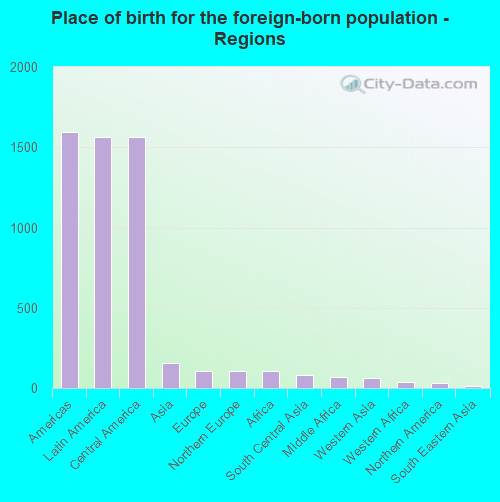
Foreign-born residents in Anna 1,961 residents are foreign born (8.1% Latin America ).
This city:
9.8%Texas:
17.1%
Marital status for residents in Anna Marital status - White (Caucasian) population 15 years and over
Males 25.6% Never married69.3% Now married0.0% Separated0.8% Widowed4.3% DivorcedFemales 23.3% Never married58.1% Now married0.0% Separated5.6% Widowed13.0% DivorcedWomen who gave birth in the past 12 months Now married:
100.0% (34)Unmarried:
0.0% (0)
Women who did not give birth in the past 12 months Now married:
57.4% (2,039)Unmarried:
42.6% (1,514)
Marital status - Black or African American population 15 years and over
Males 46.0% Never married46.9% Now married0.0% Separated0.0% Widowed7.0% DivorcedFemales 48.5% Never married31.9% Now married1.2% Separated0.0% Widowed18.4% DivorcedWomen who gave birth in the past 12 months Now married:
100.0% (122)Unmarried:
0.0% (0)
Women who did not give birth in the past 12 months Now married:
32.6% (351)Unmarried:
67.4% (727)
Marital status - Asian population 15 years and over
Males 0.0% Never married100.0% Now married0.0% Separated0.0% Widowed0.0% DivorcedFemales 0.0% Never married100.0% Now married0.0% Separated0.0% Widowed0.0% DivorcedWomen who did not give birth in the past 12 months Now married:
100.0% (57)Unmarried:
0.0% (0)
Marital status - Other race population 15 years and over
Males 68.9% Never married31.1% Now married0.0% Separated0.0% Widowed0.0% DivorcedFemales 48.5% Never married51.5% Now married0.0% Separated0.0% Widowed0.0% DivorcedWomen who did not give birth in the past 12 months Now married:
41.9% (37)Unmarried:
58.1% (51)
Marital status - Two or more races population 15 years and over
Males 13.7% Never married62.0% Now married0.0% Separated0.0% Widowed24.3% DivorcedFemales 8.8% Never married91.2% Now married0.0% Separated0.0% Widowed0.0% DivorcedWomen who gave birth in the past 12 months Now married:
0.0% (0)Unmarried:
100.0% (23)
Women who did not give birth in the past 12 months Now married:
94.3% (474)Unmarried:
5.7% (29)
Marital status - White alone, not Hispanic / Latino population 15 years and over
Males 20.7% Never married73.6% Now married0.0% Separated1.0% Widowed4.7% DivorcedFemales 21.2% Never married57.3% Now married0.0% Separated6.8% Widowed14.8% DivorcedWomen who gave birth in the past 12 months Now married:
100.0% (35)Unmarried:
0.0% (0)
Women who did not give birth in the past 12 months Now married:
58.4% (1,740)Unmarried:
41.6% (1,242)
Marital status - Hispanic or Latino population 15 years and over
Males 42.4% Never married51.0% Now married0.0% Separated0.0% Widowed6.6% DivorcedFemales 27.4% Never married69.5% Now married0.0% Separated0.0% Widowed3.1% DivorcedWomen who did not give birth in the past 12 months Now married:
65.8% (860)Unmarried:
34.2% (447)
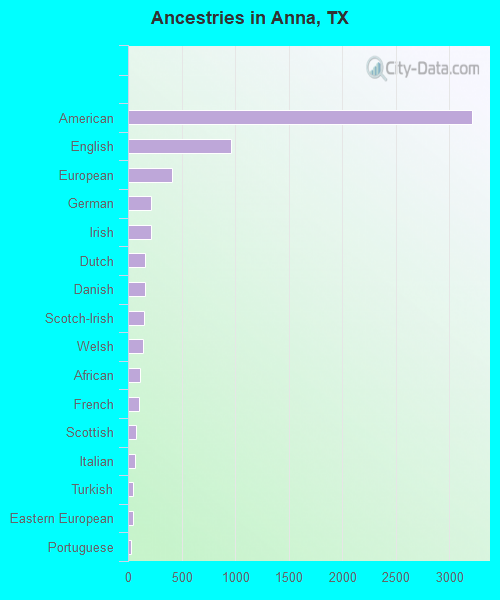
Ancestries in Anna
3,213 26.6% American961 7.9% English413 3.4% European219 1.8% German218 1.8% Irish160 1.3% Dutch159 1.3% Danish149 1.2% Scotch-Irish138 1.1% Welsh111 0.9% African101 0.8% French75 0.6% Scottish63 0.5% Italian51 0.4% Turkish43 0.4% Eastern European32 0.3% Portuguese9 0.07% Norwegian9 0.07% Polish
Geographical mobility in Anna Same house 1 year ago 10,792 79.9% White (Caucasian)2,980 86.1% Black or African American92 57.4% American Indian / Alaska Native292 88.8% Asian223 49.3% Other race1,011 85.0% Two or more races8,648 76.2% White alone, not Hispanic / Latino3,377 86.0% Hispanic or LatinoMoved within same county 1,587 11.7% White / Caucasian195 5.6% Black or African American57 35.9% American Indian / Alaska Native17 5.2% Asian40 8.8% Other race1,660 14.6% White alone, not Hispanic / Latino77 2.0% Hispanic or LatinoMoved within same state 453 3.4% White / Caucasian138 4.0% Black or African American216 47.8% Other race84 7.0% Two or more races466 4.1% White alone, not Hispanic / Latino233 5.9% Hispanic or LatinoMoved from different state 442 3.3% White / Caucasian126 10.6% Two or more races341 3.0% White alone, not Hispanic / Latino291 7.4% Hispanic or LatinoMoved from abroad 11 3.4% Asian
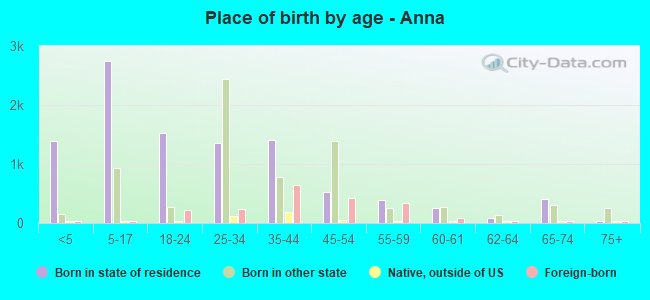
Children Nativity (place of birth) in Anna
Children under 6 years - Living with two parents Both parents native 1,097 100.0% NativeBoth parents foreign-born 186 100.0% NativeChildren under 6 years - Living with one parent Native parent 344 100.0% NativeForeign-born parent 40 100.0% NativeChildren 6 to 17 years - Living with two parents Both parents native 2,193 100.0% NativeBoth parents foreign-born 578 100.0% NativeOne native, one foreign-born parent 28 50.4% Native28 49.6% Foreign-bornChildren 6 to 17 years - Living with one parent Native parent 510 100.0% NativeForeign-born parent 119 47.2% Native133 52.8% Foreign-born
Grandparents responsible for own grandchildren in Anna
Grandparents (30 to 59 years) White / Caucasian 184 100.0% Not responsible for grandchildrenWhite alone, not Hispanic / Latino 180 100.0% Not responsible for grandchildren
Grandparents (60 years and over) White / Caucasian 35 100.0% Not responsible for grandchildrenWhite alone, not Hispanic / Latino 37 100.0% Not responsible for grandchildren