Races in Atlantic City, New Jersey (NJ) Detailed Stats
Data:
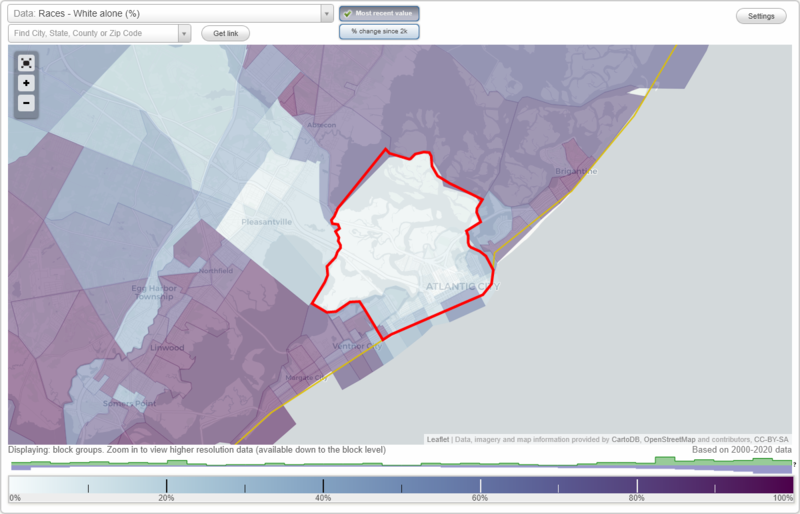
Races - White alone (%)
Races - White alone (% change since 2000)
Races - Black alone (%)
Races - Black alone (% change since 2000)
Races - American Indian alone (%)
Races - American Indian alone (% change since 2000)
Races - Asian alone (%)
Races - Asian alone (% change since 2000)
Races - Hispanic (%)
Races - Hispanic (% change since 2000)
Races - Native Hawaiian and Other Pacific Islander alone (%)
Races - Native Hawaiian and Other Pacific Islander alone (% change since 2000)
Races - Two or more races(%)
Races - Two or more races(% change since 2000)
Races - Other race alone (%)
Races - Other race alone (% change since 2000)
Racial diversity
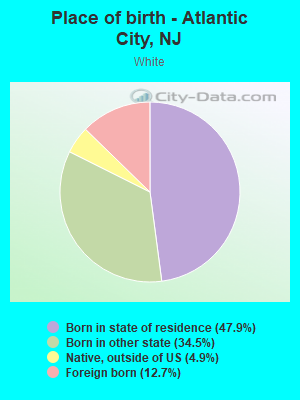
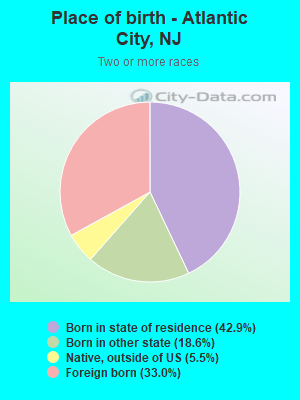
Place of birth - Born in state of residence (%)
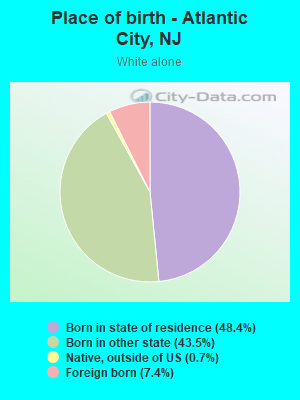
Place of birth - Born in state of residence (%) - White
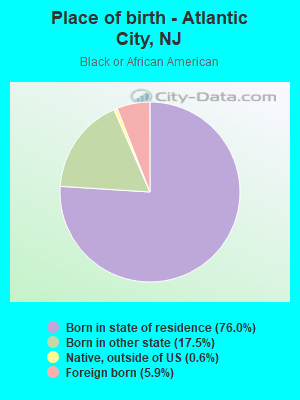
Place of birth - Born in state of residence (%) - Black or African American
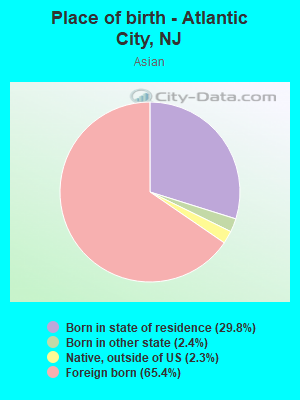
Place of birth - Born in state of residence (%) - Asian
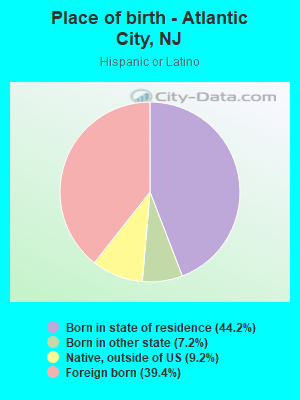
Place of birth - Born in state of residence (%) - Hispanic or Latino
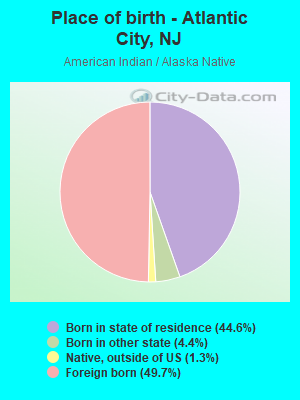
Place of birth - Born in state of residence (%) - American Indian and Alaska Native
Place of birth - Born in state of residence (%) - Multirace
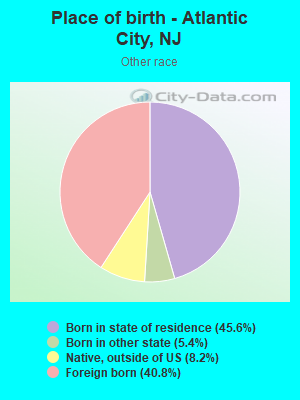
Place of birth - Born in state of residence (%) - Other Race
Place of birth - Born in other state (%)
Place of birth - Born in other state (%) - White
Place of birth - Born in other state (%) - Black or African American
Place of birth - Born in other state (%) - Asian
Place of birth - Born in other state (%) - Hispanic or Latino
Place of birth - Born in other state (%) - American Indian and Alaska Native
Place of birth - Born in other state (%) - Multirace
Place of birth - Born in other state (%) - Other Race
Place of birth - Native, outside of US (%)
Place of birth - Native, outside of US (%) - White
Place of birth - Native, outside of US (%) - Black or African American
Place of birth - Native, outside of US (%) - Asian
Place of birth - Native, outside of US (%) - Hispanic or Latino
Place of birth - Native, outside of US (%) - American Indian and Alaska Native
Place of birth - Native, outside of US (%) - Multirace
Place of birth - Native, outside of US (%) - Other Race
Place of birth - Foreign born (%)
Place of birth - Foreign born (%) - White
Place of birth - Foreign born (%) - Black or African American
Place of birth - Foreign born (%) - Asian
Place of birth - Foreign born (%) - Hispanic or Latino
Place of birth - Foreign born (%) - American Indian and Alaska Native
Place of birth - Foreign born (%) - Multirace
Place of birth - Foreign born (%) - Other Race
Residents speaking English at home (%)
Residents speaking English at home - Born in the United States (%)
Residents speaking English at home - Native, born elsewhere (%)
Residents speaking English at home - Foreign born (%)
Residents speaking Spanish at home (%)
Residents speaking Spanish at home - Born in the United States (%)
Residents speaking Spanish at home - Native, born elsewhere (%)
Residents speaking Spanish at home - Foreign born (%)
Residents speaking other language at home (%)
Residents speaking other language at home - Born in the United States (%)
Residents speaking other language at home - Native, born elsewhere (%)
Residents speaking other language at home - Foreign born (%)
Marital status - Never married (%)
Marital status - Now married (%)
Marital status - Separated (%)
Marital status - Widowed (%)
Marital status - Divorced (%)
Ancestries Reported - Arab (%)
Ancestries Reported - Czech (%)
Ancestries Reported - Danish (%)
Ancestries Reported - Dutch (%)
Ancestries Reported - English (%)
Ancestries Reported - French (%)
Ancestries Reported - French Canadian (%)
Ancestries Reported - German (%)
Ancestries Reported - Greek (%)
Ancestries Reported - Hungarian (%)
Ancestries Reported - Irish (%)
Ancestries Reported - Italian (%)
Ancestries Reported - Lithuanian (%)
Ancestries Reported - Norwegian (%)
Ancestries Reported - Polish (%)
Ancestries Reported - Portuguese (%)
Ancestries Reported - Russian (%)
Ancestries Reported - Scotch-Irish (%)
Ancestries Reported - Scottish (%)
Ancestries Reported - Slovak (%)
Ancestries Reported - Subsaharan African (%)
Ancestries Reported - Swedish (%)
Ancestries Reported - Swiss (%)
Ancestries Reported - Ukrainian (%)
Ancestries Reported - United States (%)
Ancestries Reported - Welsh (%)
Ancestries Reported - West Indian (%)
Ancestries Reported - Other (%)
Geographical mobility - Same house 1 year ago (%)
Geographical mobility - Same house 1 year ago (%) - White
Geographical mobility - Same house 1 year ago (%) - Black or African American
Geographical mobility - Same house 1 year ago (%) - Asian
Geographical mobility - Same house 1 year ago (%) - Hispanic or Latino
Geographical mobility - Same house 1 year ago (%) - American Indian and Alaska Native
Geographical mobility - Same house 1 year ago (%) - Multirace
Geographical mobility - Same house 1 year ago (%) - Other Race
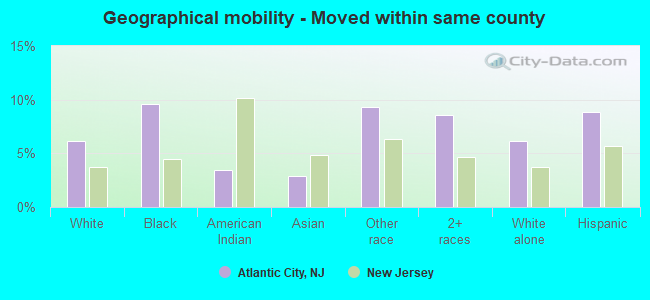
Geographical mobility - Moved within same county (%)
Geographical mobility - Moved within same county (%) - White
Geographical mobility - Moved within same county (%) - Black or African American
Geographical mobility - Moved within same county (%) - Asian
Geographical mobility - Moved within same county (%) - Hispanic or Latino
Geographical mobility - Moved within same county (%) - American Indian and Alaska Native
Geographical mobility - Moved within same county (%) - Multirace
Geographical mobility - Moved within same county (%) - Other Race
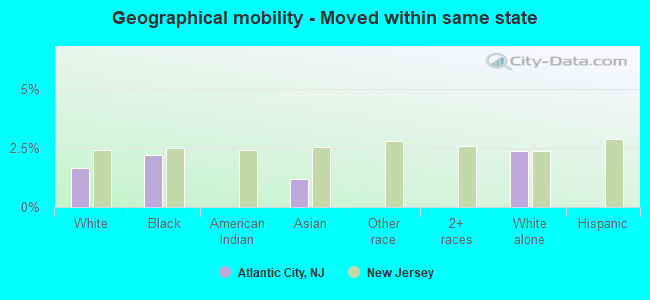
Geographical mobility - Moved from different county within same state (%)
Geographical mobility - Moved from different county within same state (%) - White
Geographical mobility - Moved from different county within same state (%) - Black or African American
Geographical mobility - Moved from different county within same state (%) - Asian
Geographical mobility - Moved from different county within same state (%) - Hispanic or Latino
Geographical mobility - Moved from different county within same state (%) - American Indian and Alaska Native
Geographical mobility - Moved from different county within same state (%) - Multirace
Geographical mobility - Moved from different county within same state (%) - Other Race
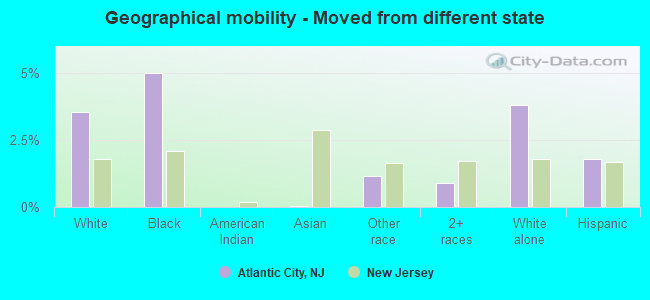
Geographical mobility - Moved from different state (%)
Geographical mobility - Moved from different state (%) - White
Geographical mobility - Moved from different state (%) - Black or African American
Geographical mobility - Moved from different state (%) - Asian
Geographical mobility - Moved from different state (%) - Hispanic or Latino
Geographical mobility - Moved from different state (%) - American Indian and Alaska Native
Geographical mobility - Moved from different state (%) - Multirace
Geographical mobility - Moved from different state (%) - Other Race
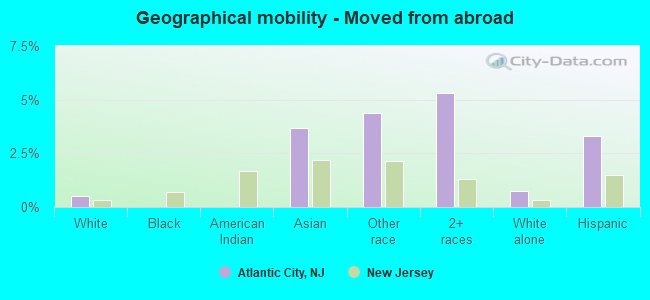
Geographical mobility - Moved from abroad (%)
Geographical mobility - Moved from abroad (%) - White
Geographical mobility - Moved from abroad (%) - Black or African American
Geographical mobility - Moved from abroad (%) - Asian
Geographical mobility - Moved from abroad (%) - Hispanic or Latino
Geographical mobility - Moved from abroad (%) - American Indian and Alaska Native
Geographical mobility - Moved from abroad (%) - Multirace
Geographical mobility - Moved from abroad (%) - Other Race
Place of birth for the foreign-born population - Ireland (%)
Place of birth for the foreign-born population - Denmark (%)
Place of birth for the foreign-born population - Norway (%)
Place of birth for the foreign-born population - Sweden (%)
Place of birth for the foreign-born population - United Kingdom (%)
Place of birth for the foreign-born population - England (%)
Place of birth for the foreign-born population - Scotland (%)
Place of birth for the foreign-born population - Other Northern Europe (%)
Place of birth for the foreign-born population - Austria (%)
Place of birth for the foreign-born population - Belgium (%)
Place of birth for the foreign-born population - France (%)
Place of birth for the foreign-born population - Germany (%)
Place of birth for the foreign-born population - Netherlands (%)
Place of birth for the foreign-born population - Switzerland (%)
Place of birth for the foreign-born population - Other Western Europe (%)
Place of birth for the foreign-born population - Greece (%)
Place of birth for the foreign-born population - Italy (%)
Place of birth for the foreign-born population - Portugal (%)
Place of birth for the foreign-born population - Spain (%)
Place of birth for the foreign-born population - Other Southern Europe (%)
Place of birth for the foreign-born population - Albania (%)
Place of birth for the foreign-born population - Belarus (%)
Place of birth for the foreign-born population - Bosnia and Herzegovina (%)
Place of birth for the foreign-born population - Bulgaria (%)
Place of birth for the foreign-born population - Croatia (%)
Place of birth for the foreign-born population - Czechoslovakia (%)
Place of birth for the foreign-born population - Hungary (%)
Place of birth for the foreign-born population - Latvia (%)
Place of birth for the foreign-born population - Lithuania (%)
Place of birth for the foreign-born population - North Macedonia (Macedonia) (%)
Place of birth for the foreign-born population - Moldova (%)
Place of birth for the foreign-born population - Poland (%)
Place of birth for the foreign-born population - Romania (%)
Place of birth for the foreign-born population - Russia (%)
Place of birth for the foreign-born population - Serbia (%)
Place of birth for the foreign-born population - Ukraine (%)
Place of birth for the foreign-born population - Other Eastern Europe (%)
Place of birth for the foreign-born population - China (%)
Place of birth for the foreign-born population - Hong Kong (%)
Place of birth for the foreign-born population - Taiwan (%)
Place of birth for the foreign-born population - Japan (%)
Place of birth for the foreign-born population - Korea (%)
Place of birth for the foreign-born population - Other Eastern Asia (%)
Place of birth for the foreign-born population - Afghanistan (%)
Place of birth for the foreign-born population - Bangladesh (%)
Place of birth for the foreign-born population - India (%)
Place of birth for the foreign-born population - Iran (%)
Place of birth for the foreign-born population - Kazakhstan (%)
Place of birth for the foreign-born population - Nepal (%)
Place of birth for the foreign-born population - Pakistan (%)
Place of birth for the foreign-born population - Sri Lanka (%)
Place of birth for the foreign-born population - Uzbekistan (%)
Place of birth for the foreign-born population - Other South Central Asia (%)
Place of birth for the foreign-born population - Burma (%)
Place of birth for the foreign-born population - Cambodia (%)
Place of birth for the foreign-born population - Indonesia (%)
Place of birth for the foreign-born population - Laos (%)
Place of birth for the foreign-born population - Malaysia (%)
Place of birth for the foreign-born population - Philippines (%)
Place of birth for the foreign-born population - Singapore (%)
Place of birth for the foreign-born population - Thailand (%)
Place of birth for the foreign-born population - Vietnam (%)
Place of birth for the foreign-born population - Other South Eastern Asia (%)
Place of birth for the foreign-born population - Armenia (%)
Place of birth for the foreign-born population - Iraq (%)
Place of birth for the foreign-born population - Israel (%)
Place of birth for the foreign-born population - Jordan (%)
Place of birth for the foreign-born population - Kuwait (%)
Place of birth for the foreign-born population - Lebanon (%)
Place of birth for the foreign-born population - Saudi Arabia (%)
Place of birth for the foreign-born population - Syria (%)
Place of birth for the foreign-born population - Turkey (%)
Place of birth for the foreign-born population - Yemen (%)
Place of birth for the foreign-born population - Other Western Asia (%)
Place of birth for the foreign-born population - Eritrea (%)
Place of birth for the foreign-born population - Ethiopia (%)
Place of birth for the foreign-born population - Kenya (%)
Place of birth for the foreign-born population - Somalia (%)
Place of birth for the foreign-born population - Uganda (%)
Place of birth for the foreign-born population - Zimbabwe (%)
Place of birth for the foreign-born population - Other Eastern Africa (%)
Place of birth for the foreign-born population - Cameroon (%)
Place of birth for the foreign-born population - Congo (%)
Place of birth for the foreign-born population - Democratic Republic of Congo (Zaire) (%)
Place of birth for the foreign-born population - Other Middle Africa (%)
Place of birth for the foreign-born population - Egypt (%)
Place of birth for the foreign-born population - Morocco (%)
Place of birth for the foreign-born population - Sudan (%)
Place of birth for the foreign-born population - Other Northern Africa (%)
Place of birth for the foreign-born population - South Africa (%)
Place of birth for the foreign-born population - Other Southern Africa (%)
Place of birth for the foreign-born population - Cabo Verde (%)
Place of birth for the foreign-born population - Ghana (%)
Place of birth for the foreign-born population - Liberia (%)
Place of birth for the foreign-born population - Nigeria (%)
Place of birth for the foreign-born population - Senegal (%)
Place of birth for the foreign-born population - Sierra Leone (%)
Place of birth for the foreign-born population - Other Western Africa (%)
Place of birth for the foreign-born population - Australia (%)
Place of birth for the foreign-born population - New Zealand (%)
Place of birth for the foreign-born population - Fiji (%)
Place of birth for the foreign-born population - Micronesia (%)
Place of birth for the foreign-born population - Bahamas (%)
Place of birth for the foreign-born population - Barbados (%)
Place of birth for the foreign-born population - Cuba (%)
Place of birth for the foreign-born population - Dominica (%)
Place of birth for the foreign-born population - Dominican Republic (%)
Place of birth for the foreign-born population - Grenada (%)
Place of birth for the foreign-born population - Haiti (%)
Place of birth for the foreign-born population - Jamaica (%)
Place of birth for the foreign-born population - St. Vincent and the Grenadines (%)
Place of birth for the foreign-born population - Trinidad and Tobago (%)
Place of birth for the foreign-born population - West Indies (%)
Place of birth for the foreign-born population - Other Caribbean (%)
Place of birth for the foreign-born population - Belize (%)
Place of birth for the foreign-born population - Costa Rica (%)
Place of birth for the foreign-born population - El Salvador (%)
Place of birth for the foreign-born population - Guatemala (%)
Place of birth for the foreign-born population - Honduras (%)
Place of birth for the foreign-born population - Mexico (%)
Place of birth for the foreign-born population - Nicaragua (%)
Place of birth for the foreign-born population - Panama (%)
Place of birth for the foreign-born population - Other Central America (%)
Place of birth for the foreign-born population - Argentina (%)
Place of birth for the foreign-born population - Bolivia (%)
Place of birth for the foreign-born population - Brazil (%)
Place of birth for the foreign-born population - Chile (%)
Place of birth for the foreign-born population - Colombia (%)
Place of birth for the foreign-born population - Ecuador (%)
Place of birth for the foreign-born population - Guyana (%)
Place of birth for the foreign-born population - Peru (%)
Place of birth for the foreign-born population - Uruguay (%)
Place of birth for the foreign-born population - Venezuela (%)
Place of birth for the foreign-born population - Other South America (%)
Place of birth for the foreign-born population - Canada (%)
Place of birth for the foreign-born population - Other Northern America (%)
Place of birth for the foreign-born population - Other (%)
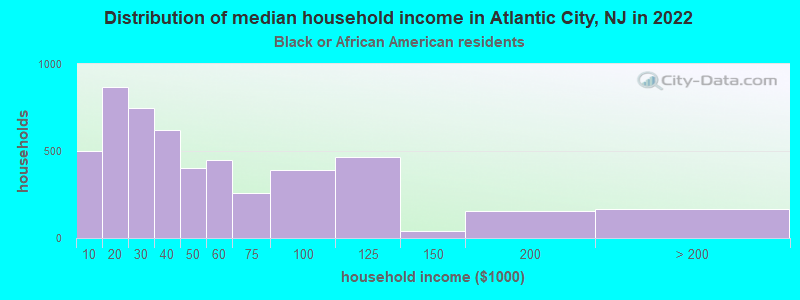
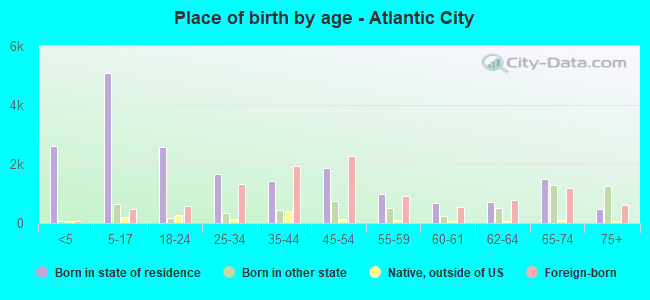
According to 2022 data, the most numerous races in Atlantic City, NJ are White alone (5,931 residents), Hispanic (13,282 residents), and Black alone (11,472 residents). 51.0% of Atlantic City residents speak English at home. 31.1% of Atlantic City, NJ residents are foreign-born (16.9% born in Latin America, 12.0% born in Asia), which is 26.0% greater than the foreign-born rate of 23.0% across the entire state of New Jersey.
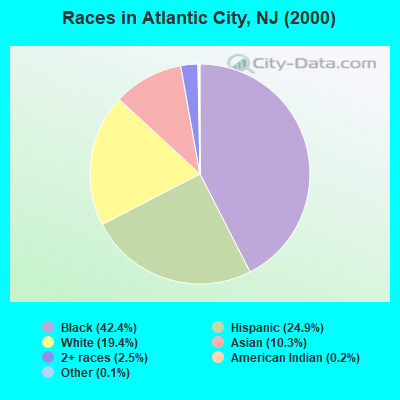
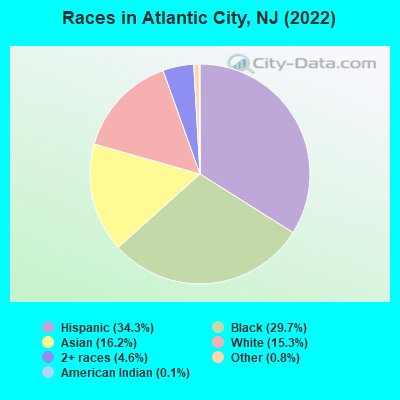
Race distribution in Atlantic City
2000 2022
17,168 42.4% Black alone 10,107 24.9% Hispanic 7,878 19.4% White alone 4,184 10.3% Asian alone 1,021 2.5% Two or more races 98 0.2% American Indian alone 55 0.1% Other race alone 6 0.01% Native Hawaiian and Other
13,282 34.3% Hispanic 11,472 29.7% Black alone 6,281 16.2% Asian alone 5,931 15.3% White alone 1,768 4.6% Two or more races 292 0.8% Other race alone 42 0.1% American Indian alone
2000 2022
5,557,209 66.0% White alone 1,117,191 13.3% Hispanic 1,096,171 13.0% Black alone 477,012 5.7% Asian alone 133,689 1.6% Two or more races 19,565 0.2% Other race alone 11,338 0.1% American Indian alone 2,175 0.03% Native Hawaiian and Other
4,766,476 51.5% White alone 2,028,470 21.9% Hispanic 1,111,632 12.0% Black alone 923,546 10.0% Asian alone 332,237 3.6% Two or more races 89,847 1.0% Other race alone 8,557 0.09% American Indian alone 934 0.01% Native Hawaiian and Other
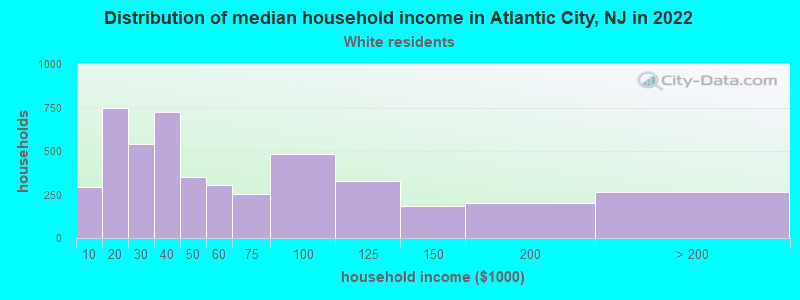
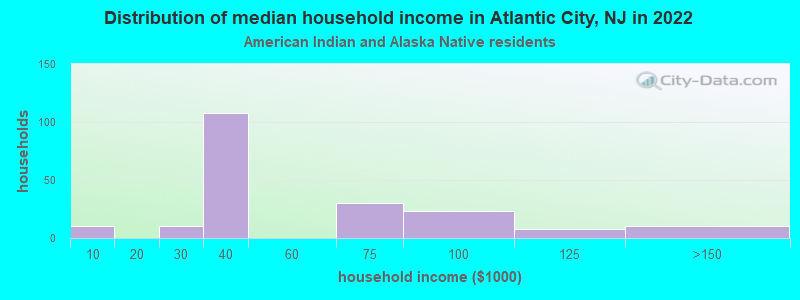
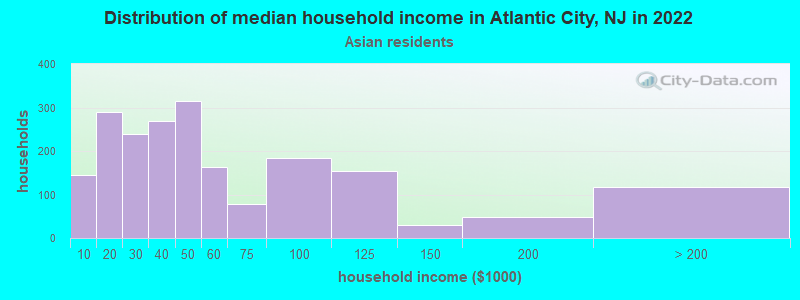
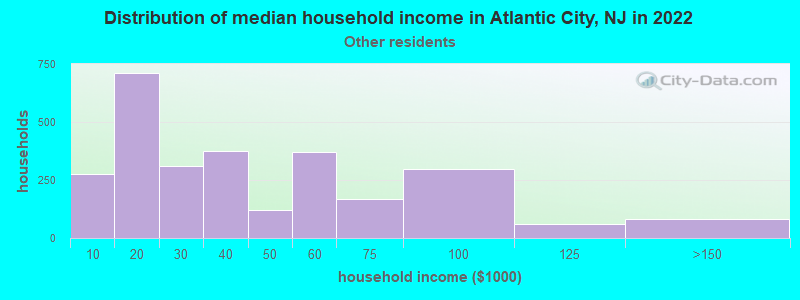
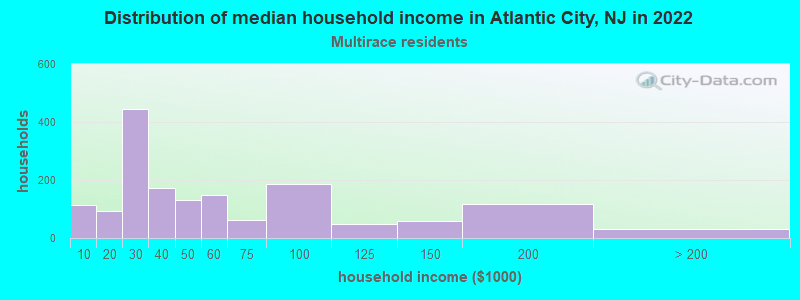
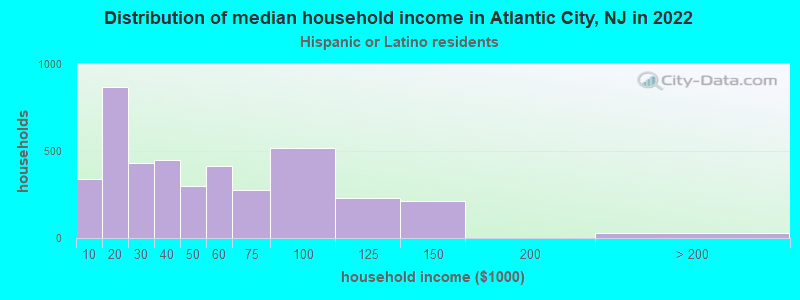
Income and house value in Atlantic City Median household income in 2022 $43,104 White non-Hispanic householders$36,665 Black householders$73,607 American Indian and Alaska Native householders$36,233 Asian householders$35,842 Some other race householders$41,099 Two or more races householders$41,864 Hispanic or Latino race householdersMedian 2022 house value $210,556 White Non-Hispanic householders$184,404 Black or African American householders$113,101 American Indian or Alaska Native householders $204,968 Asian householders$197,368 Some other race householders$232,461 Two or more races householders$207,650 Hispanic or Latino householders
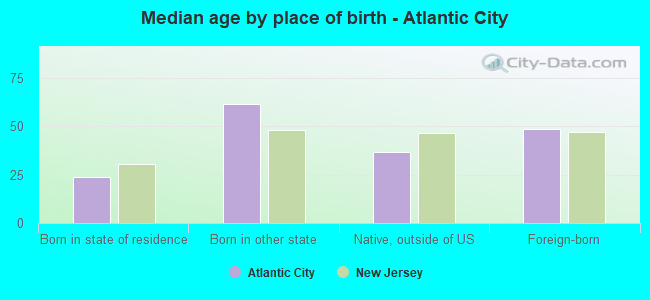
Median age by race in Atlantic City
59.4 Median age for White residents57.8 60.9 44.5 Median age for Black or African American residents38.4 44.9 29.9 Median age for American Indian / Alaska Native residents26.9 49.5 40.7 Median age for Asian residents33.1 45.5 -804,177,544.9 Median age for Native Hawaiian / Pacific Islander residents-860,335,194.7 -713,070,378.3 27.4 Median age for Other race residents27.0 26.1 35.7 Median age for Two or more races residents28.5 37.4 62.3 Median age for White alone residents61.4 63.4 28.8 Median age for Hispanic or Latino residents28.9 28.4
Owner/renter occupied households by race in Atlantic City
House owners and renters - White residents 1,998 46.6% Owner occupied2,289 53.4% Renter occupiedHouse owners and renters - Black or African American residents 1,090 19.5% Owner occupied4,508 80.5% Renter occupiedHouse owners and renters - American Indian / Alaska Native residents 212 100.0% Renter occupiedHouse owners and renters - Asian residents 1,375 68.3% Owner occupied639 31.7% Renter occupiedHouse owners and renters - Other race residents 290 10.2% Owner occupied2,560 89.8% Renter occupiedHouse owners and renters - Two or more races residents 402 25.2% Owner occupied1,192 74.8% Renter occupiedHouse owners and renters - White alone residents 1,925 52.5% Owner occupied1,741 47.5% Renter occupiedHouse owners and renters - Hispanic or Latino residents 374 9.3% Owner occupied3,646 90.7% Renter occupied
Language usage in Atlantic City
English speakers - Total 51.0% of residents of Atlantic City speak English at home.
29.7% of residents speak Spanish at home 4,429 41.4% Speak English very well6,275 58.6% Speak English less than very well19.2% of residents speak other language at home 2,599 37.7% Speak English very well4,303 62.3% Speak English less than very well
English speakers - Born in the United States 84.8% of residents of Atlantic City speak English at home.
10.8% of residents speak Spanish at home 546 82.7% Speak English very well114 17.3% Speak English less than very well2.7% of residents speak other language at home 165 100.0% Speak English very well
English speakers - Native, born elsewhere 16.1% of residents of Atlantic City speak English at home.
72.5% of residents speak Spanish at home 395 38.6% Speak English very well627 61.4% Speak English less than very well11.8% of residents speak other language at home 157 94.6% Speak English very well9 5.4% Speak English less than very well
English speakers - Foreign-born 7.4% of residents of Atlantic City speak English at home.
48.0% of residents speak Spanish at home 555 10.6% Speak English very well4,683 89.4% Speak English less than very well47.2% of residents speak other language at home 1,361 26.5% Speak English very well3,784 73.5% Speak English less than very well
White (Caucasian) - Speak only English Native:
78.7% (5,310)Foreign-born:
8.4% (80)
White (Caucasian) - Speak another language Native:
12.8% (863)Foreign-born:
89.7% (863)
Black or African American - Speak only English Native:
100.0% (10,045)Foreign-born:
29.7% (206)
Black or African American - Speak another language Native:
0.7% (73)Foreign-born:
70.3% (488)
American Indian / Alaska Native - Speak another language Native:
100.0% (307)Foreign-born:
97.6% (347)
Asian - Speak only English Native:
21.4% (351)Foreign-born:
6.4% (269)
Asian - Speak another language Native:
81.3% (1,337)Foreign-born:
93.6% (3,964)
Other race - Speak only English Native:
13.8% (640)Foreign-born:
2.7% (104)
Other race - Speak another language Native:
82.7% (3,834)Foreign-born:
95.7% (3,719)
Two or more races - Speak only English Native:
57.7% (1,329)Foreign-born:
14.6% (205)
Two or more races - Speak another language Native:
43.6% (1,005)Foreign-born:
85.8% (1,203)
White alone - Speak only English Native:
95.4% (5,225)Foreign-born:
19.5% (84)
White alone - Speak another language Native:
4.5% (248)Foreign-born:
81.5% (353)
Hispanic or Latino - Speak only English Native:
16.1% (1,081)Foreign-born:
3.0% (154)
Hispanic or Latino - Speak another language Native:
77.6% (5,212)Foreign-born:
96.3% (4,886)
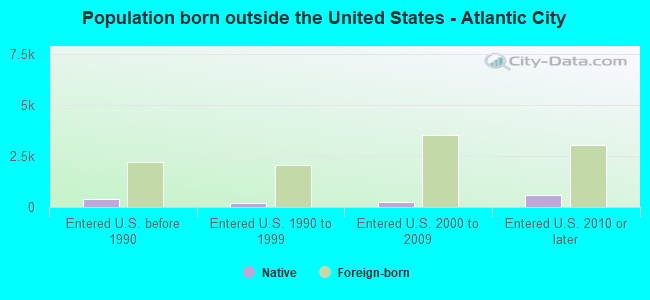
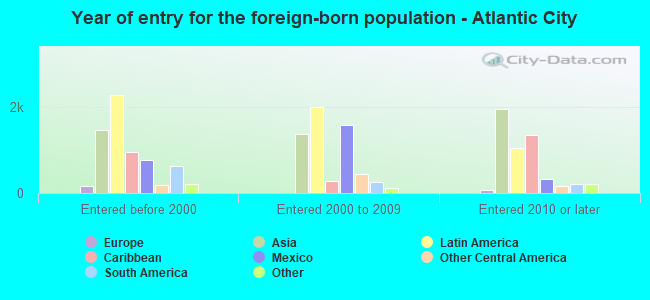
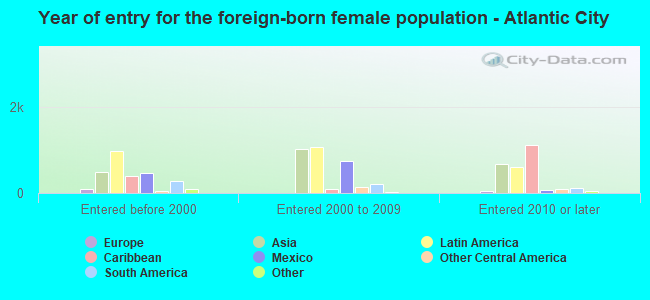
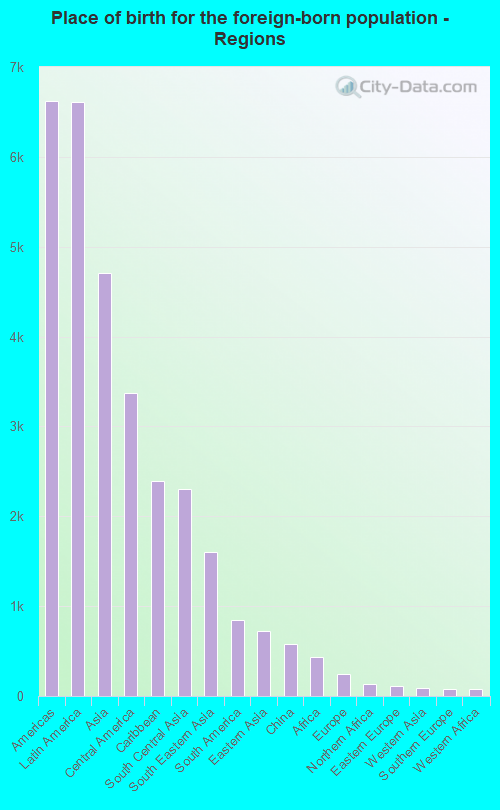
Foreign-born residents in Atlantic City 12,014 residents are foreign born (16.9% Latin America , 12.0% Asia ).
This city:
31.1%New Jersey:
23.2%
Marital status for residents in Atlantic City Marital status - White (Caucasian) population 15 years and over
Males 43.1% Never married31.8% Now married1.8% Separated4.9% Widowed18.3% DivorcedFemales 24.5% Never married36.2% Now married2.7% Separated13.9% Widowed22.8% DivorcedWomen who gave birth in the past 12 months Now married:
100.0% (8)Unmarried:
0.0% (0)
Women who did not give birth in the past 12 months Now married:
35.6% (405)Unmarried:
64.4% (733)
Marital status - Black or African American population 15 years and over
Males 55.8% Never married23.4% Now married8.0% Separated4.3% Widowed8.6% DivorcedFemales 54.3% Never married14.8% Now married5.4% Separated11.9% Widowed13.6% DivorcedWomen who gave birth in the past 12 months Now married:
37.1% (86)Unmarried:
62.9% (145)
Women who did not give birth in the past 12 months Now married:
22.0% (475)Unmarried:
78.0% (1,690)
Marital status - American Indian / Alaska Native population 15 years and over
Males 71.3% Never married22.6% Now married0.0% Separated0.0% Widowed6.1% DivorcedFemales 94.4% Never married5.6% Now married0.0% Separated0.0% Widowed0.0% DivorcedWomen who gave birth in the past 12 months Now married:
0.0% (0)Unmarried:
100.0% (9)
Women who did not give birth in the past 12 months Now married:
0.0% (0)Unmarried:
100.0% (77)
Marital status - Asian population 15 years and over
Males 31.1% Never married58.8% Now married1.1% Separated2.1% Widowed6.9% DivorcedFemales 23.2% Never married58.0% Now married2.5% Separated4.2% Widowed12.2% DivorcedWomen who gave birth in the past 12 months Now married:
80.0% (44)Unmarried:
20.0% (11)
Women who did not give birth in the past 12 months Now married:
53.8% (644)Unmarried:
46.2% (552)
Marital status - Other race population 15 years and over
Males 54.9% Never married26.4% Now married5.7% Separated0.4% Widowed12.6% DivorcedFemales 57.4% Never married17.9% Now married14.1% Separated1.5% Widowed9.0% DivorcedWomen who gave birth in the past 12 months Now married:
35.7% (99)Unmarried:
64.3% (178)
Women who did not give birth in the past 12 months Now married:
24.7% (595)Unmarried:
75.3% (1,811)
Marital status - Two or more races population 15 years and over
Males 60.7% Never married26.6% Now married6.4% Separated0.0% Widowed6.3% DivorcedFemales 53.1% Never married27.2% Now married4.0% Separated5.2% Widowed10.5% DivorcedWomen who gave birth in the past 12 months Now married:
0.0% (0)Unmarried:
100.0% (82)
Women who did not give birth in the past 12 months Now married:
33.0% (332)Unmarried:
67.0% (675)
Marital status - White alone, not Hispanic / Latino population 15 years and over
Males 44.2% Never married32.6% Now married2.0% Separated6.2% Widowed15.1% DivorcedFemales 19.3% Never married37.2% Now married2.9% Separated16.8% Widowed23.8% DivorcedWomen who did not give birth in the past 12 months Now married:
43.0% (283)Unmarried:
57.0% (376)
Marital status - Hispanic or Latino population 15 years and over
Males 52.4% Never married25.9% Now married5.6% Separated0.4% Widowed15.6% DivorcedFemales 52.2% Never married22.7% Now married10.7% Separated2.8% Widowed11.7% DivorcedWomen who gave birth in the past 12 months Now married:
33.5% (92)Unmarried:
66.5% (184)
Women who did not give birth in the past 12 months Now married:
27.0% (824)Unmarried:
73.0% (2,228)
Ancestries in Atlantic City
843 3.0% Italian548 2.0% Irish346 1.2% American281 1.0% Haitian274 1.0% Polish258 0.9% German200 0.7% Jamaican124 0.4% African121 0.4% English107 0.4% Russian96 0.3% Pennsylvania German86 0.3% Trinidadian and Tobagonian76 0.3% European64 0.2% Egyptian61 0.2% Arab59 0.2% Moroccan56 0.2% Jordanian50 0.2% Liberian41 0.1% Iranian38 0.1% Romanian34 0.1% Greek31 0.1% Afghan29 0.1% Dutch26 0.09% Barbadian24 0.09% Slovene19 0.07% Palestinian19 0.07% Ukrainian16 0.06% French14 0.05% Brazilian9 0.03% Nigerian8 0.03% Turkish8 0.03% Finnish5 0.02% Hungarian4 0.01% West Indian
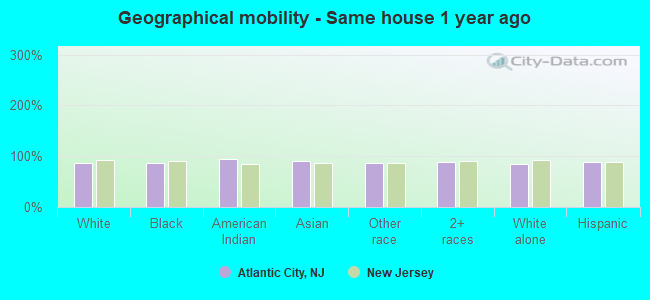
Geographical mobility in Atlantic City Same house 1 year ago 7,024 86.9% White (Caucasian)10,006 87.5% Black or African American649 94.4% American Indian / Alaska Native5,676 91.4% Asian7,944 85.8% Other race3,999 88.3% Two or more races5,031 84.5% White alone, not Hispanic / Latino11,364 87.8% Hispanic or LatinoMoved within same county 498 6.2% White / Caucasian1,099 9.6% Black or African American23 3.4% American Indian / Alaska Native178 2.9% Asian861 9.3% Other race388 8.6% Two or more races364 6.1% White alone, not Hispanic / Latino1,142 8.8% Hispanic or LatinoMoved within same state 134 1.7% White / Caucasian249 2.2% Black or African American73 1.2% Asian142 2.4% White alone, not Hispanic / LatinoMoved from different state 286 3.5% White / Caucasian570 5.0% Black or African American2 0.0% Asian108 1.2% Other race41 0.9% Two or more races226 3.8% White alone, not Hispanic / Latino231 1.8% Hispanic or LatinoMoved from abroad 43 0.5% White229 3.7% Asian405 4.4% Other race241 5.3% Two or more races43 0.7% White alone, not Hispanic / Latino430 3.3% Hispanic or Latino
Children Nativity (place of birth) in Atlantic City
Children under 6 years - Living with two parents Both parents native 764 99.4% Native4 0.6% Foreign-bornBoth parents foreign-born 305 100.0% NativeOne native, one foreign-born parent 147 84.5% Native27 15.5% Foreign-bornChildren under 6 years - Living with one parent Native parent 926 100.0% NativeForeign-born parent 571 100.0% NativeChildren 6 to 17 years - Living with two parents Both parents native 502 100.0% NativeBoth parents foreign-born 728 63.4% Native420 36.6% Foreign-bornOne native, one foreign-born parent 607 100.0% NativeChildren 6 to 17 years - Living with one parent Native parent 905 100.0% NativeForeign-born parent 2,167 51.1% Native2,070 48.9% Foreign-born
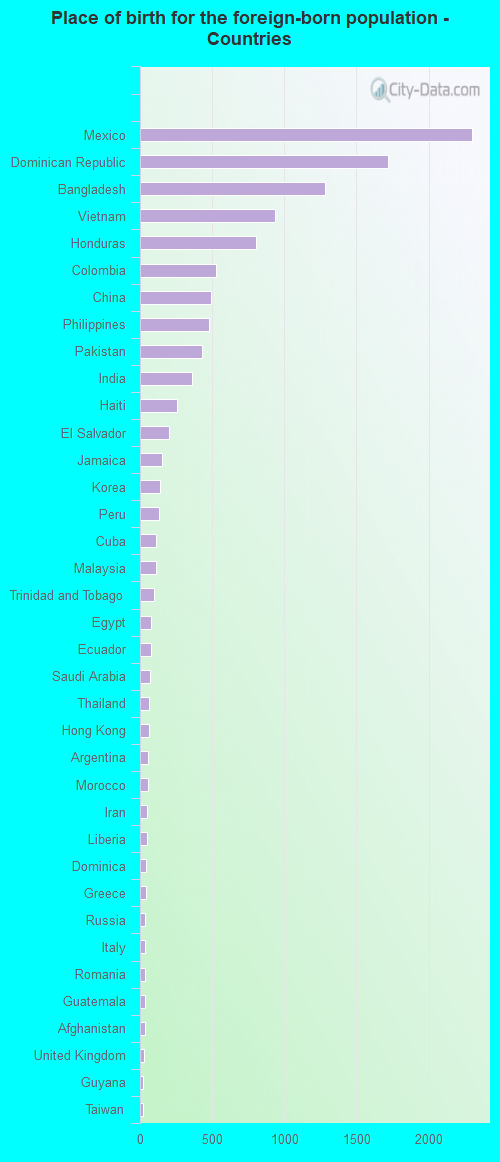
Place of birth for residents in Atlantic City 6,619 Americas6,609 Latin America4,713 Asia3,371 Central America2,395 Caribbean2,305 South Central Asia1,602 South Eastern Asia842 South America718 Eastern Asia577 China436 Africa245 Europe132 Northern Africa108 Eastern Europe86 Western Asia77 Southern Europe77 Western Africa41 Northern Europe17 Western Europe10 Northern America2,303 Mexico1,718 Dominican Republic1,285 Bangladesh938 Vietnam802 Honduras525 Colombia494 China476 Philippines429 Pakistan358 India253 Haiti204 El Salvador150 Jamaica141 Korea133 Peru114 Cuba111 Malaysia98 Trinidad and Tobago79 Egypt78 Ecuador70 Saudi Arabia63 Thailand62 Hong Kong55 Argentina52 Morocco49 Iran48 Liberia41 Dominica39 Greece37 Russia37 Italy36 Romania33 Guatemala32 Afghanistan30 United Kingdom22 Guyana21 Taiwan18 Barbados18 Ghana14 Brazil14 Poland13 Venezuela11 Germany11 Ireland11 Ukraine10 Nigeria10 Costa Rica10 Nicaragua10 Canada9 Belarus8 Israel8 Cambodia8 Turkey7 Panama6 Belgium4 Laos
Grandparents responsible for own grandchildren in Atlantic City
Grandparents (30 to 59 years) Black or African American 39 100.0% Not responsible for grandchildrenAmerican Indian / Alaska Native 84 100.0% Not responsible for grandchildrenOther race 27 100.0% Not responsible for grandchildrenTwo or more races 19 47.7% Responsible for grandchildren21 52.3% Not responsible for grandchildrenHispanic or Latino 53 100.0% Not responsible for grandchildrenGrandparents (60 years and over) Black or African American 6 9.7% Responsible for grandchildren55 90.3% Not responsible for grandchildrenOther race 85 100.0% Not responsible for grandchildrenTwo or more races 22 92.3% Responsible for grandchildren2 7.7% Not responsible for grandchildrenHispanic or Latino 10 10.7% Responsible for grandchildren83 89.3% Not responsible for grandchildren