Races in Avenel, New Jersey (NJ) Detailed Stats
Data:
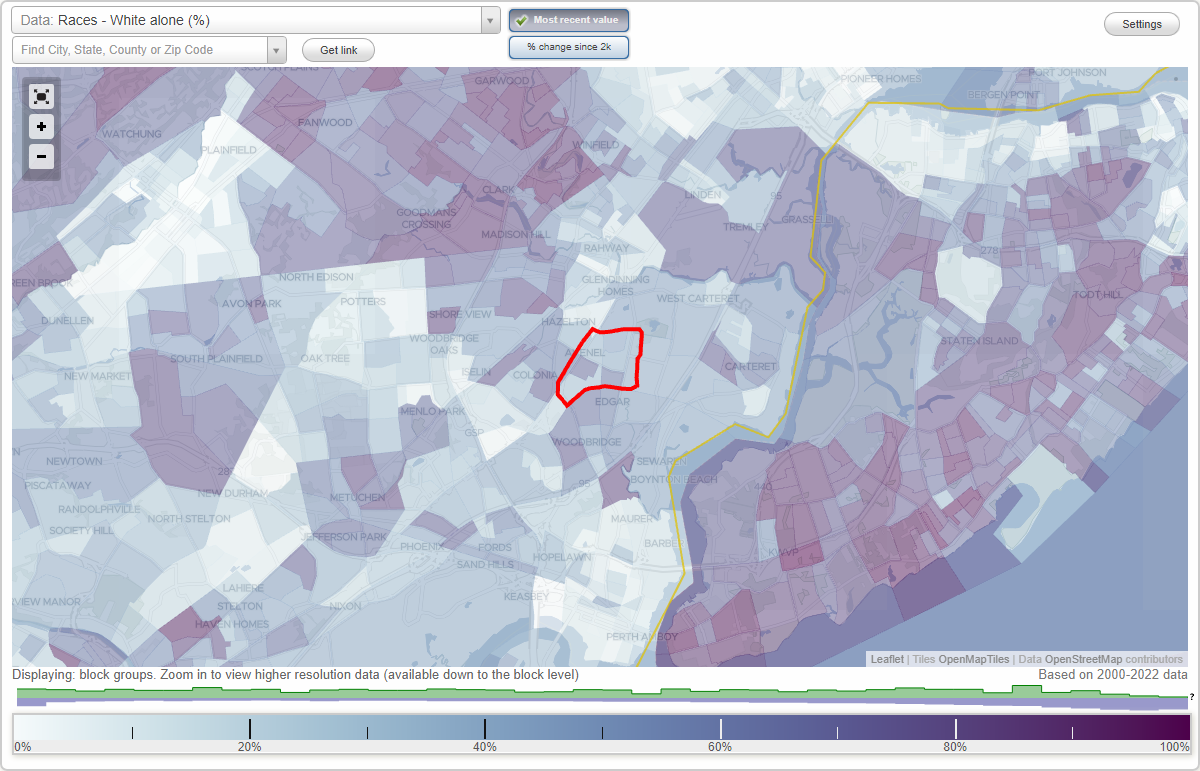
Races - White alone (%)
Races - White alone (% change since 2000)
Races - Black alone (%)
Races - Black alone (% change since 2000)
Races - American Indian alone (%)
Races - American Indian alone (% change since 2000)
Races - Asian alone (%)
Races - Asian alone (% change since 2000)
Races - Hispanic (%)
Races - Hispanic (% change since 2000)
Races - Native Hawaiian and Other Pacific Islander alone (%)
Races - Native Hawaiian and Other Pacific Islander alone (% change since 2000)
Races - Two or more races(%)
Races - Two or more races(% change since 2000)
Races - Other race alone (%)
Races - Other race alone (% change since 2000)
Racial diversity
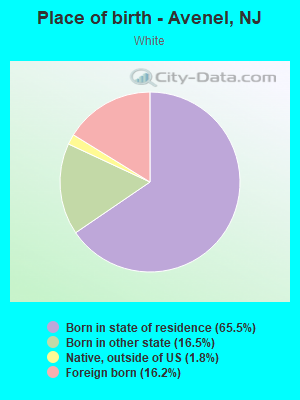
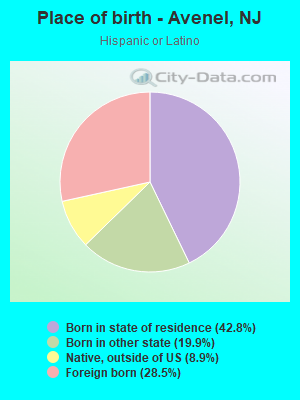
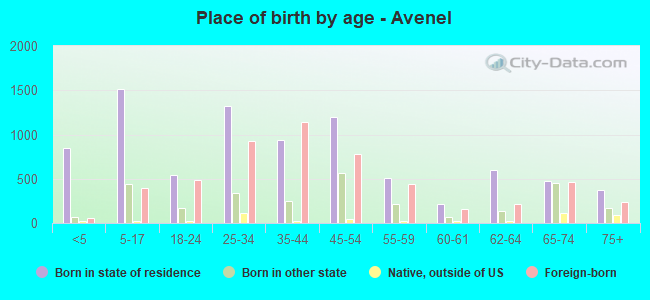
Place of birth - Born in state of residence (%)
Place of birth - Born in state of residence (%) - White
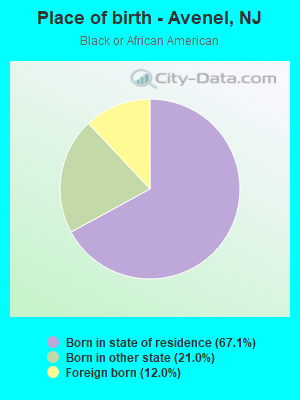
Place of birth - Born in state of residence (%) - Black or African American
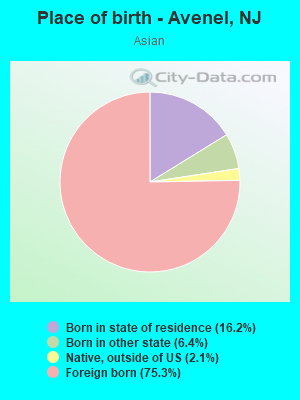
Place of birth - Born in state of residence (%) - Asian
Place of birth - Born in state of residence (%) - Hispanic or Latino
Place of birth - Born in state of residence (%) - American Indian and Alaska Native
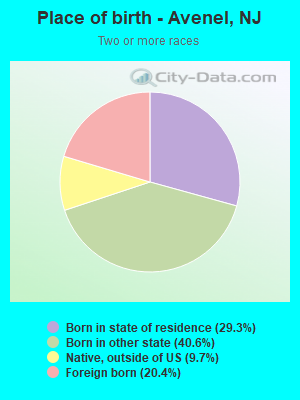
Place of birth - Born in state of residence (%) - Multirace
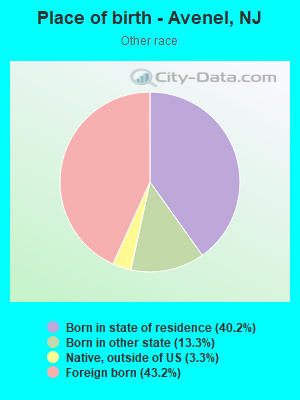
Place of birth - Born in state of residence (%) - Other Race
Place of birth - Born in other state (%)
Place of birth - Born in other state (%) - White
Place of birth - Born in other state (%) - Black or African American
Place of birth - Born in other state (%) - Asian
Place of birth - Born in other state (%) - Hispanic or Latino
Place of birth - Born in other state (%) - American Indian and Alaska Native
Place of birth - Born in other state (%) - Multirace
Place of birth - Born in other state (%) - Other Race
Place of birth - Native, outside of US (%)
Place of birth - Native, outside of US (%) - White
Place of birth - Native, outside of US (%) - Black or African American
Place of birth - Native, outside of US (%) - Asian
Place of birth - Native, outside of US (%) - Hispanic or Latino
Place of birth - Native, outside of US (%) - American Indian and Alaska Native
Place of birth - Native, outside of US (%) - Multirace
Place of birth - Native, outside of US (%) - Other Race
Place of birth - Foreign born (%)
Place of birth - Foreign born (%) - White
Place of birth - Foreign born (%) - Black or African American
Place of birth - Foreign born (%) - Asian
Place of birth - Foreign born (%) - Hispanic or Latino
Place of birth - Foreign born (%) - American Indian and Alaska Native
Place of birth - Foreign born (%) - Multirace
Place of birth - Foreign born (%) - Other Race
Residents speaking English at home (%)
Residents speaking English at home - Born in the United States (%)
Residents speaking English at home - Native, born elsewhere (%)
Residents speaking English at home - Foreign born (%)
Residents speaking Spanish at home (%)
Residents speaking Spanish at home - Born in the United States (%)
Residents speaking Spanish at home - Native, born elsewhere (%)
Residents speaking Spanish at home - Foreign born (%)
Residents speaking other language at home (%)
Residents speaking other language at home - Born in the United States (%)
Residents speaking other language at home - Native, born elsewhere (%)
Residents speaking other language at home - Foreign born (%)
Marital status - Never married (%)
Marital status - Now married (%)
Marital status - Separated (%)
Marital status - Widowed (%)
Marital status - Divorced (%)
Ancestries Reported - Arab (%)
Ancestries Reported - Czech (%)
Ancestries Reported - Danish (%)
Ancestries Reported - Dutch (%)
Ancestries Reported - English (%)
Ancestries Reported - French (%)
Ancestries Reported - French Canadian (%)
Ancestries Reported - German (%)
Ancestries Reported - Greek (%)
Ancestries Reported - Hungarian (%)
Ancestries Reported - Irish (%)
Ancestries Reported - Italian (%)
Ancestries Reported - Lithuanian (%)
Ancestries Reported - Norwegian (%)
Ancestries Reported - Polish (%)
Ancestries Reported - Portuguese (%)
Ancestries Reported - Russian (%)
Ancestries Reported - Scotch-Irish (%)
Ancestries Reported - Scottish (%)
Ancestries Reported - Slovak (%)
Ancestries Reported - Subsaharan African (%)
Ancestries Reported - Swedish (%)
Ancestries Reported - Swiss (%)
Ancestries Reported - Ukrainian (%)
Ancestries Reported - United States (%)
Ancestries Reported - Welsh (%)
Ancestries Reported - West Indian (%)
Ancestries Reported - Other (%)
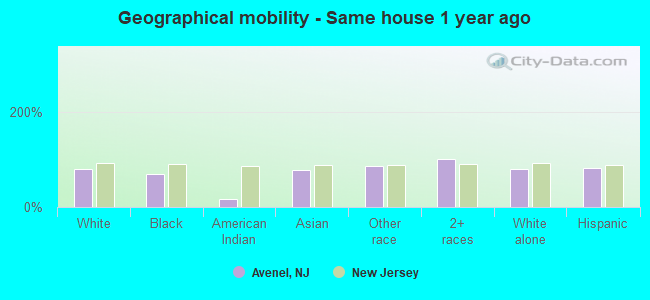
Geographical mobility - Same house 1 year ago (%)
Geographical mobility - Same house 1 year ago (%) - White
Geographical mobility - Same house 1 year ago (%) - Black or African American
Geographical mobility - Same house 1 year ago (%) - Asian
Geographical mobility - Same house 1 year ago (%) - Hispanic or Latino
Geographical mobility - Same house 1 year ago (%) - American Indian and Alaska Native
Geographical mobility - Same house 1 year ago (%) - Multirace
Geographical mobility - Same house 1 year ago (%) - Other Race
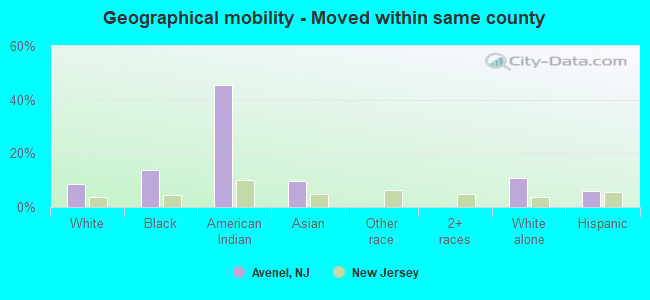
Geographical mobility - Moved within same county (%)
Geographical mobility - Moved within same county (%) - White
Geographical mobility - Moved within same county (%) - Black or African American
Geographical mobility - Moved within same county (%) - Asian
Geographical mobility - Moved within same county (%) - Hispanic or Latino
Geographical mobility - Moved within same county (%) - American Indian and Alaska Native
Geographical mobility - Moved within same county (%) - Multirace
Geographical mobility - Moved within same county (%) - Other Race
Geographical mobility - Moved from different county within same state (%)
Geographical mobility - Moved from different county within same state (%) - White
Geographical mobility - Moved from different county within same state (%) - Black or African American
Geographical mobility - Moved from different county within same state (%) - Asian
Geographical mobility - Moved from different county within same state (%) - Hispanic or Latino
Geographical mobility - Moved from different county within same state (%) - American Indian and Alaska Native
Geographical mobility - Moved from different county within same state (%) - Multirace
Geographical mobility - Moved from different county within same state (%) - Other Race
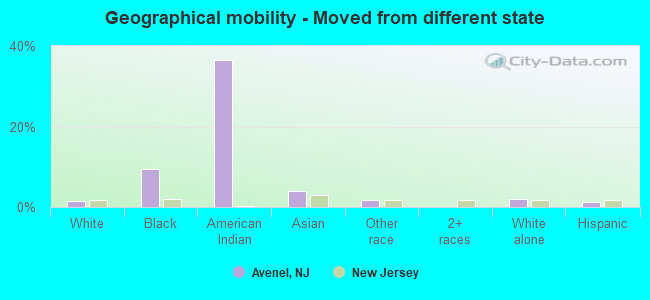
Geographical mobility - Moved from different state (%)
Geographical mobility - Moved from different state (%) - White
Geographical mobility - Moved from different state (%) - Black or African American
Geographical mobility - Moved from different state (%) - Asian
Geographical mobility - Moved from different state (%) - Hispanic or Latino
Geographical mobility - Moved from different state (%) - American Indian and Alaska Native
Geographical mobility - Moved from different state (%) - Multirace
Geographical mobility - Moved from different state (%) - Other Race
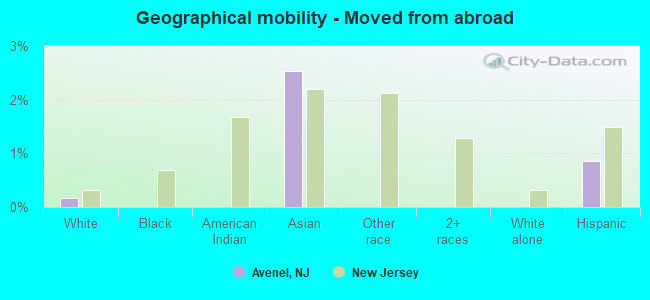
Geographical mobility - Moved from abroad (%)
Geographical mobility - Moved from abroad (%) - White
Geographical mobility - Moved from abroad (%) - Black or African American
Geographical mobility - Moved from abroad (%) - Asian
Geographical mobility - Moved from abroad (%) - Hispanic or Latino
Geographical mobility - Moved from abroad (%) - American Indian and Alaska Native
Geographical mobility - Moved from abroad (%) - Multirace
Geographical mobility - Moved from abroad (%) - Other Race
Place of birth for the foreign-born population - Ireland (%)
Place of birth for the foreign-born population - Denmark (%)
Place of birth for the foreign-born population - Norway (%)
Place of birth for the foreign-born population - Sweden (%)
Place of birth for the foreign-born population - United Kingdom (%)
Place of birth for the foreign-born population - England (%)
Place of birth for the foreign-born population - Scotland (%)
Place of birth for the foreign-born population - Other Northern Europe (%)
Place of birth for the foreign-born population - Austria (%)
Place of birth for the foreign-born population - Belgium (%)
Place of birth for the foreign-born population - France (%)
Place of birth for the foreign-born population - Germany (%)
Place of birth for the foreign-born population - Netherlands (%)
Place of birth for the foreign-born population - Switzerland (%)
Place of birth for the foreign-born population - Other Western Europe (%)
Place of birth for the foreign-born population - Greece (%)
Place of birth for the foreign-born population - Italy (%)
Place of birth for the foreign-born population - Portugal (%)
Place of birth for the foreign-born population - Spain (%)
Place of birth for the foreign-born population - Other Southern Europe (%)
Place of birth for the foreign-born population - Albania (%)
Place of birth for the foreign-born population - Belarus (%)
Place of birth for the foreign-born population - Bosnia and Herzegovina (%)
Place of birth for the foreign-born population - Bulgaria (%)
Place of birth for the foreign-born population - Croatia (%)
Place of birth for the foreign-born population - Czechoslovakia (%)
Place of birth for the foreign-born population - Hungary (%)
Place of birth for the foreign-born population - Latvia (%)
Place of birth for the foreign-born population - Lithuania (%)
Place of birth for the foreign-born population - North Macedonia (Macedonia) (%)
Place of birth for the foreign-born population - Moldova (%)
Place of birth for the foreign-born population - Poland (%)
Place of birth for the foreign-born population - Romania (%)
Place of birth for the foreign-born population - Russia (%)
Place of birth for the foreign-born population - Serbia (%)
Place of birth for the foreign-born population - Ukraine (%)
Place of birth for the foreign-born population - Other Eastern Europe (%)
Place of birth for the foreign-born population - China (%)
Place of birth for the foreign-born population - Hong Kong (%)
Place of birth for the foreign-born population - Taiwan (%)
Place of birth for the foreign-born population - Japan (%)
Place of birth for the foreign-born population - Korea (%)
Place of birth for the foreign-born population - Other Eastern Asia (%)
Place of birth for the foreign-born population - Afghanistan (%)
Place of birth for the foreign-born population - Bangladesh (%)
Place of birth for the foreign-born population - India (%)
Place of birth for the foreign-born population - Iran (%)
Place of birth for the foreign-born population - Kazakhstan (%)
Place of birth for the foreign-born population - Nepal (%)
Place of birth for the foreign-born population - Pakistan (%)
Place of birth for the foreign-born population - Sri Lanka (%)
Place of birth for the foreign-born population - Uzbekistan (%)
Place of birth for the foreign-born population - Other South Central Asia (%)
Place of birth for the foreign-born population - Burma (%)
Place of birth for the foreign-born population - Cambodia (%)
Place of birth for the foreign-born population - Indonesia (%)
Place of birth for the foreign-born population - Laos (%)
Place of birth for the foreign-born population - Malaysia (%)
Place of birth for the foreign-born population - Philippines (%)
Place of birth for the foreign-born population - Singapore (%)
Place of birth for the foreign-born population - Thailand (%)
Place of birth for the foreign-born population - Vietnam (%)
Place of birth for the foreign-born population - Other South Eastern Asia (%)
Place of birth for the foreign-born population - Armenia (%)
Place of birth for the foreign-born population - Iraq (%)
Place of birth for the foreign-born population - Israel (%)
Place of birth for the foreign-born population - Jordan (%)
Place of birth for the foreign-born population - Kuwait (%)
Place of birth for the foreign-born population - Lebanon (%)
Place of birth for the foreign-born population - Saudi Arabia (%)
Place of birth for the foreign-born population - Syria (%)
Place of birth for the foreign-born population - Turkey (%)
Place of birth for the foreign-born population - Yemen (%)
Place of birth for the foreign-born population - Other Western Asia (%)
Place of birth for the foreign-born population - Eritrea (%)
Place of birth for the foreign-born population - Ethiopia (%)
Place of birth for the foreign-born population - Kenya (%)
Place of birth for the foreign-born population - Somalia (%)
Place of birth for the foreign-born population - Uganda (%)
Place of birth for the foreign-born population - Zimbabwe (%)
Place of birth for the foreign-born population - Other Eastern Africa (%)
Place of birth for the foreign-born population - Cameroon (%)
Place of birth for the foreign-born population - Congo (%)
Place of birth for the foreign-born population - Democratic Republic of Congo (Zaire) (%)
Place of birth for the foreign-born population - Other Middle Africa (%)
Place of birth for the foreign-born population - Egypt (%)
Place of birth for the foreign-born population - Morocco (%)
Place of birth for the foreign-born population - Sudan (%)
Place of birth for the foreign-born population - Other Northern Africa (%)
Place of birth for the foreign-born population - South Africa (%)
Place of birth for the foreign-born population - Other Southern Africa (%)
Place of birth for the foreign-born population - Cabo Verde (%)
Place of birth for the foreign-born population - Ghana (%)
Place of birth for the foreign-born population - Liberia (%)
Place of birth for the foreign-born population - Nigeria (%)
Place of birth for the foreign-born population - Senegal (%)
Place of birth for the foreign-born population - Sierra Leone (%)
Place of birth for the foreign-born population - Other Western Africa (%)
Place of birth for the foreign-born population - Australia (%)
Place of birth for the foreign-born population - New Zealand (%)
Place of birth for the foreign-born population - Fiji (%)
Place of birth for the foreign-born population - Micronesia (%)
Place of birth for the foreign-born population - Bahamas (%)
Place of birth for the foreign-born population - Barbados (%)
Place of birth for the foreign-born population - Cuba (%)
Place of birth for the foreign-born population - Dominica (%)
Place of birth for the foreign-born population - Dominican Republic (%)
Place of birth for the foreign-born population - Grenada (%)
Place of birth for the foreign-born population - Haiti (%)
Place of birth for the foreign-born population - Jamaica (%)
Place of birth for the foreign-born population - St. Vincent and the Grenadines (%)
Place of birth for the foreign-born population - Trinidad and Tobago (%)
Place of birth for the foreign-born population - West Indies (%)
Place of birth for the foreign-born population - Other Caribbean (%)
Place of birth for the foreign-born population - Belize (%)
Place of birth for the foreign-born population - Costa Rica (%)
Place of birth for the foreign-born population - El Salvador (%)
Place of birth for the foreign-born population - Guatemala (%)
Place of birth for the foreign-born population - Honduras (%)
Place of birth for the foreign-born population - Mexico (%)
Place of birth for the foreign-born population - Nicaragua (%)
Place of birth for the foreign-born population - Panama (%)
Place of birth for the foreign-born population - Other Central America (%)
Place of birth for the foreign-born population - Argentina (%)
Place of birth for the foreign-born population - Bolivia (%)
Place of birth for the foreign-born population - Brazil (%)
Place of birth for the foreign-born population - Chile (%)
Place of birth for the foreign-born population - Colombia (%)
Place of birth for the foreign-born population - Ecuador (%)
Place of birth for the foreign-born population - Guyana (%)
Place of birth for the foreign-born population - Peru (%)
Place of birth for the foreign-born population - Uruguay (%)
Place of birth for the foreign-born population - Venezuela (%)
Place of birth for the foreign-born population - Other South America (%)
Place of birth for the foreign-born population - Canada (%)
Place of birth for the foreign-born population - Other Northern America (%)
Place of birth for the foreign-born population - Other (%)
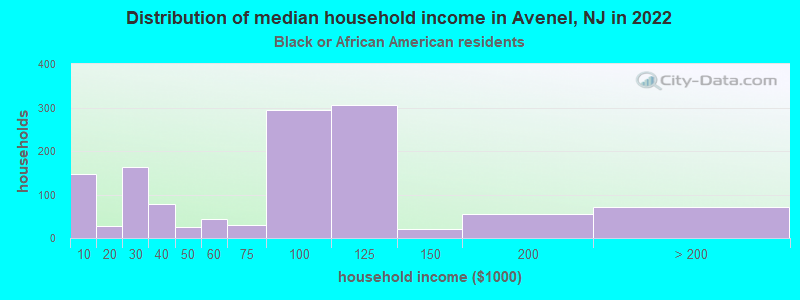
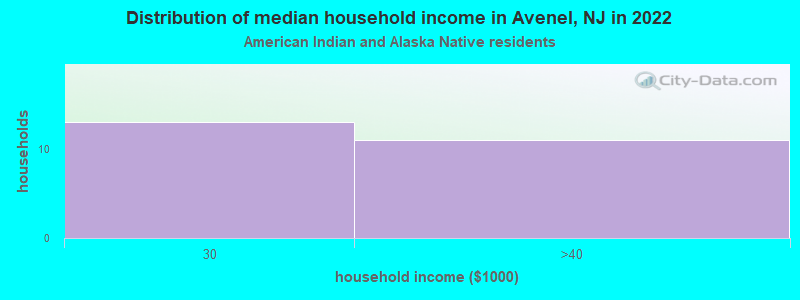
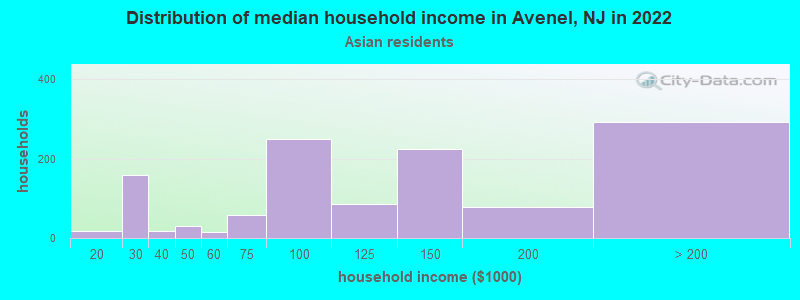
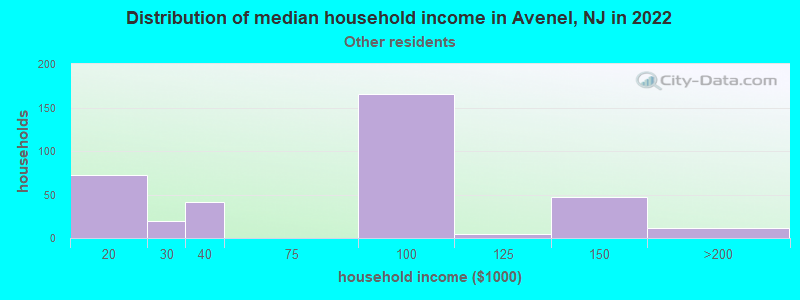
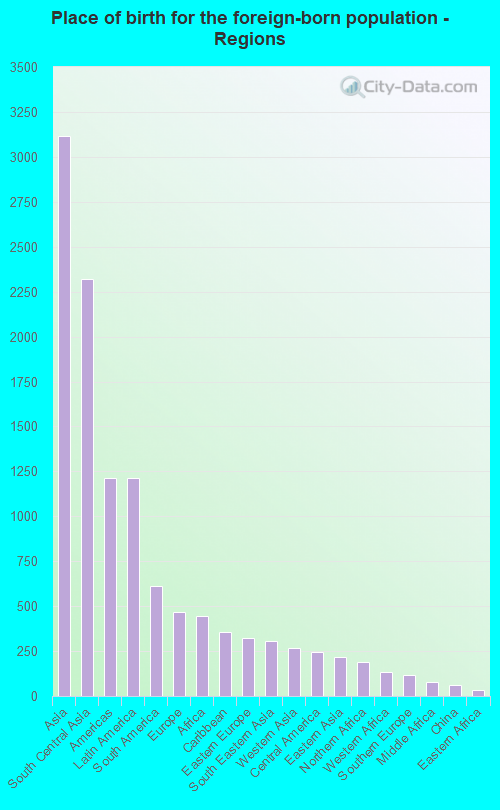
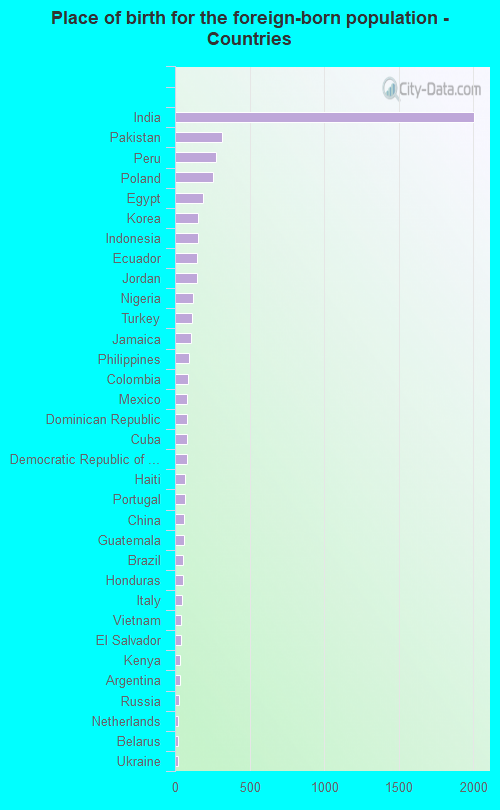
According to 2022 data, the most numerous races in Avenel, NJ are White alone (5,704 residents), Hispanic (3,777 residents), and Black alone (3,877 residents). 58.6% of Avenel residents speak English at home. 30.4% of Avenel, NJ residents are foreign-born (17.8% born in Asia, 6.9% born in Latin America), which is 24.3% greater than the foreign-born rate of 23.0% across the entire state of New Jersey.
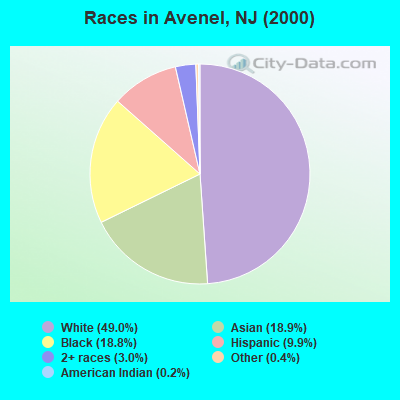
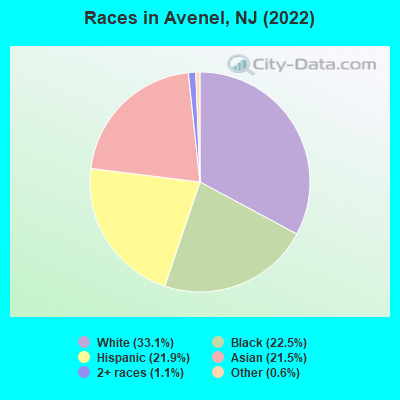
Race distribution in Avenel
2000 2022
5,557,209 66.0% White alone 1,117,191 13.3% Hispanic 1,096,171 13.0% Black alone 477,012 5.7% Asian alone 133,689 1.6% Two or more races 19,565 0.2% Other race alone 11,338 0.1% American Indian alone 2,175 0.03% Native Hawaiian and Other
4,766,476 51.5% White alone 2,028,470 21.9% Hispanic 1,111,632 12.0% Black alone 923,546 10.0% Asian alone 332,237 3.6% Two or more races 89,847 1.0% Other race alone 8,557 0.09% American Indian alone 934 0.01% Native Hawaiian and Other
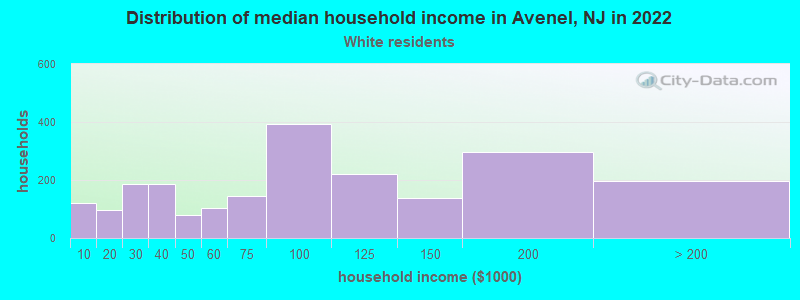
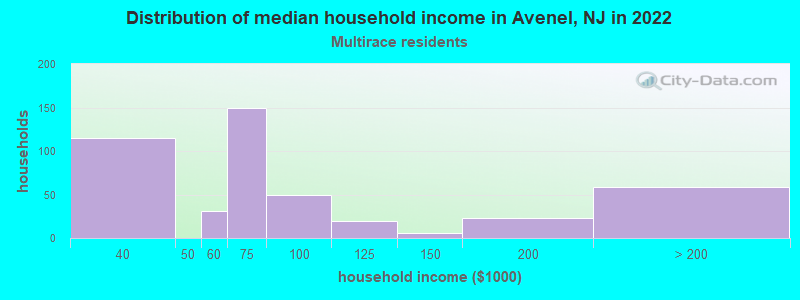
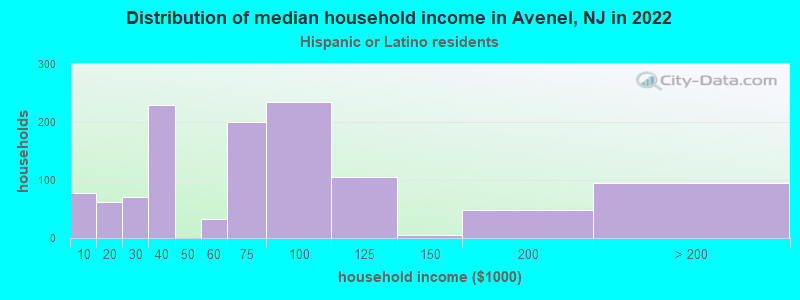
Income and house value in Avenel Median household income in 2022 $81,371 White non-Hispanic householders$91,757 Black householders$128,832 Asian householders$81,155 Some other race householders$69,066 Hispanic or Latino race householdersMedian 2022 house value $356,541 White Non-Hispanic householders$361,073 Black or African American householders $393,807 Asian householders$358,807 Some other race householders$363,339 Two or more races householders$368,879 Hispanic or Latino householders
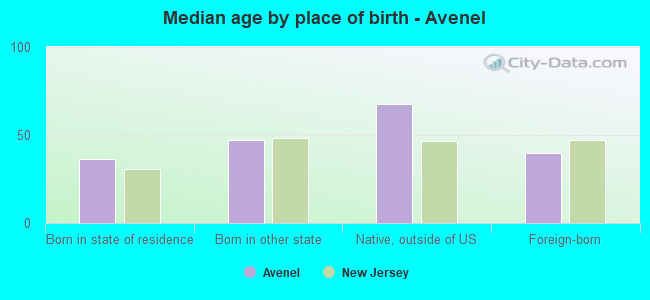
Median age by race in Avenel
48.6 Median age for White residents48.8 48.1 39.2 Median age for Black or African American residents40.7 37.5 14.8 Median age for American Indian / Alaska Native residents-624,624,624.0 38.8 33.3 Median age for Asian residents34.1 32.8 -939,393,938.5 Median age for Native Hawaiian / Pacific Islander residents-860,335,194.7 -713,070,378.3 30.1 Median age for Other race residents32.9 29.8 51.3 Median age for Two or more races residents35.3 56.6 49.4 Median age for White alone residents51.1 46.2 34.5 Median age for Hispanic or Latino residents31.4 38.0
Owner/renter occupied households by race in Avenel
House owners and renters - White residents 1,701 78.4% Owner occupied469 21.6% Renter occupiedHouse owners and renters - Black or African American residents 382 29.6% Owner occupied907 70.4% Renter occupiedHouse owners and renters - American Indian / Alaska Native residents 13 32.6% Owner occupied28 67.4% Renter occupiedHouse owners and renters - Asian residents 423 38.0% Owner occupied689 62.0% Renter occupiedHouse owners and renters - Other race residents 147 42.9% Owner occupied195 57.1% Renter occupiedHouse owners and renters - Two or more races residents 199 34.1% Owner occupied384 65.9% Renter occupiedHouse owners and renters - White alone residents 1,543 79.8% Owner occupied392 20.2% Renter occupiedHouse owners and renters - Hispanic or Latino residents 527 42.6% Owner occupied709 57.4% Renter occupied
Language usage in Avenel
English speakers - Total 58.6% of residents of Avenel speak English at home.
14.6% of residents speak Spanish at home 1,507 63.7% Speak English very well859 36.3% Speak English less than very well26.4% of residents speak other language at home 2,969 69.4% Speak English very well1,310 30.6% Speak English less than very well
English speakers - Born in the United States 73.9% of residents of Avenel speak English at home.
18.2% of residents speak Spanish at home 517 100.0% Speak English very well6.4% of residents speak other language at home 182 100.0% Speak English very well
English speakers - Native, born elsewhere 27.2% of residents of Avenel speak English at home.
60.9% of residents speak Spanish at home 170 69.1% Speak English very well76 30.9% Speak English less than very well11.1% of residents speak other language at home 45 100.0% Speak English very well
English speakers - Foreign-born 14.7% of residents of Avenel speak English at home.
16.4% of residents speak Spanish at home 209 24.0% Speak English very well661 76.0% Speak English less than very well68.1% of residents speak other language at home 2,291 63.4% Speak English very well1,320 36.6% Speak English less than very well
White (Caucasian) - Speak only English Native:
90.3% (4,454)Foreign-born:
24.9% (243)
White (Caucasian) - Speak another language Native:
9.0% (444)Foreign-born:
76.5% (748)
Black or African American - Speak only English Native:
93.9% (3,342)Foreign-born:
41.0% (214)
Black or African American - Speak another language Native:
6.3% (225)Foreign-born:
58.8% (307)
Asian - Speak only English Native:
28.6% (157)Foreign-born:
7.1% (191)
Asian - Speak another language Native:
72.0% (394)Foreign-born:
92.8% (2,486)
Other race - Speak only English Native:
79.8% (432)Foreign-born:
16.2% (79)
Other race - Speak another language Native:
32.6% (177)Foreign-born:
86.8% (424)
Two or more races - Speak only English Native:
34.7% (459)Foreign-born:
10.6% (38)
Two or more races - Speak another language Native:
66.4% (879)Foreign-born:
89.5% (323)
White alone - Speak only English Native:
94.2% (4,278)Foreign-born:
16.5% (161)
White alone - Speak another language Native:
5.7% (261)Foreign-born:
82.9% (810)
Hispanic or Latino - Speak only English Native:
39.5% (946)Foreign-born:
23.2% (241)
Hispanic or Latino - Speak another language Native:
60.6% (1,451)Foreign-born:
82.4% (858)
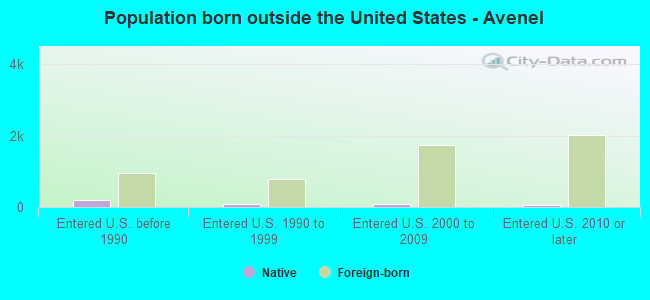
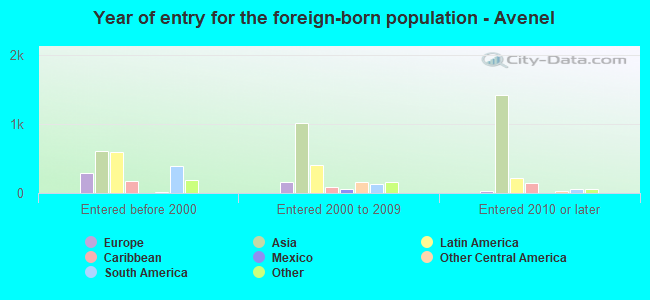
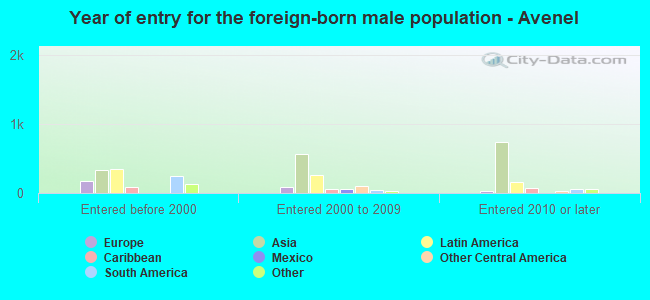
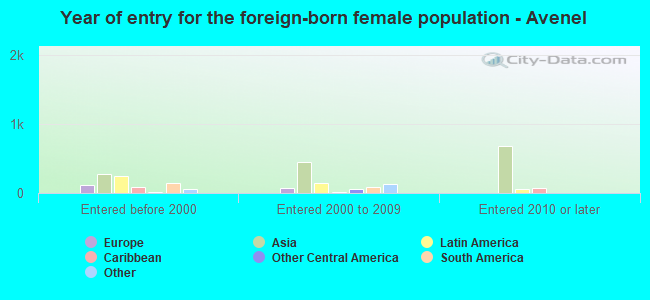
Foreign-born residents in Avenel 5,239 residents are foreign born (17.8% Asia , 6.9% Latin America ).
This city:
30.4%New Jersey:
23.2%
Marital status for residents in Avenel Marital status - White (Caucasian) population 15 years and over
Males 51.2% Never married32.0% Now married1.1% Separated4.6% Widowed11.2% DivorcedFemales 23.1% Never married46.0% Now married1.1% Separated15.8% Widowed14.0% DivorcedWomen who gave birth in the past 12 months Now married:
77.1% (99)Unmarried:
22.9% (29)
Women who did not give birth in the past 12 months Now married:
47.9% (429)Unmarried:
52.1% (467)
Marital status - Black or African American population 15 years and over
Males 52.8% Never married35.2% Now married5.5% Separated1.1% Widowed5.4% DivorcedFemales 40.1% Never married37.6% Now married4.1% Separated4.2% Widowed14.0% DivorcedWomen who gave birth in the past 12 months Now married:
76.1% (57)Unmarried:
23.9% (18)
Women who did not give birth in the past 12 months Now married:
41.2% (361)Unmarried:
58.8% (515)
Marital status - Asian population 15 years and over
Males 24.8% Never married74.6% Now married0.0% Separated0.0% Widowed0.6% DivorcedFemales 19.2% Never married70.9% Now married0.0% Separated6.9% Widowed3.1% DivorcedWomen who gave birth in the past 12 months Now married:
100.0% (86)Unmarried:
0.0% (0)
Women who did not give birth in the past 12 months Now married:
68.5% (606)Unmarried:
31.5% (279)
Marital status - Other race population 15 years and over
Males 39.3% Never married37.7% Now married13.8% Separated7.2% Widowed1.9% DivorcedFemales 16.4% Never married76.9% Now married0.0% Separated0.0% Widowed6.6% DivorcedWomen who gave birth in the past 12 months Now married:
100.0% (25)Unmarried:
0.0% (0)
Women who did not give birth in the past 12 months Now married:
73.3% (201)Unmarried:
26.7% (73)
Marital status - Two or more races population 15 years and over
Males 44.3% Never married33.6% Now married1.7% Separated0.0% Widowed20.4% DivorcedFemales 9.2% Never married30.4% Now married6.5% Separated0.8% Widowed53.1% DivorcedWomen who gave birth in the past 12 months Now married:
100.0% (9)Unmarried:
0.0% (0)
Women who did not give birth in the past 12 months Now married:
52.2% (111)Unmarried:
47.8% (102)
Marital status - White alone, not Hispanic / Latino population 15 years and over
Males 51.0% Never married31.5% Now married0.7% Separated5.5% Widowed11.2% DivorcedFemales 21.7% Never married49.6% Now married1.3% Separated14.0% Widowed13.4% DivorcedWomen who gave birth in the past 12 months Now married:
100.0% (116)Unmarried:
0.0% (0)
Women who did not give birth in the past 12 months Now married:
48.6% (414)Unmarried:
51.4% (437)
Marital status - Hispanic or Latino population 15 years and over
Males 48.2% Never married33.5% Now married5.1% Separated1.1% Widowed12.2% DivorcedFemales 25.5% Never married32.3% Now married6.2% Separated7.3% Widowed28.7% DivorcedWomen who gave birth in the past 12 months Now married:
41.0% (26)Unmarried:
59.0% (38)
Women who did not give birth in the past 12 months Now married:
44.9% (330)Unmarried:
55.1% (404)
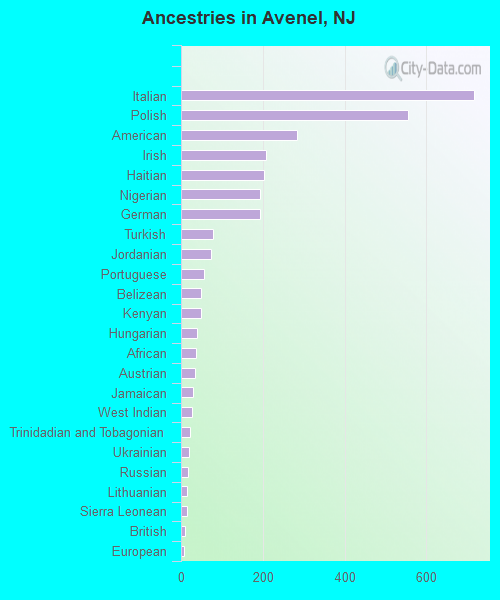
Ancestries in Avenel
717 7.8% Italian556 6.0% Polish283 3.1% American207 2.3% Irish204 2.2% Haitian194 2.1% Nigerian192 2.1% German79 0.9% Turkish74 0.8% Jordanian57 0.6% Portuguese50 0.5% Belizean48 0.5% Kenyan38 0.4% Hungarian36 0.4% African33 0.4% Austrian29 0.3% Jamaican26 0.3% West Indian21 0.2% Trinidadian and Tobagonian19 0.2% Ukrainian17 0.2% Russian15 0.2% Lithuanian15 0.2% Sierra Leonean10 0.1% British7 0.08% European
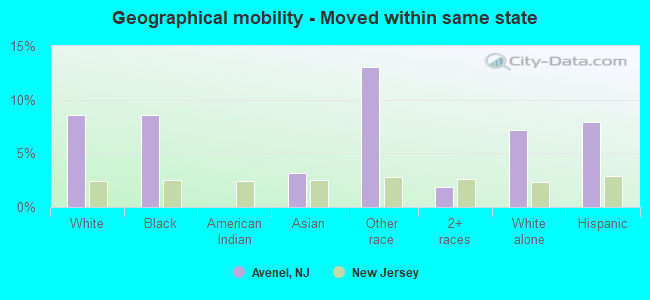
Geographical mobility in Avenel Same house 1 year ago 4,795 79.3% White (Caucasian)3,079 70.2% Black or African American13 16.1% American Indian / Alaska Native2,844 77.6% Asian987 85.0% Other race1,757 100.0% Two or more races4,427 78.6% White alone, not Hispanic / Latino3,033 81.4% Hispanic or LatinoMoved within same county 508 8.4% White / Caucasian604 13.8% Black or African American36 45.5% American Indian / Alaska Native362 9.9% Asian1 0.1% Other race613 10.9% White alone, not Hispanic / Latino219 5.9% Hispanic or LatinoMoved within same state 519 8.6% White / Caucasian376 8.6% Black or African American115 3.1% Asian151 13.0% Other race33 1.9% Two or more races402 7.1% White alone, not Hispanic / Latino295 7.9% Hispanic or LatinoMoved from different state 96 1.6% White / Caucasian415 9.5% Black or African American29 36.4% American Indian / Alaska Native146 4.0% Asian20 1.8% Other race114 2.0% White alone, not Hispanic / Latino48 1.3% Hispanic or LatinoMoved from abroad 10 0.2% White93 2.5% Asian32 0.9% Hispanic or Latino
Children Nativity (place of birth) in Avenel
Children under 6 years - Living with two parents Both parents native 170 100.0% NativeBoth parents foreign-born 406 79.7% Native103 20.3% Foreign-bornOne native, one foreign-born parent 321 100.0% NativeChildren under 6 years - Living with one parent Native parent 73 100.0% NativeForeign-born parent 121 100.0% NativeChildren 6 to 17 years - Living with two parents Both parents native 348 100.0% NativeBoth parents foreign-born 354 51.4% Native335 48.6% Foreign-bornOne native, one foreign-born parent 171 100.0% NativeChildren 6 to 17 years - Living with one parent Native parent 530 100.0% NativeForeign-born parent 256 53.7% Native221 46.3% Foreign-born
Grandparents responsible for own grandchildren in Avenel
Grandparents (30 to 59 years) Asian 26 100.0% Not responsible for grandchildrenGrandparents (60 years and over) Asian 14 15.9% Responsible for grandchildren75 84.1% Not responsible for grandchildren