Races in Avondale Estates, Georgia (GA) Detailed Stats
Data:
Races - White alone (%)
Races - White alone (% change since 2000)
Races - Black alone (%)
Races - Black alone (% change since 2000)
Races - American Indian alone (%)
Races - American Indian alone (% change since 2000)
Races - Asian alone (%)
Races - Asian alone (% change since 2000)
Races - Hispanic (%)
Races - Hispanic (% change since 2000)
Races - Native Hawaiian and Other Pacific Islander alone (%)
Races - Native Hawaiian and Other Pacific Islander alone (% change since 2000)
Races - Two or more races(%)
Races - Two or more races(% change since 2000)
Races - Other race alone (%)
Races - Other race alone (% change since 2000)
Racial diversity
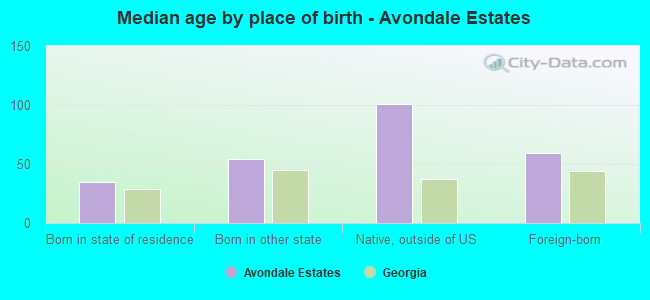
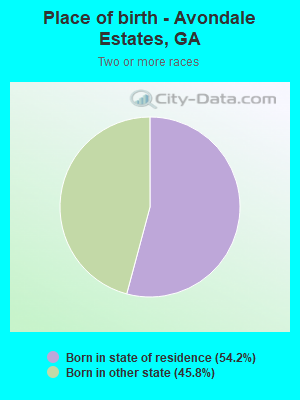
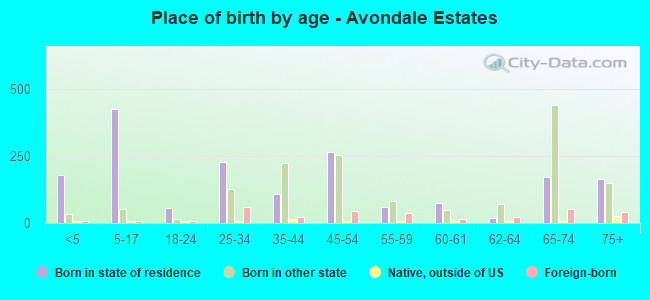
Place of birth - Born in state of residence (%)
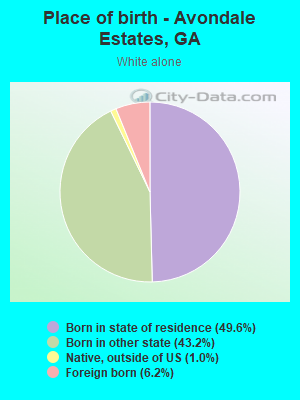
Place of birth - Born in state of residence (%) - White
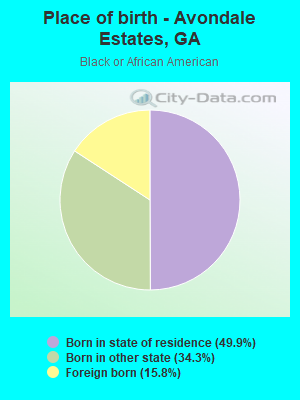
Place of birth - Born in state of residence (%) - Black or African American
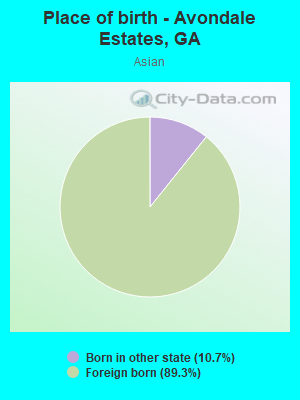
Place of birth - Born in state of residence (%) - Asian
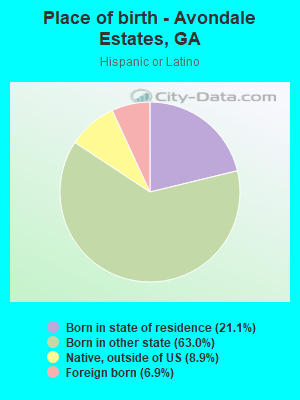
Place of birth - Born in state of residence (%) - Hispanic or Latino
Place of birth - Born in state of residence (%) - American Indian and Alaska Native
Place of birth - Born in state of residence (%) - Multirace
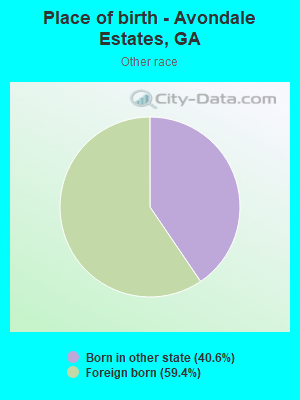
Place of birth - Born in state of residence (%) - Other Race
Place of birth - Born in other state (%)
Place of birth - Born in other state (%) - White
Place of birth - Born in other state (%) - Black or African American
Place of birth - Born in other state (%) - Asian
Place of birth - Born in other state (%) - Hispanic or Latino
Place of birth - Born in other state (%) - American Indian and Alaska Native
Place of birth - Born in other state (%) - Multirace
Place of birth - Born in other state (%) - Other Race
Place of birth - Native, outside of US (%)
Place of birth - Native, outside of US (%) - White
Place of birth - Native, outside of US (%) - Black or African American
Place of birth - Native, outside of US (%) - Asian
Place of birth - Native, outside of US (%) - Hispanic or Latino
Place of birth - Native, outside of US (%) - American Indian and Alaska Native
Place of birth - Native, outside of US (%) - Multirace
Place of birth - Native, outside of US (%) - Other Race
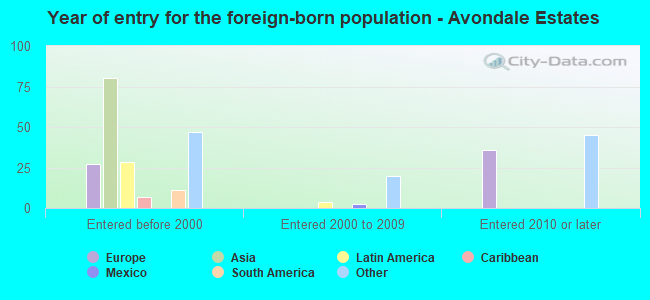
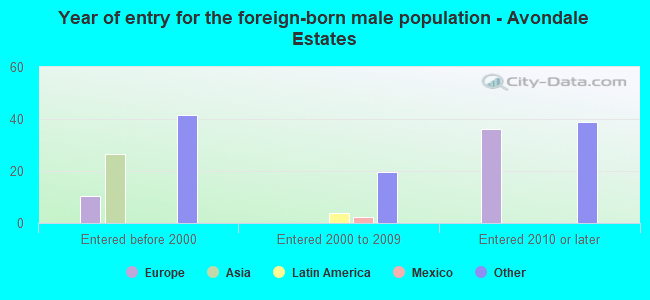
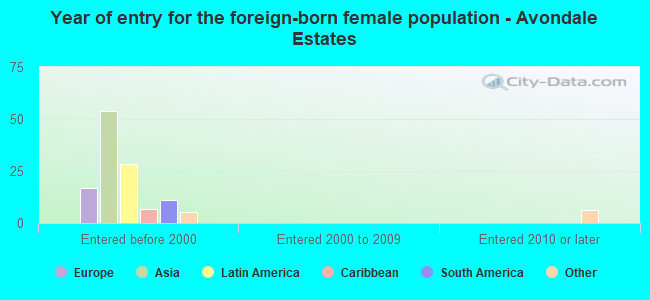
Place of birth - Foreign born (%)
Place of birth - Foreign born (%) - White
Place of birth - Foreign born (%) - Black or African American
Place of birth - Foreign born (%) - Asian
Place of birth - Foreign born (%) - Hispanic or Latino
Place of birth - Foreign born (%) - American Indian and Alaska Native
Place of birth - Foreign born (%) - Multirace
Place of birth - Foreign born (%) - Other Race
Residents speaking English at home (%)
Residents speaking English at home - Born in the United States (%)
Residents speaking English at home - Native, born elsewhere (%)
Residents speaking English at home - Foreign born (%)
Residents speaking Spanish at home (%)
Residents speaking Spanish at home - Born in the United States (%)
Residents speaking Spanish at home - Native, born elsewhere (%)
Residents speaking Spanish at home - Foreign born (%)
Residents speaking other language at home (%)
Residents speaking other language at home - Born in the United States (%)
Residents speaking other language at home - Native, born elsewhere (%)
Residents speaking other language at home - Foreign born (%)
Marital status - Never married (%)
Marital status - Now married (%)
Marital status - Separated (%)
Marital status - Widowed (%)
Marital status - Divorced (%)
Ancestries Reported - Arab (%)
Ancestries Reported - Czech (%)
Ancestries Reported - Danish (%)
Ancestries Reported - Dutch (%)
Ancestries Reported - English (%)
Ancestries Reported - French (%)
Ancestries Reported - French Canadian (%)
Ancestries Reported - German (%)
Ancestries Reported - Greek (%)
Ancestries Reported - Hungarian (%)
Ancestries Reported - Irish (%)
Ancestries Reported - Italian (%)
Ancestries Reported - Lithuanian (%)
Ancestries Reported - Norwegian (%)
Ancestries Reported - Polish (%)
Ancestries Reported - Portuguese (%)
Ancestries Reported - Russian (%)
Ancestries Reported - Scotch-Irish (%)
Ancestries Reported - Scottish (%)
Ancestries Reported - Slovak (%)
Ancestries Reported - Subsaharan African (%)
Ancestries Reported - Swedish (%)
Ancestries Reported - Swiss (%)
Ancestries Reported - Ukrainian (%)
Ancestries Reported - United States (%)
Ancestries Reported - Welsh (%)
Ancestries Reported - West Indian (%)
Ancestries Reported - Other (%)
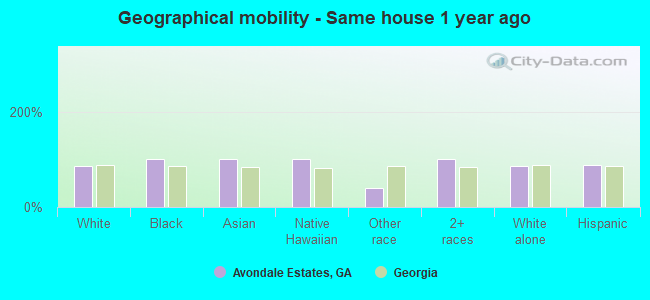
Geographical mobility - Same house 1 year ago (%)
Geographical mobility - Same house 1 year ago (%) - White
Geographical mobility - Same house 1 year ago (%) - Black or African American
Geographical mobility - Same house 1 year ago (%) - Asian
Geographical mobility - Same house 1 year ago (%) - Hispanic or Latino
Geographical mobility - Same house 1 year ago (%) - American Indian and Alaska Native
Geographical mobility - Same house 1 year ago (%) - Multirace
Geographical mobility - Same house 1 year ago (%) - Other Race
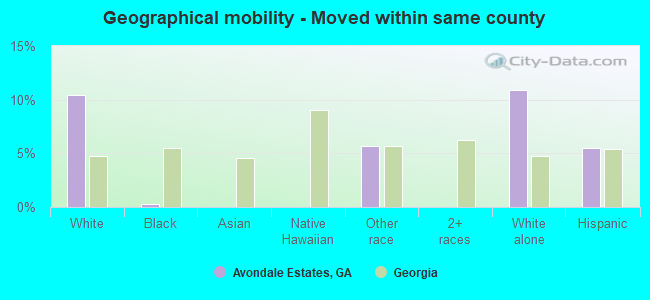
Geographical mobility - Moved within same county (%)
Geographical mobility - Moved within same county (%) - White
Geographical mobility - Moved within same county (%) - Black or African American
Geographical mobility - Moved within same county (%) - Asian
Geographical mobility - Moved within same county (%) - Hispanic or Latino
Geographical mobility - Moved within same county (%) - American Indian and Alaska Native
Geographical mobility - Moved within same county (%) - Multirace
Geographical mobility - Moved within same county (%) - Other Race
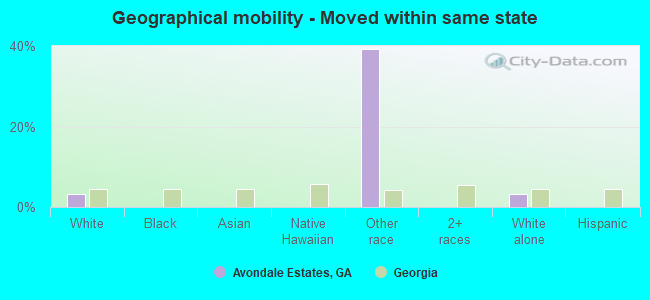
Geographical mobility - Moved from different county within same state (%)
Geographical mobility - Moved from different county within same state (%) - White
Geographical mobility - Moved from different county within same state (%) - Black or African American
Geographical mobility - Moved from different county within same state (%) - Asian
Geographical mobility - Moved from different county within same state (%) - Hispanic or Latino
Geographical mobility - Moved from different county within same state (%) - American Indian and Alaska Native
Geographical mobility - Moved from different county within same state (%) - Multirace
Geographical mobility - Moved from different county within same state (%) - Other Race
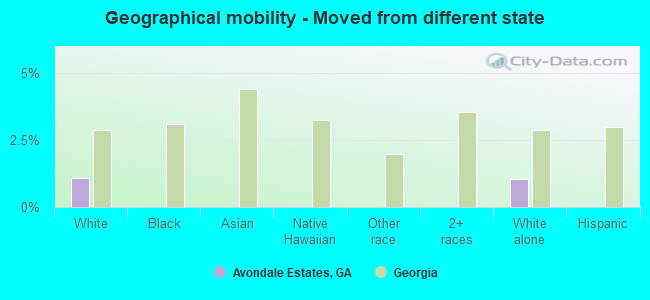
Geographical mobility - Moved from different state (%)
Geographical mobility - Moved from different state (%) - White
Geographical mobility - Moved from different state (%) - Black or African American
Geographical mobility - Moved from different state (%) - Asian
Geographical mobility - Moved from different state (%) - Hispanic or Latino
Geographical mobility - Moved from different state (%) - American Indian and Alaska Native
Geographical mobility - Moved from different state (%) - Multirace
Geographical mobility - Moved from different state (%) - Other Race
Geographical mobility - Moved from abroad (%)
Geographical mobility - Moved from abroad (%) - White
Geographical mobility - Moved from abroad (%) - Black or African American
Geographical mobility - Moved from abroad (%) - Asian
Geographical mobility - Moved from abroad (%) - Hispanic or Latino
Geographical mobility - Moved from abroad (%) - American Indian and Alaska Native
Geographical mobility - Moved from abroad (%) - Multirace
Geographical mobility - Moved from abroad (%) - Other Race
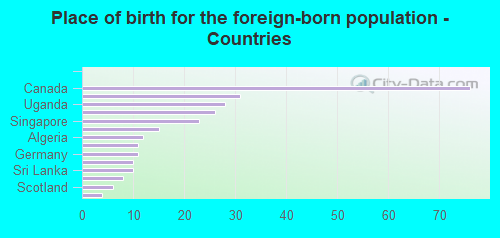
Place of birth for the foreign-born population - Ireland (%)
Place of birth for the foreign-born population - Denmark (%)
Place of birth for the foreign-born population - Norway (%)
Place of birth for the foreign-born population - Sweden (%)
Place of birth for the foreign-born population - United Kingdom (%)
Place of birth for the foreign-born population - England (%)
Place of birth for the foreign-born population - Scotland (%)
Place of birth for the foreign-born population - Other Northern Europe (%)
Place of birth for the foreign-born population - Austria (%)
Place of birth for the foreign-born population - Belgium (%)
Place of birth for the foreign-born population - France (%)
Place of birth for the foreign-born population - Germany (%)
Place of birth for the foreign-born population - Netherlands (%)
Place of birth for the foreign-born population - Switzerland (%)
Place of birth for the foreign-born population - Other Western Europe (%)
Place of birth for the foreign-born population - Greece (%)
Place of birth for the foreign-born population - Italy (%)
Place of birth for the foreign-born population - Portugal (%)
Place of birth for the foreign-born population - Spain (%)
Place of birth for the foreign-born population - Other Southern Europe (%)
Place of birth for the foreign-born population - Albania (%)
Place of birth for the foreign-born population - Belarus (%)
Place of birth for the foreign-born population - Bosnia and Herzegovina (%)
Place of birth for the foreign-born population - Bulgaria (%)
Place of birth for the foreign-born population - Croatia (%)
Place of birth for the foreign-born population - Czechoslovakia (%)
Place of birth for the foreign-born population - Hungary (%)
Place of birth for the foreign-born population - Latvia (%)
Place of birth for the foreign-born population - Lithuania (%)
Place of birth for the foreign-born population - North Macedonia (Macedonia) (%)
Place of birth for the foreign-born population - Moldova (%)
Place of birth for the foreign-born population - Poland (%)
Place of birth for the foreign-born population - Romania (%)
Place of birth for the foreign-born population - Russia (%)
Place of birth for the foreign-born population - Serbia (%)
Place of birth for the foreign-born population - Ukraine (%)
Place of birth for the foreign-born population - Other Eastern Europe (%)
Place of birth for the foreign-born population - China (%)
Place of birth for the foreign-born population - Hong Kong (%)
Place of birth for the foreign-born population - Taiwan (%)
Place of birth for the foreign-born population - Japan (%)
Place of birth for the foreign-born population - Korea (%)
Place of birth for the foreign-born population - Other Eastern Asia (%)
Place of birth for the foreign-born population - Afghanistan (%)
Place of birth for the foreign-born population - Bangladesh (%)
Place of birth for the foreign-born population - India (%)
Place of birth for the foreign-born population - Iran (%)
Place of birth for the foreign-born population - Kazakhstan (%)
Place of birth for the foreign-born population - Nepal (%)
Place of birth for the foreign-born population - Pakistan (%)
Place of birth for the foreign-born population - Sri Lanka (%)
Place of birth for the foreign-born population - Uzbekistan (%)
Place of birth for the foreign-born population - Other South Central Asia (%)
Place of birth for the foreign-born population - Burma (%)
Place of birth for the foreign-born population - Cambodia (%)
Place of birth for the foreign-born population - Indonesia (%)
Place of birth for the foreign-born population - Laos (%)
Place of birth for the foreign-born population - Malaysia (%)
Place of birth for the foreign-born population - Philippines (%)
Place of birth for the foreign-born population - Singapore (%)
Place of birth for the foreign-born population - Thailand (%)
Place of birth for the foreign-born population - Vietnam (%)
Place of birth for the foreign-born population - Other South Eastern Asia (%)
Place of birth for the foreign-born population - Armenia (%)
Place of birth for the foreign-born population - Iraq (%)
Place of birth for the foreign-born population - Israel (%)
Place of birth for the foreign-born population - Jordan (%)
Place of birth for the foreign-born population - Kuwait (%)
Place of birth for the foreign-born population - Lebanon (%)
Place of birth for the foreign-born population - Saudi Arabia (%)
Place of birth for the foreign-born population - Syria (%)
Place of birth for the foreign-born population - Turkey (%)
Place of birth for the foreign-born population - Yemen (%)
Place of birth for the foreign-born population - Other Western Asia (%)
Place of birth for the foreign-born population - Eritrea (%)
Place of birth for the foreign-born population - Ethiopia (%)
Place of birth for the foreign-born population - Kenya (%)
Place of birth for the foreign-born population - Somalia (%)
Place of birth for the foreign-born population - Uganda (%)
Place of birth for the foreign-born population - Zimbabwe (%)
Place of birth for the foreign-born population - Other Eastern Africa (%)
Place of birth for the foreign-born population - Cameroon (%)
Place of birth for the foreign-born population - Congo (%)
Place of birth for the foreign-born population - Democratic Republic of Congo (Zaire) (%)
Place of birth for the foreign-born population - Other Middle Africa (%)
Place of birth for the foreign-born population - Egypt (%)
Place of birth for the foreign-born population - Morocco (%)
Place of birth for the foreign-born population - Sudan (%)
Place of birth for the foreign-born population - Other Northern Africa (%)
Place of birth for the foreign-born population - South Africa (%)
Place of birth for the foreign-born population - Other Southern Africa (%)
Place of birth for the foreign-born population - Cabo Verde (%)
Place of birth for the foreign-born population - Ghana (%)
Place of birth for the foreign-born population - Liberia (%)
Place of birth for the foreign-born population - Nigeria (%)
Place of birth for the foreign-born population - Senegal (%)
Place of birth for the foreign-born population - Sierra Leone (%)
Place of birth for the foreign-born population - Other Western Africa (%)
Place of birth for the foreign-born population - Australia (%)
Place of birth for the foreign-born population - New Zealand (%)
Place of birth for the foreign-born population - Fiji (%)
Place of birth for the foreign-born population - Micronesia (%)
Place of birth for the foreign-born population - Bahamas (%)
Place of birth for the foreign-born population - Barbados (%)
Place of birth for the foreign-born population - Cuba (%)
Place of birth for the foreign-born population - Dominica (%)
Place of birth for the foreign-born population - Dominican Republic (%)
Place of birth for the foreign-born population - Grenada (%)
Place of birth for the foreign-born population - Haiti (%)
Place of birth for the foreign-born population - Jamaica (%)
Place of birth for the foreign-born population - St. Vincent and the Grenadines (%)
Place of birth for the foreign-born population - Trinidad and Tobago (%)
Place of birth for the foreign-born population - West Indies (%)
Place of birth for the foreign-born population - Other Caribbean (%)
Place of birth for the foreign-born population - Belize (%)
Place of birth for the foreign-born population - Costa Rica (%)
Place of birth for the foreign-born population - El Salvador (%)
Place of birth for the foreign-born population - Guatemala (%)
Place of birth for the foreign-born population - Honduras (%)
Place of birth for the foreign-born population - Mexico (%)
Place of birth for the foreign-born population - Nicaragua (%)
Place of birth for the foreign-born population - Panama (%)
Place of birth for the foreign-born population - Other Central America (%)
Place of birth for the foreign-born population - Argentina (%)
Place of birth for the foreign-born population - Bolivia (%)
Place of birth for the foreign-born population - Brazil (%)
Place of birth for the foreign-born population - Chile (%)
Place of birth for the foreign-born population - Colombia (%)
Place of birth for the foreign-born population - Ecuador (%)
Place of birth for the foreign-born population - Guyana (%)
Place of birth for the foreign-born population - Peru (%)
Place of birth for the foreign-born population - Uruguay (%)
Place of birth for the foreign-born population - Venezuela (%)
Place of birth for the foreign-born population - Other South America (%)
Place of birth for the foreign-born population - Canada (%)
Place of birth for the foreign-born population - Other Northern America (%)
Place of birth for the foreign-born population - Other (%)
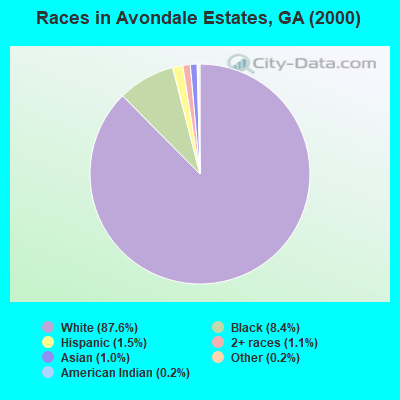
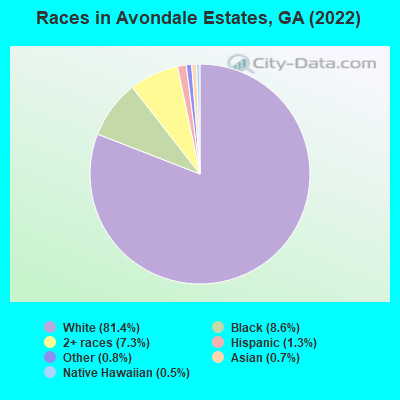
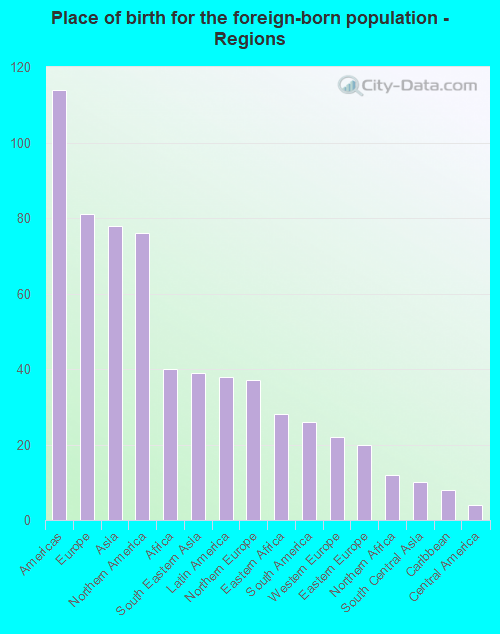
According to 2022 data, the most numerous races in Avondale Estates, GA are White alone (2,859 residents), Black alone (303 residents), and Hispanic (44 residents). 95.9% of Avondale Estates residents speak English at home. 9.0% of Avondale Estates, GA residents are foreign-born (2.2% born in Europe, 2.1% born in Asia, 2.1% born in North America, 1.1% born in Africa, 1.1% born in Latin America), which is 11.6% less than the foreign-born rate of 10.0% across the entire state of Georgia.
Race distribution in Avondale Estates
2000 2022
5,128,661 62.6% White alone 2,331,465 28.5% Black alone 435,227 5.3% Hispanic 171,513 2.1% Asian alone 87,364 1.1% Two or more races 17,670 0.2% American Indian alone 11,275 0.1% Other race alone 3,278 0.04% Native Hawaiian and Other
5,415,657 49.6% White alone 3,349,240 30.7% Black alone 1,132,604 10.4% Hispanic 479,156 4.4% Asian alone 462,923 4.2% Two or more races 54,416 0.5% Other race alone 11,923 0.1% American Indian alone 6,957 0.06% Native Hawaiian and Other
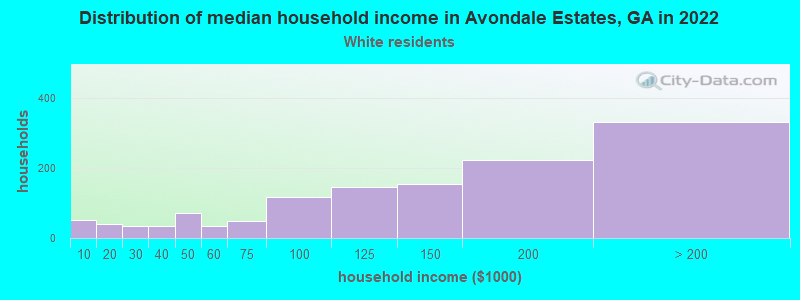
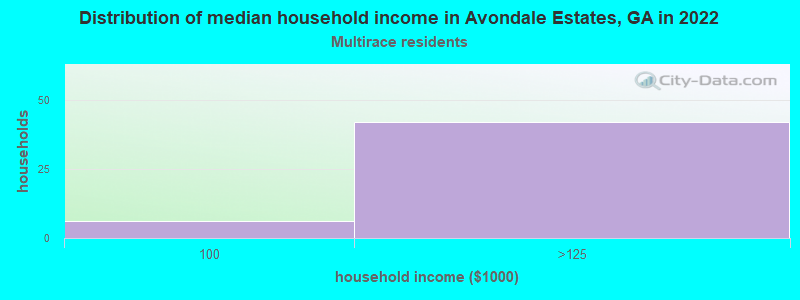
Income and house value in Avondale Estates Median household income in 2022 $143,786 White non-Hispanic householders$124,488 Black householdersMedian 2022 house value $607,713 White Non-Hispanic householders$354,377 Black or African American householders $549,138 Asian householders
Median age by race in Avondale Estates
51.2 Median age for White residents50.3 52.2 56.3 Median age for Black or African American residents43.7 66.3 -631,178,706.6 Median age for American Indian / Alaska Native residents-658,914,728.0 -565,432,098.2 53.3 Median age for Asian residents-672,601,384.1 -696,078,430.7 15.4 Median age for Native Hawaiian / Pacific Islander residents-693,227,090.9 -776,776,776.0 53.6 Median age for Other race residents-738,983,050.1 -659,599,528.2 30.5 Median age for Two or more races residents28.6 28.8 50.5 Median age for White alone residents50.2 51.0 36.8 Median age for Hispanic or Latino residents54.3 -674,448,767.2
Owner/renter occupied households by race in Avondale Estates
House owners and renters - White residents 1,168 90.5% Owner occupied122 9.5% Renter occupiedHouse owners and renters - Black or African American residents 125 80.2% Owner occupied31 19.8% Renter occupiedHouse owners and renters - Asian residents 2 100.0% Owner occupiedHouse owners and renters - Two or more races residents 8 25.3% Owner occupied24 74.7% Renter occupiedHouse owners and renters - White alone residents 1,167 90.0% Owner occupied129 10.0% Renter occupiedHouse owners and renters - Hispanic or Latino residents 7 100.0% Owner occupied
Language usage in Avondale Estates
English speakers - Total 95.9% of residents of Avondale Estates speak English at home.
0.9% of residents speak Spanish at home 29 100.0% Speak English very well4.1% of residents speak other language at home 135 100.0% Speak English very well
English speakers - Born in the United States 97.6% of residents of Avondale Estates speak English at home.
0.7% of residents speak Spanish at home 10 100.0% Speak English very well1.5% of residents speak other language at home 21 100.0% Speak English very well
English speakers - Native, born elsewhere 73.5% of residents of Avondale Estates speak English at home.
11.8% of residents speak Spanish at home 4 100.0% Speak English very well
English speakers - Foreign-born 75.1% of residents of Avondale Estates speak English at home.
3.8% of residents speak Spanish at home 11 100.0% Speak English very well28.0% of residents speak other language at home 82 100.0% Speak English very well
White (Caucasian) - Speak only English Native:
100.0% (2,488)Foreign-born:
100.0% (110)
White (Caucasian) - Speak another language Native:
1.6% (39)Foreign-born:
18.9% (21)
Black or African American - Speak only English Native:
99.5% (256)Foreign-born:
39.4% (19)
Asian - Speak another language Native:
97.1% (2)Foreign-born:
40.9% (9)
Other race - Speak only English Native:
64.2% (19)Foreign-born:
74.7% (26)
White alone - Speak only English Native:
98.6% (2,479)Foreign-born:
70.2% (123)
White alone - Speak another language Native:
1.7% (43)Foreign-born:
22.5% (40)
Hispanic or Latino - Speak only English Native:
100.0% (34)Foreign-born:
100.0% (4)
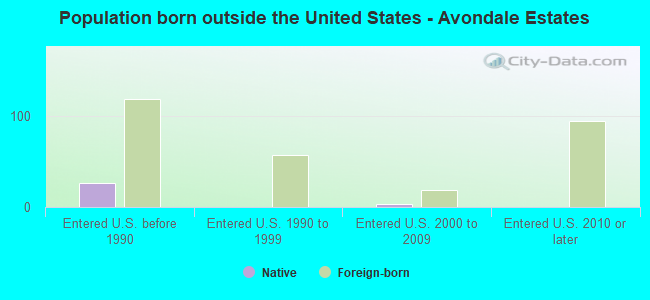
Foreign-born residents in Avondale Estates 315 residents are foreign born (2.2% Europe , 2.1% Asia , 2.1% North America , 1.1% Africa , 1.1% Latin America ).
This city:
9.0%Georgia:
10.4%
Marital status for residents in Avondale Estates Marital status - White (Caucasian) population 15 years and over
Males 26.0% Never married63.5% Now married0.0% Separated1.9% Widowed8.6% DivorcedFemales 18.9% Never married60.2% Now married0.0% Separated8.5% Widowed12.4% DivorcedWomen who gave birth in the past 12 months Now married:
55.8% (23)Unmarried:
44.2% (18)
Women who did not give birth in the past 12 months Now married:
75.1% (317)Unmarried:
24.9% (105)
Marital status - Black or African American population 15 years and over
Males 60.9% Never married38.3% Now married0.0% Separated0.0% Widowed0.8% DivorcedFemales 36.5% Never married26.4% Now married0.0% Separated10.8% Widowed26.4% DivorcedMarital status - Asian population 15 years and over
Males 60.0% Never married40.0% Now married0.0% Separated0.0% Widowed0.0% DivorcedFemales 0.0% Never married100.0% Now married0.0% Separated0.0% Widowed0.0% DivorcedWomen who did not give birth in the past 12 months Now married:
100.0% (2)Unmarried:
0.0% (0)
Marital status - Native Hawaiian / Pacific Islander population 15 years and over
Males 100.0% Never married0.0% Now married0.0% Separated0.0% Widowed0.0% DivorcedFemales 100.0% Never married0.0% Now married0.0% Separated0.0% Widowed0.0% DivorcedWomen who did not give birth in the past 12 months Now married:
0.0% (0)Unmarried:
100.0% (5)
Marital status - Other race population 15 years and over
Males 0.0% Never married100.0% Now married0.0% Separated0.0% Widowed0.0% DivorcedFemales 51.5% Never married0.0% Now married0.0% Separated0.0% Widowed48.5% DivorcedWomen who did not give birth in the past 12 months Now married:
0.0% (0)Unmarried:
100.0% (49)
Marital status - Two or more races population 15 years and over
Males 78.5% Never married21.5% Now married0.0% Separated0.0% Widowed0.0% DivorcedFemales 63.1% Never married36.9% Now married0.0% Separated0.0% Widowed0.0% DivorcedWomen who did not give birth in the past 12 months Now married:
36.9% (25)Unmarried:
63.1% (43)
Marital status - White alone, not Hispanic / Latino population 15 years and over
Males 26.1% Never married63.4% Now married0.0% Separated1.9% Widowed8.6% DivorcedFemales 18.9% Never married60.2% Now married0.0% Separated8.5% Widowed12.4% DivorcedWomen who gave birth in the past 12 months Now married:
55.8% (24)Unmarried:
44.2% (19)
Women who did not give birth in the past 12 months Now married:
75.1% (332)Unmarried:
24.9% (110)
Marital status - Hispanic or Latino population 15 years and over
Males 0.0% Never married100.0% Now married0.0% Separated0.0% Widowed0.0% DivorcedFemales 100.0% Never married0.0% Now married0.0% Separated0.0% Widowed0.0% DivorcedWomen who did not give birth in the past 12 months Now married:
0.0% (0)Unmarried:
100.0% (11)
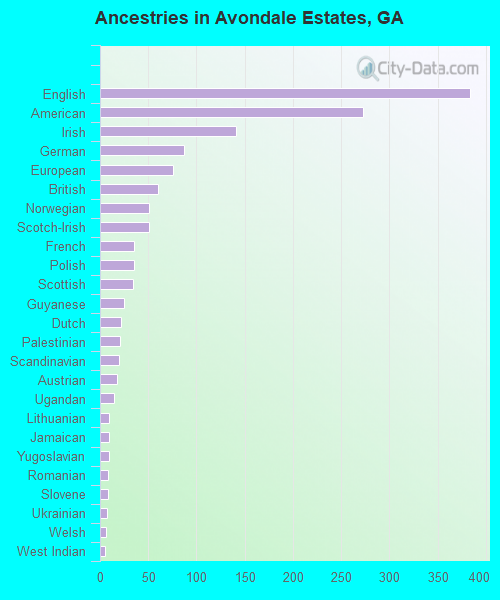
Ancestries in Avondale Estates
384 21.3% English273 15.1% American141 7.8% Irish87 4.8% German76 4.2% European60 3.3% British51 2.8% Norwegian51 2.8% Scotch-Irish35 1.9% French35 1.9% Polish34 1.9% Scottish25 1.4% Guyanese22 1.2% Dutch21 1.2% Palestinian20 1.1% Scandinavian18 1.0% Austrian15 0.8% Ugandan9 0.5% Lithuanian9 0.5% Jamaican9 0.5% Yugoslavian8 0.4% Romanian8 0.4% Slovene7 0.4% Ukrainian6 0.3% Welsh5 0.3% West Indian4 0.2% Lebanese2 0.1% Cajun1 0.06% Northern European
Children Nativity (place of birth) in Avondale Estates
Children under 6 years - Living with two parents Both parents native 192 100.0% NativeOne native, one foreign-born parent 50 100.0% NativeChildren 6 to 17 years - Living with two parents Both parents native 300 100.0% NativeOne native, one foreign-born parent 8 100.0% NativeChildren 6 to 17 years - Living with one parent Native parent 122 100.0% NativeForeign-born parent 12 46.0% Native15 54.0% Foreign-born
Grandparents responsible for own grandchildren in Avondale Estates
Grandparents (30 to 59 years) White / Caucasian 14 100.0% Responsible for grandchildrenBlack or African American 13 100.0% Not responsible for grandchildrenWhite alone, not Hispanic / Latino 14 100.0% Responsible for grandchildren
Grandparents (60 years and over) White / Caucasian 16 100.0% Not responsible for grandchildrenWhite alone, not Hispanic / Latino 17 100.0% Not responsible for grandchildren