Races in Baker, Nevada (NV) Detailed Stats
Ancestries, Foreign-born residents, place of birth

Data:
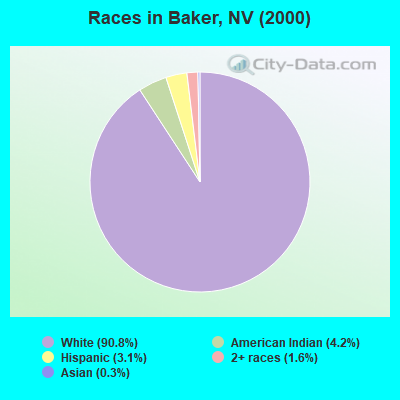
Race distribution in Baker

- 34790.8%White alone
- 164.2%American Indian alone
- 123.1%Hispanic
- 61.6%Two or more races
- 10.3%Asian alone
2000
2022
-
- 1,303,00165.2%White alone
- 393,97019.7%Hispanic
- 131,5096.6%Black alone
- 88,5934.4%Asian alone
- 49,2312.5%Two or more races
- 21,3971.1%American Indian alone
- 7,7690.4%Native Hawaiian and Other
Pacific Islander alone
- 2,7870.1%Other race alone
-
- 1,410,14544.4%White alone
- 961,35730.3%Hispanic
- 286,4719.0%Black alone
- 281,1498.8%Asian alone
- 182,1515.7%Two or more races
- 20,1020.6%Native Hawaiian and Other
Pacific Islander alone
- 18,7810.6%Other race alone
- 17,6160.6%American Indian alone
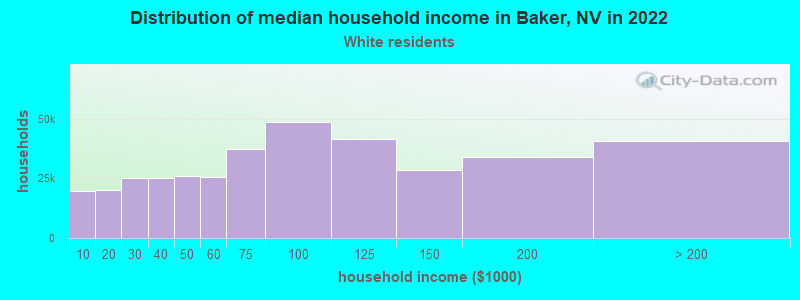
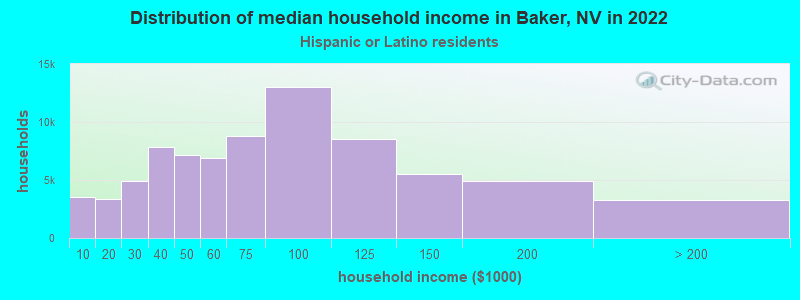
Income and house value in Baker
- Median household income in 2022
- $88,110White non-Hispanic householders
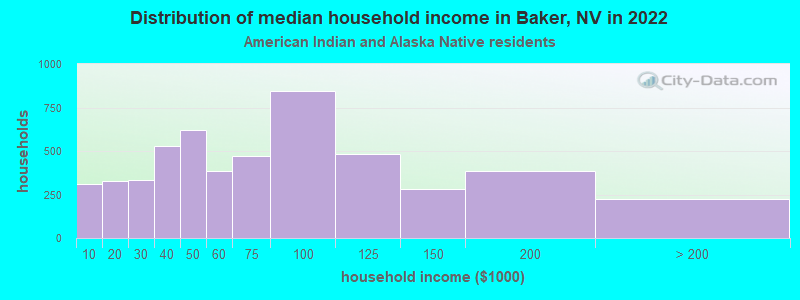
- $39,260American Indian and Alaska Native householders
- $54,848Some other race householders
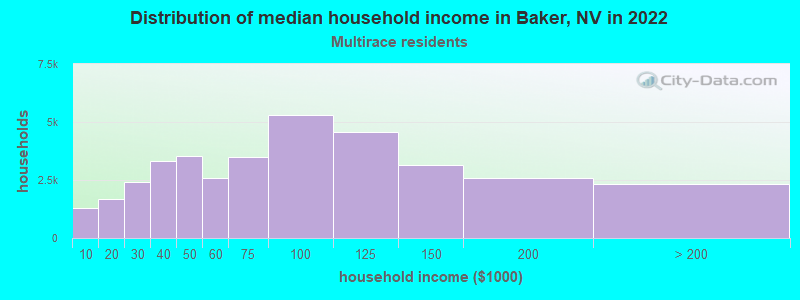
- $54,356Two or more races householders
- $67,051Hispanic or Latino race householders
- Median 2022 house value
- $572,731White Non-Hispanic householders
- $131,360American Indian or Alaska Native householders
- $297,750Two or more races householders