Races in Baldwin Park, California (CA) Detailed Stats
Data:
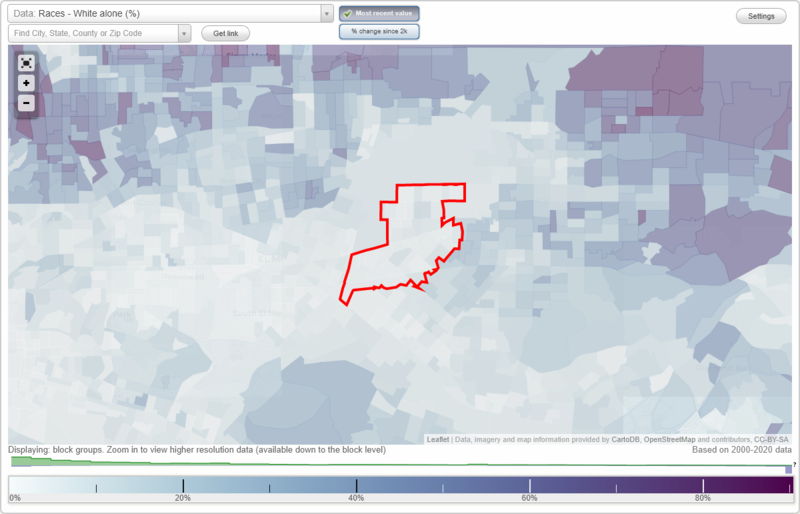
Races - White alone (%)
Races - White alone (% change since 2000)
Races - Black alone (%)
Races - Black alone (% change since 2000)
Races - American Indian alone (%)
Races - American Indian alone (% change since 2000)
Races - Asian alone (%)
Races - Asian alone (% change since 2000)
Races - Hispanic (%)
Races - Hispanic (% change since 2000)
Races - Native Hawaiian and Other Pacific Islander alone (%)
Races - Native Hawaiian and Other Pacific Islander alone (% change since 2000)
Races - Two or more races(%)
Races - Two or more races(% change since 2000)
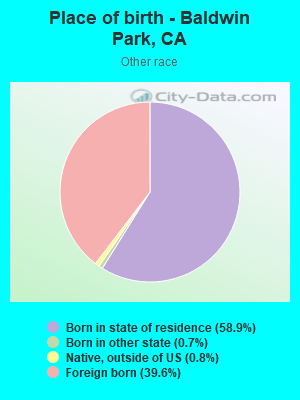
Races - Other race alone (%)
Races - Other race alone (% change since 2000)
Racial diversity
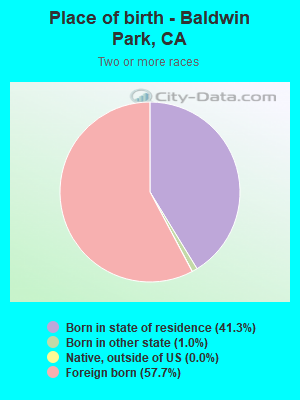
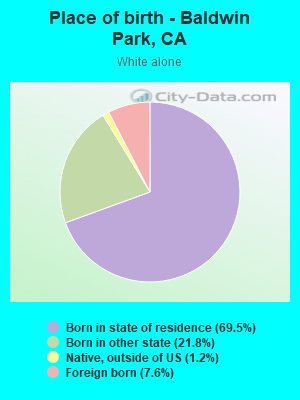
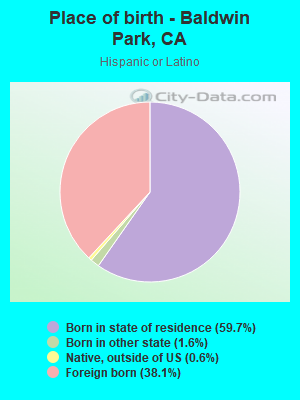
Place of birth - Born in state of residence (%)
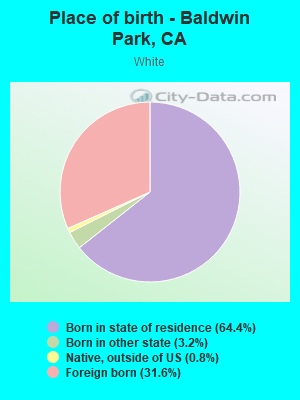
Place of birth - Born in state of residence (%) - White
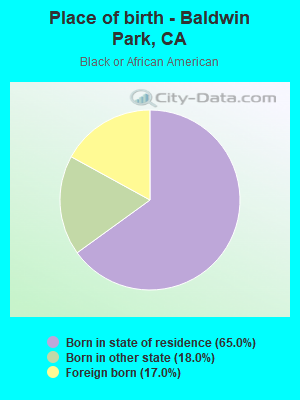
Place of birth - Born in state of residence (%) - Black or African American
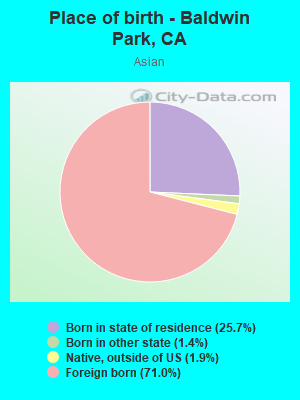
Place of birth - Born in state of residence (%) - Asian
Place of birth - Born in state of residence (%) - Hispanic or Latino
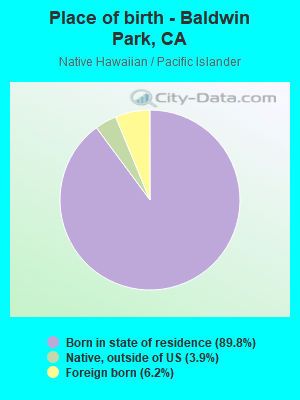
Place of birth - Born in state of residence (%) - American Indian and Alaska Native
Place of birth - Born in state of residence (%) - Multirace
Place of birth - Born in state of residence (%) - Other Race
Place of birth - Born in other state (%)
Place of birth - Born in other state (%) - White
Place of birth - Born in other state (%) - Black or African American
Place of birth - Born in other state (%) - Asian
Place of birth - Born in other state (%) - Hispanic or Latino
Place of birth - Born in other state (%) - American Indian and Alaska Native
Place of birth - Born in other state (%) - Multirace
Place of birth - Born in other state (%) - Other Race
Place of birth - Native, outside of US (%)
Place of birth - Native, outside of US (%) - White
Place of birth - Native, outside of US (%) - Black or African American
Place of birth - Native, outside of US (%) - Asian
Place of birth - Native, outside of US (%) - Hispanic or Latino
Place of birth - Native, outside of US (%) - American Indian and Alaska Native
Place of birth - Native, outside of US (%) - Multirace
Place of birth - Native, outside of US (%) - Other Race
Place of birth - Foreign born (%)
Place of birth - Foreign born (%) - White
Place of birth - Foreign born (%) - Black or African American
Place of birth - Foreign born (%) - Asian
Place of birth - Foreign born (%) - Hispanic or Latino
Place of birth - Foreign born (%) - American Indian and Alaska Native
Place of birth - Foreign born (%) - Multirace
Place of birth - Foreign born (%) - Other Race
Residents speaking English at home (%)
Residents speaking English at home - Born in the United States (%)
Residents speaking English at home - Native, born elsewhere (%)
Residents speaking English at home - Foreign born (%)
Residents speaking Spanish at home (%)
Residents speaking Spanish at home - Born in the United States (%)
Residents speaking Spanish at home - Native, born elsewhere (%)
Residents speaking Spanish at home - Foreign born (%)
Residents speaking other language at home (%)
Residents speaking other language at home - Born in the United States (%)
Residents speaking other language at home - Native, born elsewhere (%)
Residents speaking other language at home - Foreign born (%)
Marital status - Never married (%)
Marital status - Now married (%)
Marital status - Separated (%)
Marital status - Widowed (%)
Marital status - Divorced (%)
Ancestries Reported - Arab (%)
Ancestries Reported - Czech (%)
Ancestries Reported - Danish (%)
Ancestries Reported - Dutch (%)
Ancestries Reported - English (%)
Ancestries Reported - French (%)
Ancestries Reported - French Canadian (%)
Ancestries Reported - German (%)
Ancestries Reported - Greek (%)
Ancestries Reported - Hungarian (%)
Ancestries Reported - Irish (%)
Ancestries Reported - Italian (%)
Ancestries Reported - Lithuanian (%)
Ancestries Reported - Norwegian (%)
Ancestries Reported - Polish (%)
Ancestries Reported - Portuguese (%)
Ancestries Reported - Russian (%)
Ancestries Reported - Scotch-Irish (%)
Ancestries Reported - Scottish (%)
Ancestries Reported - Slovak (%)
Ancestries Reported - Subsaharan African (%)
Ancestries Reported - Swedish (%)
Ancestries Reported - Swiss (%)
Ancestries Reported - Ukrainian (%)
Ancestries Reported - United States (%)
Ancestries Reported - Welsh (%)
Ancestries Reported - West Indian (%)
Ancestries Reported - Other (%)
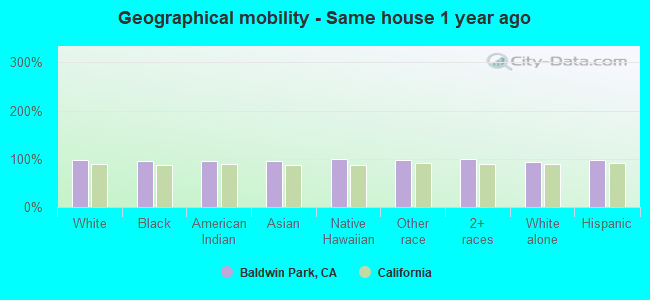
Geographical mobility - Same house 1 year ago (%)
Geographical mobility - Same house 1 year ago (%) - White
Geographical mobility - Same house 1 year ago (%) - Black or African American
Geographical mobility - Same house 1 year ago (%) - Asian
Geographical mobility - Same house 1 year ago (%) - Hispanic or Latino
Geographical mobility - Same house 1 year ago (%) - American Indian and Alaska Native
Geographical mobility - Same house 1 year ago (%) - Multirace
Geographical mobility - Same house 1 year ago (%) - Other Race
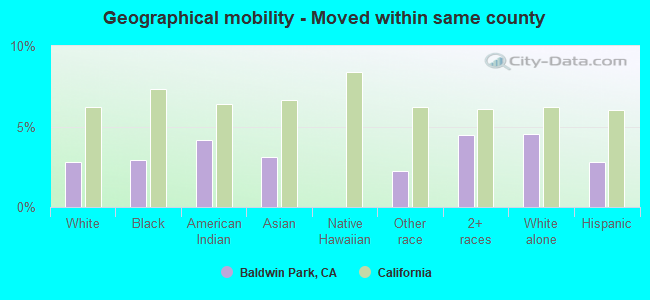
Geographical mobility - Moved within same county (%)
Geographical mobility - Moved within same county (%) - White
Geographical mobility - Moved within same county (%) - Black or African American
Geographical mobility - Moved within same county (%) - Asian
Geographical mobility - Moved within same county (%) - Hispanic or Latino
Geographical mobility - Moved within same county (%) - American Indian and Alaska Native
Geographical mobility - Moved within same county (%) - Multirace
Geographical mobility - Moved within same county (%) - Other Race
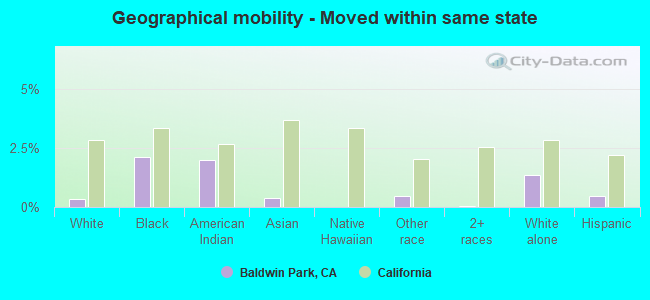
Geographical mobility - Moved from different county within same state (%)
Geographical mobility - Moved from different county within same state (%) - White
Geographical mobility - Moved from different county within same state (%) - Black or African American
Geographical mobility - Moved from different county within same state (%) - Asian
Geographical mobility - Moved from different county within same state (%) - Hispanic or Latino
Geographical mobility - Moved from different county within same state (%) - American Indian and Alaska Native
Geographical mobility - Moved from different county within same state (%) - Multirace
Geographical mobility - Moved from different county within same state (%) - Other Race
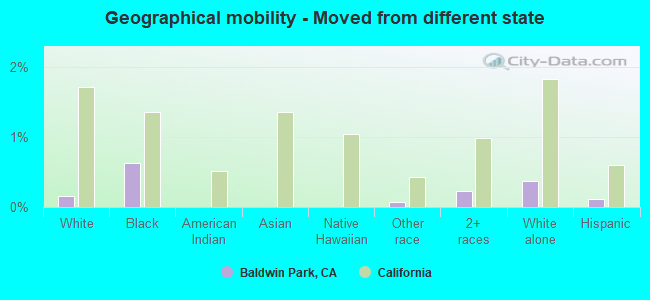
Geographical mobility - Moved from different state (%)
Geographical mobility - Moved from different state (%) - White
Geographical mobility - Moved from different state (%) - Black or African American
Geographical mobility - Moved from different state (%) - Asian
Geographical mobility - Moved from different state (%) - Hispanic or Latino
Geographical mobility - Moved from different state (%) - American Indian and Alaska Native
Geographical mobility - Moved from different state (%) - Multirace
Geographical mobility - Moved from different state (%) - Other Race
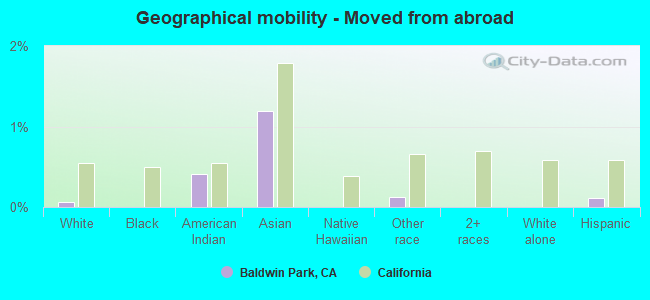
Geographical mobility - Moved from abroad (%)
Geographical mobility - Moved from abroad (%) - White
Geographical mobility - Moved from abroad (%) - Black or African American
Geographical mobility - Moved from abroad (%) - Asian
Geographical mobility - Moved from abroad (%) - Hispanic or Latino
Geographical mobility - Moved from abroad (%) - American Indian and Alaska Native
Geographical mobility - Moved from abroad (%) - Multirace
Geographical mobility - Moved from abroad (%) - Other Race
Place of birth for the foreign-born population - Ireland (%)
Place of birth for the foreign-born population - Denmark (%)
Place of birth for the foreign-born population - Norway (%)
Place of birth for the foreign-born population - Sweden (%)
Place of birth for the foreign-born population - United Kingdom (%)
Place of birth for the foreign-born population - England (%)
Place of birth for the foreign-born population - Scotland (%)
Place of birth for the foreign-born population - Other Northern Europe (%)
Place of birth for the foreign-born population - Austria (%)
Place of birth for the foreign-born population - Belgium (%)
Place of birth for the foreign-born population - France (%)
Place of birth for the foreign-born population - Germany (%)
Place of birth for the foreign-born population - Netherlands (%)
Place of birth for the foreign-born population - Switzerland (%)
Place of birth for the foreign-born population - Other Western Europe (%)
Place of birth for the foreign-born population - Greece (%)
Place of birth for the foreign-born population - Italy (%)
Place of birth for the foreign-born population - Portugal (%)
Place of birth for the foreign-born population - Spain (%)
Place of birth for the foreign-born population - Other Southern Europe (%)
Place of birth for the foreign-born population - Albania (%)
Place of birth for the foreign-born population - Belarus (%)
Place of birth for the foreign-born population - Bosnia and Herzegovina (%)
Place of birth for the foreign-born population - Bulgaria (%)
Place of birth for the foreign-born population - Croatia (%)
Place of birth for the foreign-born population - Czechoslovakia (%)
Place of birth for the foreign-born population - Hungary (%)
Place of birth for the foreign-born population - Latvia (%)
Place of birth for the foreign-born population - Lithuania (%)
Place of birth for the foreign-born population - North Macedonia (Macedonia) (%)
Place of birth for the foreign-born population - Moldova (%)
Place of birth for the foreign-born population - Poland (%)
Place of birth for the foreign-born population - Romania (%)
Place of birth for the foreign-born population - Russia (%)
Place of birth for the foreign-born population - Serbia (%)
Place of birth for the foreign-born population - Ukraine (%)
Place of birth for the foreign-born population - Other Eastern Europe (%)
Place of birth for the foreign-born population - China (%)
Place of birth for the foreign-born population - Hong Kong (%)
Place of birth for the foreign-born population - Taiwan (%)
Place of birth for the foreign-born population - Japan (%)
Place of birth for the foreign-born population - Korea (%)
Place of birth for the foreign-born population - Other Eastern Asia (%)
Place of birth for the foreign-born population - Afghanistan (%)
Place of birth for the foreign-born population - Bangladesh (%)
Place of birth for the foreign-born population - India (%)
Place of birth for the foreign-born population - Iran (%)
Place of birth for the foreign-born population - Kazakhstan (%)
Place of birth for the foreign-born population - Nepal (%)
Place of birth for the foreign-born population - Pakistan (%)
Place of birth for the foreign-born population - Sri Lanka (%)
Place of birth for the foreign-born population - Uzbekistan (%)
Place of birth for the foreign-born population - Other South Central Asia (%)
Place of birth for the foreign-born population - Burma (%)
Place of birth for the foreign-born population - Cambodia (%)
Place of birth for the foreign-born population - Indonesia (%)
Place of birth for the foreign-born population - Laos (%)
Place of birth for the foreign-born population - Malaysia (%)
Place of birth for the foreign-born population - Philippines (%)
Place of birth for the foreign-born population - Singapore (%)
Place of birth for the foreign-born population - Thailand (%)
Place of birth for the foreign-born population - Vietnam (%)
Place of birth for the foreign-born population - Other South Eastern Asia (%)
Place of birth for the foreign-born population - Armenia (%)
Place of birth for the foreign-born population - Iraq (%)
Place of birth for the foreign-born population - Israel (%)
Place of birth for the foreign-born population - Jordan (%)
Place of birth for the foreign-born population - Kuwait (%)
Place of birth for the foreign-born population - Lebanon (%)
Place of birth for the foreign-born population - Saudi Arabia (%)
Place of birth for the foreign-born population - Syria (%)
Place of birth for the foreign-born population - Turkey (%)
Place of birth for the foreign-born population - Yemen (%)
Place of birth for the foreign-born population - Other Western Asia (%)
Place of birth for the foreign-born population - Eritrea (%)
Place of birth for the foreign-born population - Ethiopia (%)
Place of birth for the foreign-born population - Kenya (%)
Place of birth for the foreign-born population - Somalia (%)
Place of birth for the foreign-born population - Uganda (%)
Place of birth for the foreign-born population - Zimbabwe (%)
Place of birth for the foreign-born population - Other Eastern Africa (%)
Place of birth for the foreign-born population - Cameroon (%)
Place of birth for the foreign-born population - Congo (%)
Place of birth for the foreign-born population - Democratic Republic of Congo (Zaire) (%)
Place of birth for the foreign-born population - Other Middle Africa (%)
Place of birth for the foreign-born population - Egypt (%)
Place of birth for the foreign-born population - Morocco (%)
Place of birth for the foreign-born population - Sudan (%)
Place of birth for the foreign-born population - Other Northern Africa (%)
Place of birth for the foreign-born population - South Africa (%)
Place of birth for the foreign-born population - Other Southern Africa (%)
Place of birth for the foreign-born population - Cabo Verde (%)
Place of birth for the foreign-born population - Ghana (%)
Place of birth for the foreign-born population - Liberia (%)
Place of birth for the foreign-born population - Nigeria (%)
Place of birth for the foreign-born population - Senegal (%)
Place of birth for the foreign-born population - Sierra Leone (%)
Place of birth for the foreign-born population - Other Western Africa (%)
Place of birth for the foreign-born population - Australia (%)
Place of birth for the foreign-born population - New Zealand (%)
Place of birth for the foreign-born population - Fiji (%)
Place of birth for the foreign-born population - Micronesia (%)
Place of birth for the foreign-born population - Bahamas (%)
Place of birth for the foreign-born population - Barbados (%)
Place of birth for the foreign-born population - Cuba (%)
Place of birth for the foreign-born population - Dominica (%)
Place of birth for the foreign-born population - Dominican Republic (%)
Place of birth for the foreign-born population - Grenada (%)
Place of birth for the foreign-born population - Haiti (%)
Place of birth for the foreign-born population - Jamaica (%)
Place of birth for the foreign-born population - St. Vincent and the Grenadines (%)
Place of birth for the foreign-born population - Trinidad and Tobago (%)
Place of birth for the foreign-born population - West Indies (%)
Place of birth for the foreign-born population - Other Caribbean (%)
Place of birth for the foreign-born population - Belize (%)
Place of birth for the foreign-born population - Costa Rica (%)
Place of birth for the foreign-born population - El Salvador (%)
Place of birth for the foreign-born population - Guatemala (%)
Place of birth for the foreign-born population - Honduras (%)
Place of birth for the foreign-born population - Mexico (%)
Place of birth for the foreign-born population - Nicaragua (%)
Place of birth for the foreign-born population - Panama (%)
Place of birth for the foreign-born population - Other Central America (%)
Place of birth for the foreign-born population - Argentina (%)
Place of birth for the foreign-born population - Bolivia (%)
Place of birth for the foreign-born population - Brazil (%)
Place of birth for the foreign-born population - Chile (%)
Place of birth for the foreign-born population - Colombia (%)
Place of birth for the foreign-born population - Ecuador (%)
Place of birth for the foreign-born population - Guyana (%)
Place of birth for the foreign-born population - Peru (%)
Place of birth for the foreign-born population - Uruguay (%)
Place of birth for the foreign-born population - Venezuela (%)
Place of birth for the foreign-born population - Other South America (%)
Place of birth for the foreign-born population - Canada (%)
Place of birth for the foreign-born population - Other Northern America (%)
Place of birth for the foreign-born population - Other (%)
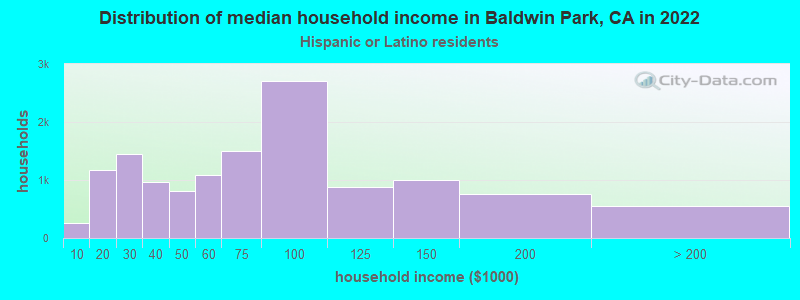
According to 2022 data, the most numerous races in Baldwin Park, CA are Hispanic (57,518 residents), White alone (2,776 residents), and Asian alone (15,235 residents). 18.6% of Baldwin Park residents speak English at home. 45.0% of Baldwin Park, CA residents are foreign-born (29.8% born in Latin America, 14.2% born in Asia), which is 42.3% greater than the foreign-born rate of 26.0% across the entire state of California.
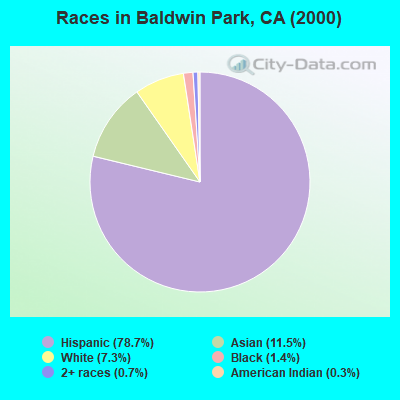
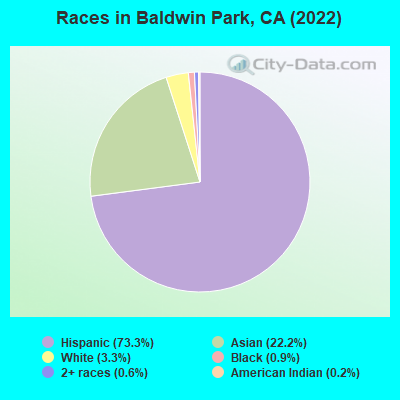
Race distribution in Baldwin Park
2000 2022
15,816,790 46.7% White alone 10,966,556 32.4% Hispanic 3,648,860 10.8% Asian alone 2,181,926 6.4% Black alone 903,115 2.7% Two or more races 178,984 0.5% American Indian alone 103,736 0.3% Native Hawaiian and Other 71,681 0.2% Other race alone
15,732,184 40.3% Hispanic 13,160,426 33.7% White alone 5,957,867 15.3% Asian alone 2,025,218 5.2% Black alone 1,663,222 4.3% Two or more races 251,618 0.6% Other race alone 135,777 0.3% Native Hawaiian and Other 103,030 0.3% American Indian alone
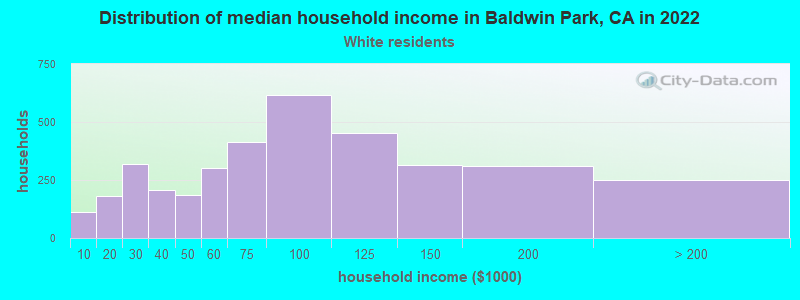
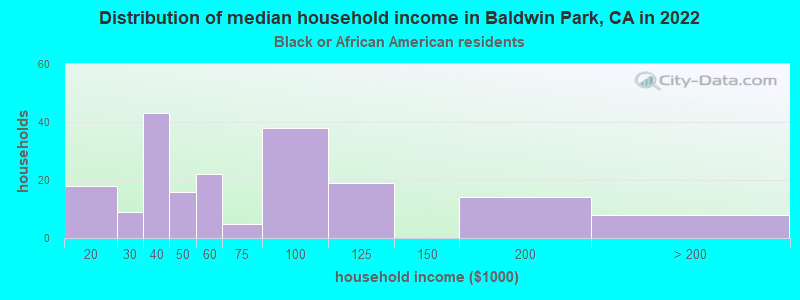
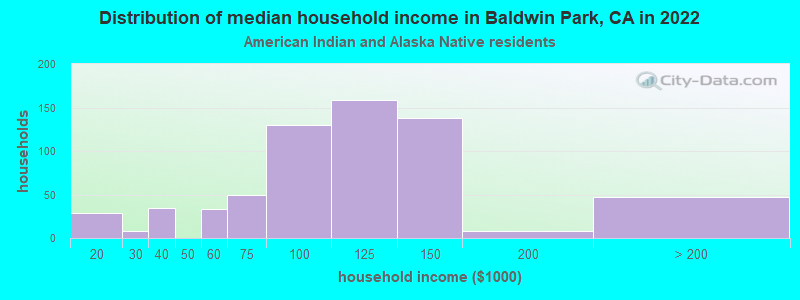
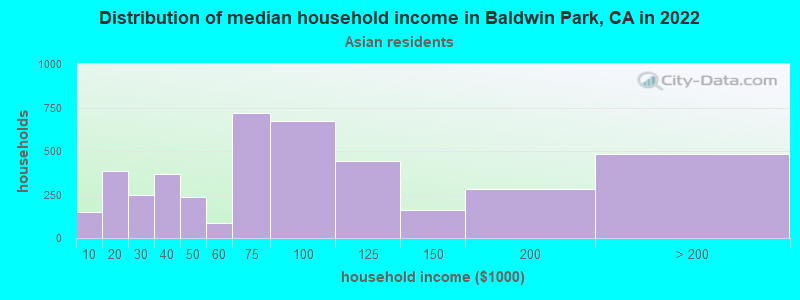
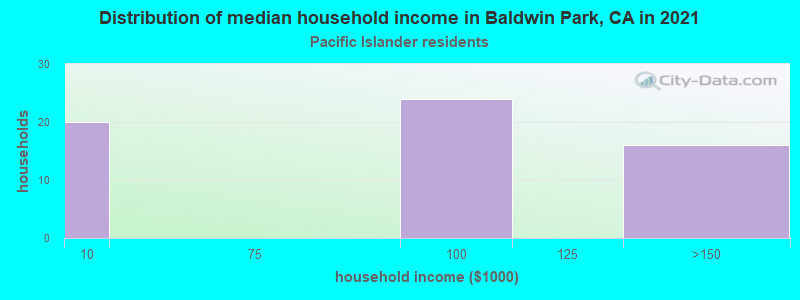
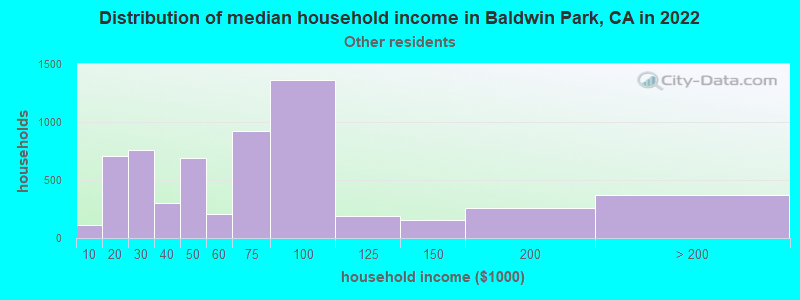
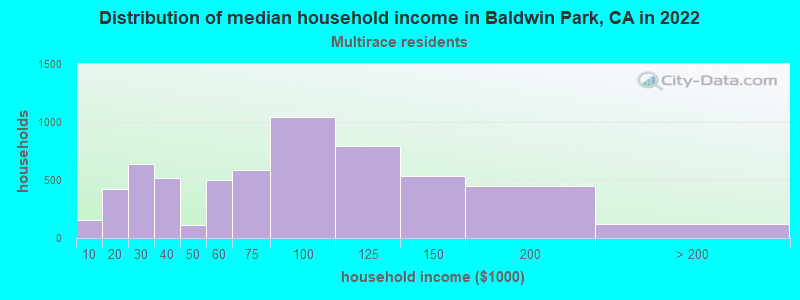
Income and house value in Baldwin Park Median household income in 2022 $90,501 White non-Hispanic householders$53,310 Black householders$61,756 American Indian and Alaska Native householders$82,585 Asian householders$125,821 Native Hawaiian and other Pacific Islander householders$81,878 Some other race householders$65,012 Two or more races householders$89,665 Hispanic or Latino race householdersMedian 2022 house value $517,218 White Non-Hispanic householders$447,752 Black or African American householders$517,938 American Indian or Alaska Native householders $558,610 Asian householders$404,920 Native Hawaiian and other Pacific Islander householders$519,018 Some other race householders$534,135 Two or more races householders$523,697 Hispanic or Latino householders
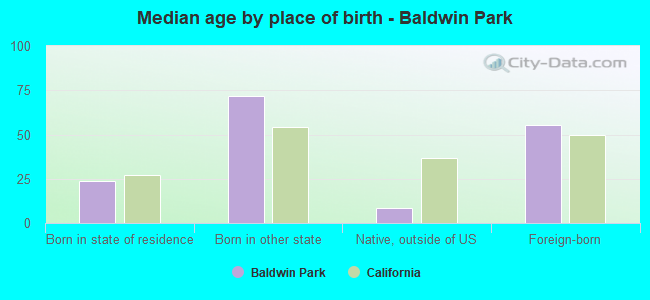
Median age by race in Baldwin Park
36.2 Median age for White residents34.7 37.8 31.3 Median age for Black or African American residents36.0 28.1 33.7 Median age for American Indian / Alaska Native residents30.2 33.9 43.2 Median age for Asian residents41.7 44.6 30.5 Median age for Native Hawaiian / Pacific Islander residents33.0 33.3 38.1 Median age for Other race residents44.4 30.3 52.0 Median age for Two or more races residents54.8 49.7 57.2 Median age for White alone residents54.2 62.1 34.9 Median age for Hispanic or Latino residents35.3 34.5
Owner/renter occupied households by race in Baldwin Park
House owners and renters - White residents 5,094 56.9% Owner occupied3,863 43.1% Renter occupiedHouse owners and renters - Black or African American residents 69 27.4% Owner occupied182 72.6% Renter occupiedHouse owners and renters - American Indian / Alaska Native residents 198 57.1% Owner occupied149 42.9% Renter occupiedHouse owners and renters - Asian residents 3,615 76.7% Owner occupied1,097 23.3% Renter occupiedHouse owners and renters - Native Hawaiian / Pacific Islander residents 30 57.6% Owner occupied22 42.4% Renter occupiedHouse owners and renters - Other race residents 1,696 51.3% Owner occupied1,613 48.7% Renter occupiedHouse owners and renters - Two or more races residents 2,565 46.6% Owner occupied2,941 53.4% Renter occupiedHouse owners and renters - White alone residents 535 48.1% Owner occupied576 51.9% Renter occupiedHouse owners and renters - Hispanic or Latino residents 8,006 54.8% Owner occupied6,610 45.2% Renter occupied
Language usage in Baldwin Park
English speakers - Total 18.6% of residents of Baldwin Park speak English at home.
63.1% of residents speak Spanish at home 28,208 62.5% Speak English very well16,926 37.5% Speak English less than very well17.4% of residents speak other language at home 4,603 36.9% Speak English very well7,869 63.1% Speak English less than very well
English speakers - Born in the United States 58.3% of residents of Baldwin Park speak English at home.
34.0% of residents speak Spanish at home 567 88.0% Speak English very well77 12.0% Speak English less than very well8.4% of residents speak other language at home 112 70.4% Speak English very well47 29.6% Speak English less than very well
English speakers - Native, born elsewhere 33.9% of residents of Baldwin Park speak English at home.
36.8% of residents speak Spanish at home 133 64.9% Speak English very well72 35.1% Speak English less than very well28.9% of residents speak other language at home 72 44.7% Speak English very well89 55.3% Speak English less than very well
English speakers - Foreign-born 4.4% of residents of Baldwin Park speak English at home.
62.9% of residents speak Spanish at home 6,123 29.3% Speak English very well14,765 70.7% Speak English less than very well30.7% of residents speak other language at home 3,048 29.8% Speak English very well7,170 70.2% Speak English less than very well
White (Caucasian) - Speak only English Native:
30.9% (6,131)Foreign-born:
3.4% (341)
White (Caucasian) - Speak another language Native:
53.3% (10,589)Foreign-born:
92.1% (9,151)
Black or African American - Speak only English Native:
89.5% (733)Foreign-born:
41.3% (80)
Black or African American - Speak another language Native:
12.0% (98)Foreign-born:
57.1% (111)
American Indian / Alaska Native - Speak only English Native:
17.4% (188)Foreign-born:
2.2% (14)
American Indian / Alaska Native - Speak another language Native:
100.0% (1,077)Foreign-born:
97.6% (606)
Asian - Speak only English Native:
45.1% (1,729)Foreign-born:
4.0% (443)
Asian - Speak another language Native:
54.1% (2,075)Foreign-born:
95.3% (10,518)
Native Hawaiian / Pacific Islander - Speak only English Native:
26.7% (44)Foreign-born:
22.0% (6)
Native Hawaiian / Pacific Islander - Speak another language Native:
58.5% (96)Foreign-born:
79.4% (22)
Other race - Speak only English Native:
43.9% (3,155)Foreign-born:
10.2% (493)
Other race - Speak another language Native:
57.8% (4,153)Foreign-born:
91.2% (4,398)
Two or more races - Speak only English Native:
23.3% (1,562)Foreign-born:
1.0% (107)
Two or more races - Speak another language Native:
100.0% (6,694)Foreign-born:
100.0% (10,741)
White alone - Speak only English Native:
92.3% (2,353)Foreign-born:
41.2% (88)
White alone - Speak another language Native:
7.8% (200)Foreign-born:
57.9% (124)
Hispanic or Latino - Speak only English Native:
29.3% (9,690)Foreign-born:
3.9% (805)
Hispanic or Latino - Speak another language Native:
69.7% (23,053)Foreign-born:
95.6% (19,592)
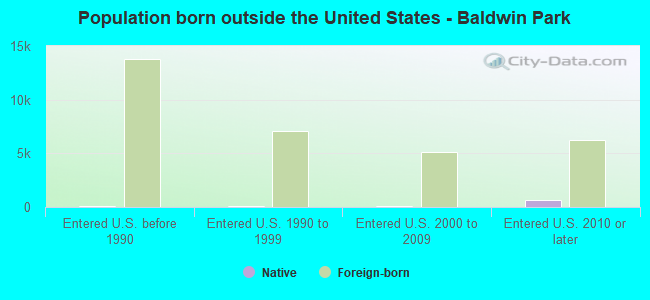
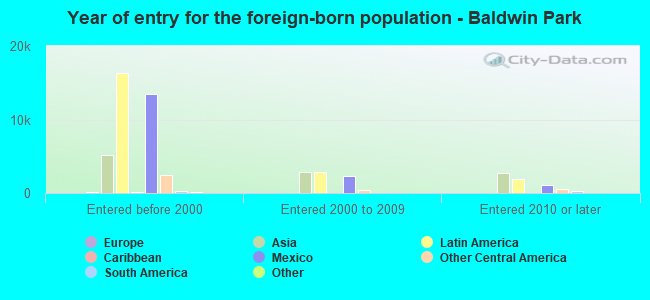
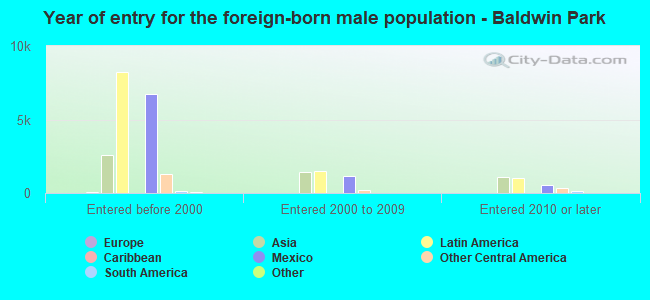
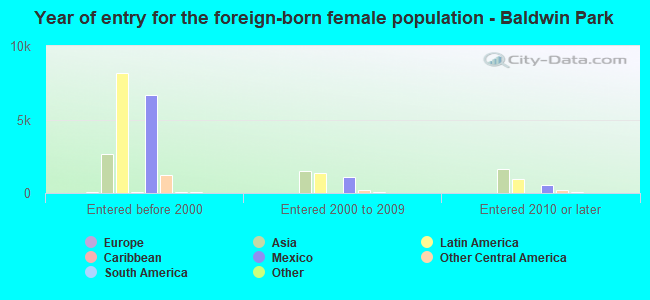
Foreign-born residents in Baldwin Park 34,099 residents are foreign born (29.8% Latin America , 14.2% Asia ).
This city:
45.0%California:
100.0%
Marital status for residents in Baldwin Park Marital status - White (Caucasian) population 15 years and over
Males 39.4% Never married49.9% Now married2.0% Separated1.9% Widowed6.9% DivorcedFemales 38.3% Never married44.4% Now married2.2% Separated5.7% Widowed9.4% DivorcedWomen who gave birth in the past 12 months Now married:
62.5% (193)Unmarried:
37.5% (116)
Women who did not give birth in the past 12 months Now married:
33.9% (2,647)Unmarried:
66.1% (5,164)
Marital status - Black or African American population 15 years and over
Males 50.2% Never married28.4% Now married1.3% Separated0.0% Widowed20.0% DivorcedFemales 60.0% Never married24.2% Now married5.6% Separated2.9% Widowed7.3% DivorcedWomen who gave birth in the past 12 months Now married:
34.6% (17)Unmarried:
65.4% (31)
Women who did not give birth in the past 12 months Now married:
24.8% (69)Unmarried:
75.2% (210)
Marital status - American Indian / Alaska Native population 15 years and over
Males 46.5% Never married46.3% Now married0.0% Separated2.2% Widowed5.0% DivorcedFemales 26.8% Never married57.2% Now married5.5% Separated10.5% Widowed0.0% DivorcedWomen who gave birth in the past 12 months Now married:
100.0% (28)Unmarried:
0.0% (0)
Women who did not give birth in the past 12 months Now married:
65.0% (240)Unmarried:
35.0% (130)
Marital status - Asian population 15 years and over
Males 30.8% Never married60.9% Now married0.0% Separated3.9% Widowed4.4% DivorcedFemales 24.1% Never married59.1% Now married0.3% Separated9.2% Widowed7.2% DivorcedWomen who gave birth in the past 12 months Now married:
100.0% (365)Unmarried:
0.0% (0)
Women who did not give birth in the past 12 months Now married:
48.6% (1,652)Unmarried:
51.4% (1,745)
Marital status - Native Hawaiian / Pacific Islander population 15 years and over
Males 4.8% Never married72.6% Now married0.0% Separated22.6% Widowed0.0% DivorcedFemales 0.0% Never married100.0% Now married0.0% Separated0.0% Widowed0.0% DivorcedWomen who gave birth in the past 12 months Now married:
100.0% (19)Unmarried:
0.0% (0)
Women who did not give birth in the past 12 months Now married:
100.0% (64)Unmarried:
0.0% (0)
Marital status - Other race population 15 years and over
Males 49.8% Never married34.5% Now married4.3% Separated1.0% Widowed10.4% DivorcedFemales 44.1% Never married37.7% Now married0.0% Separated4.0% Widowed14.2% DivorcedWomen who gave birth in the past 12 months Now married:
100.0% (126)Unmarried:
0.0% (0)
Women who did not give birth in the past 12 months Now married:
35.5% (1,195)Unmarried:
64.5% (2,174)
Marital status - Two or more races population 15 years and over
Males 48.7% Never married42.7% Now married3.7% Separated0.9% Widowed4.0% DivorcedFemales 44.1% Never married37.7% Now married3.9% Separated7.9% Widowed6.3% DivorcedWomen who gave birth in the past 12 months Now married:
84.3% (126)Unmarried:
15.7% (24)
Women who did not give birth in the past 12 months Now married:
35.6% (1,356)Unmarried:
64.4% (2,456)
Marital status - White alone, not Hispanic / Latino population 15 years and over
Males 51.0% Never married37.1% Now married3.3% Separated1.8% Widowed6.7% DivorcedFemales 28.7% Never married39.0% Now married0.3% Separated22.2% Widowed9.7% DivorcedWomen who gave birth in the past 12 months Now married:
0.0% (0)Unmarried:
100.0% (6)
Women who did not give birth in the past 12 months Now married:
42.7% (198)Unmarried:
57.3% (266)
Marital status - Hispanic or Latino population 15 years and over
Males 42.3% Never married46.4% Now married2.3% Separated1.5% Widowed7.4% DivorcedFemales 41.5% Never married42.4% Now married1.7% Separated4.0% Widowed10.4% DivorcedWomen who gave birth in the past 12 months Now married:
76.8% (499)Unmarried:
23.2% (151)
Women who did not give birth in the past 12 months Now married:
33.1% (4,725)Unmarried:
66.9% (9,554)
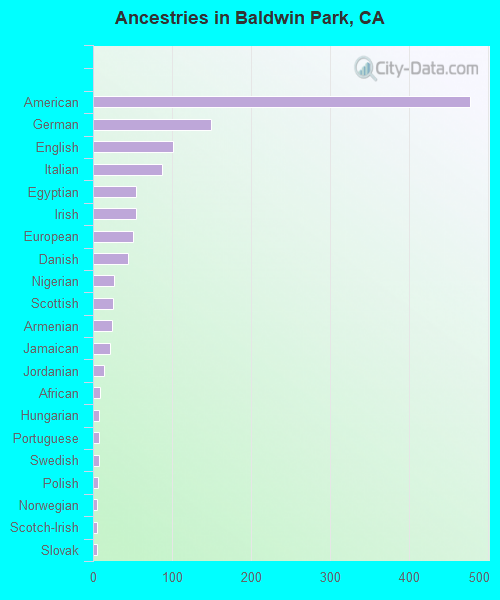
Ancestries in Baldwin Park
408 0.7% American161 0.3% English146 0.3% African107 0.2% Egyptian97 0.2% Italian85 0.1% German48 0.08% Ethiopian48 0.08% Nigerian38 0.07% Irish34 0.06% European27 0.05% Belizean25 0.04% Jamaican23 0.04% Polish20 0.04% British14 0.02% French14 0.02% Greek11 0.02% Canadian10 0.02% Armenian10 0.02% Danish8 0.01% Palestinian7 0.01% Portuguese6 0.01% Norwegian5 0.01% Scandinavian3 0.01% Scotch-Irish
Geographical mobility in Baldwin Park Same house 1 year ago 25,196 97.6% White (Caucasian)1,047 95.4% Black or African American1,609 95.7% American Indian / Alaska Native15,266 95.5% Asian338 100.0% Native Hawaiian / Pacific Islander23,615 98.3% Other race12,911 98.8% Two or more races2,662 94.4% White alone, not Hispanic / Latino55,683 97.4% Hispanic or LatinoMoved within same county 717 2.8% White / Caucasian32 2.9% Black or African American70 4.1% American Indian / Alaska Native497 3.1% Asian539 2.2% Other race587 4.5% Two or more races128 4.5% White alone, not Hispanic / Latino1,598 2.8% Hispanic or LatinoMoved within same state 87 0.3% White / Caucasian23 2.1% Black or African American34 2.0% American Indian / Alaska Native61 0.4% Asian116 0.5% Other race4 0.0% Two or more races38 1.4% White alone, not Hispanic / Latino268 0.5% Hispanic or LatinoMoved from different state 40 0.2% White / Caucasian7 0.6% Black or African American17 0.1% Other race29 0.2% Two or more races11 0.4% White alone, not Hispanic / Latino69 0.1% Hispanic or LatinoMoved from abroad 15 0.1% White7 0.4% American Indian / Alaska Native191 1.2% Asian31 0.1% Other race64 0.1% Hispanic or Latino
Children Nativity (place of birth) in Baldwin Park
Children under 6 years - Living with two parents Both parents native 891 100.0% NativeBoth parents foreign-born 1,310 97.0% Native40 3.0% Foreign-bornOne native, one foreign-born parent 763 100.0% NativeChildren under 6 years - Living with one parent Native parent 1,908 100.0% Native0 0.0% Foreign-bornForeign-born parent 640 95.3% Native31 4.7% Foreign-bornChildren 6 to 17 years - Living with two parents Both parents native 1,513 100.0% NativeBoth parents foreign-born 2,837 94.5% Native166 5.5% Foreign-bornOne native, one foreign-born parent 1,274 100.0% NativeChildren 6 to 17 years - Living with one parent Native parent 1,995 100.0% NativeForeign-born parent 1,125 60.4% Native737 39.6% Foreign-born
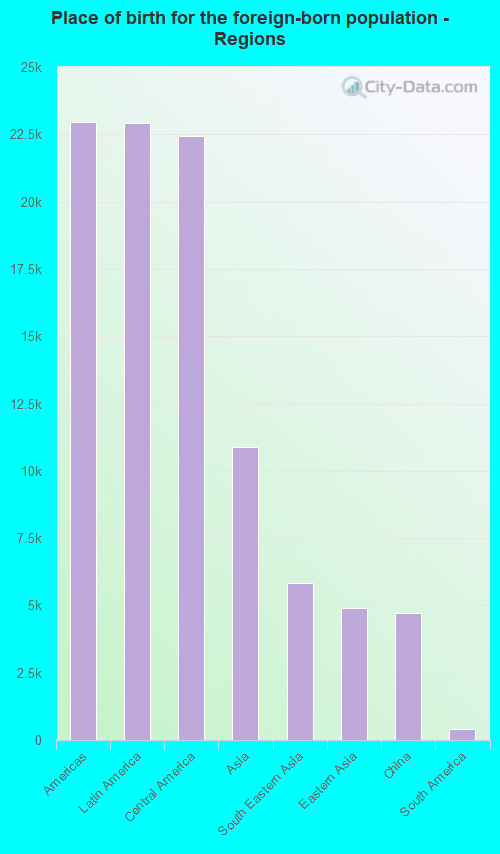
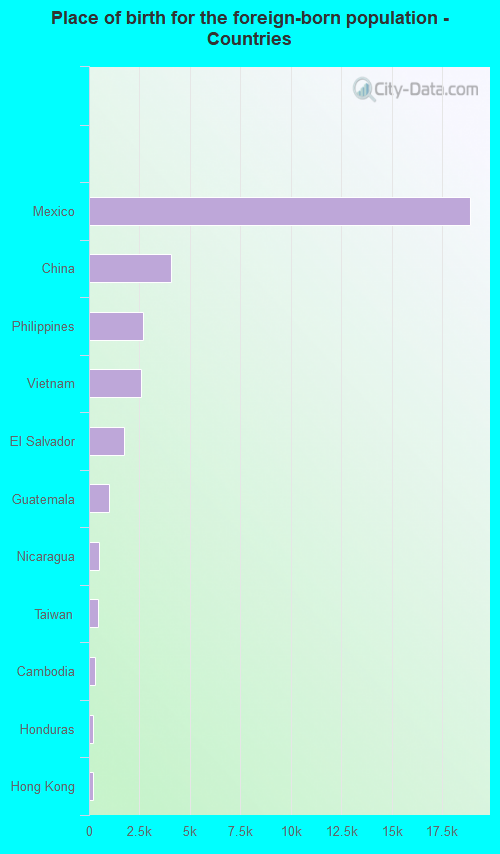
Place of birth for residents in Baldwin Park 22,956 Americas22,919 Latin America22,427 Central America10,898 Asia5,844 South Eastern Asia4,900 Eastern Asia4,704 China394 South America144 South Central Asia117 Europe97 Caribbean86 Africa77 Northern Europe43 Northern Africa42 Eastern Africa40 Oceania37 Northern America28 Western Europe22 Australia and New Zealand Subregion11 Eastern Europe9 Western Asia18,889 Mexico4,047 China2,681 Philippines2,562 Vietnam1,753 El Salvador985 Guatemala511 Nicaragua469 Taiwan274 Cambodia196 Honduras187 Hong Kong121 Peru118 Ecuador116 India105 Korea103 Thailand97 Cuba90 Japan84 Indonesia83 Burma73 Colombia56 Argentina45 Belize43 Malaysia42 Ethiopia37 Canada36 England36 Egypt28 Germany25 Costa Rica22 Australia21 United Kingdom17 Uruguay16 Sri Lanka13 Denmark12 Iran12 Laos9 Ukraine9 Lebanon7 Ireland6 Chile2 Bulgaria
Grandparents responsible for own grandchildren in Baldwin Park
Grandparents (30 to 59 years) White / Caucasian 272 33.0% Responsible for grandchildren553 67.0% Not responsible for grandchildrenAmerican Indian / Alaska Native 9 45.5% Responsible for grandchildren11 54.5% Not responsible for grandchildrenAsian 56 22.5% Responsible for grandchildren192 77.5% Not responsible for grandchildrenOther race 84 14.1% Responsible for grandchildren511 85.9% Not responsible for grandchildrenTwo or more races 19 3.1% Responsible for grandchildren576 96.9% Not responsible for grandchildrenWhite alone, not Hispanic / Latino 12 61.1% Responsible for grandchildren7 38.9% Not responsible for grandchildrenHispanic or Latino 495 25.1% Responsible for grandchildren1,478 74.9% Not responsible for grandchildrenGrandparents (60 years and over) White / Caucasian 38 4.0% Responsible for grandchildren897 96.0% Not responsible for grandchildrenAmerican Indian / Alaska Native 27 64.5% Responsible for grandchildren15 35.5% Not responsible for grandchildrenAsian 59 17.3% Responsible for grandchildren281 82.7% Not responsible for grandchildrenOther race 151 20.4% Responsible for grandchildren587 79.6% Not responsible for grandchildrenTwo or more races 72 14.8% Responsible for grandchildren413 85.2% Not responsible for grandchildrenWhite alone, not Hispanic / Latino 20 28.2% Responsible for grandchildren51 71.8% Not responsible for grandchildrenHispanic or Latino 51 3.7% Responsible for grandchildren1,354 96.3% Not responsible for grandchildren