Races in Beatyestown, New Jersey (NJ) Detailed Stats
Ancestries, Foreign-born residents, place of birth

Discuss Beatyestown, New Jersey races on our local forum with over 2,400,000 registered users
7.6% of Beatyestown, NJ residents are foreign-born (3.9% born in Latin America, 2.4% born in Asia, 1.3% born in Europe), which is 202.6% less than the foreign-born rate of 23.0% across the entire state of New Jersey.
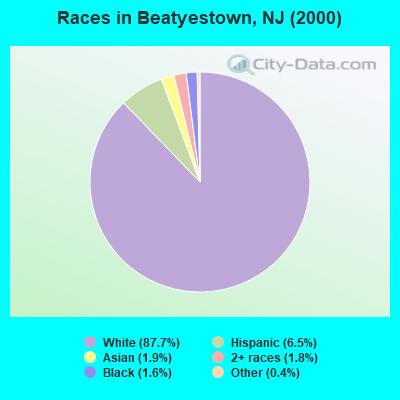
Race distribution in Beatyestown

- 2,82687.7%White alone
- 2106.5%Hispanic
- 601.9%Asian alone
- 591.8%Two or more races
- 531.6%Black alone
- 140.4%Other race alone
- 10.03%American Indian alone
2000
2022
-
- 5,557,20966.0%White alone
- 1,117,19113.3%Hispanic
- 1,096,17113.0%Black alone
- 477,0125.7%Asian alone
- 133,6891.6%Two or more races
- 19,5650.2%Other race alone
- 11,3380.1%American Indian alone
- 2,1750.03%Native Hawaiian and Other
Pacific Islander alone

-
- 4,766,47651.5%White alone
- 2,028,47021.9%Hispanic
- 1,111,63212.0%Black alone
- 923,54610.0%Asian alone
- 332,2373.6%Two or more races
- 89,8471.0%Other race alone
- 8,5570.09%American Indian alone
- 9340.01%Native Hawaiian and Other
Pacific Islander alone

Income and house value in Beatyestown
- Median household income in 2022
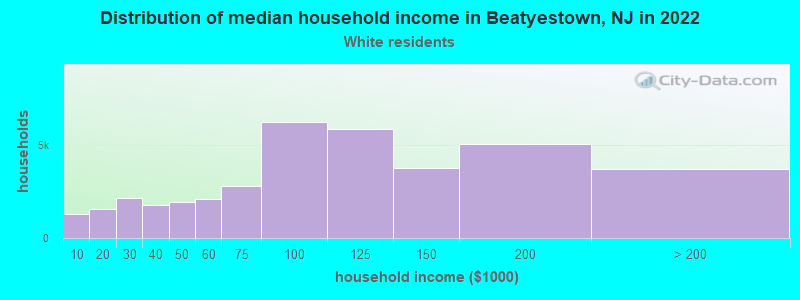
- $98,378White non-Hispanic householders
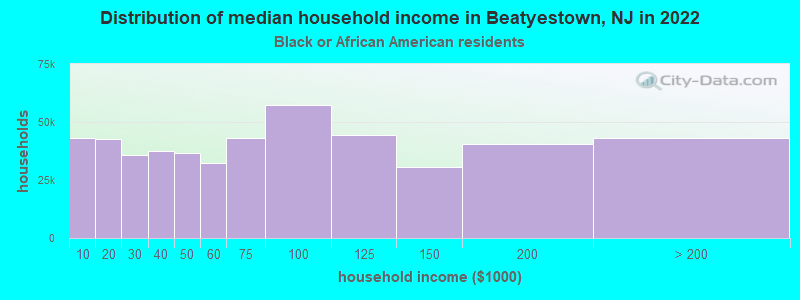
- $185,630Black householders
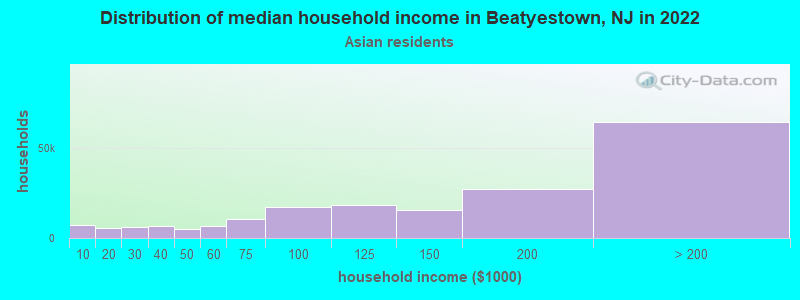
- $83,704Asian householders
- $190,344Some other race householders
- $110,067Two or more races householders
- $110,172Hispanic or Latino race householders
- Median 2022 house value
- $389,833White Non-Hispanic householders
- $212,595Black or African American householders
- $615,409Asian householders
- $251,758Two or more races householders
- $416,464Hispanic or Latino householders
Household income for White non-Hispanic householders
Household income for Black householders
Household income for Asian householders
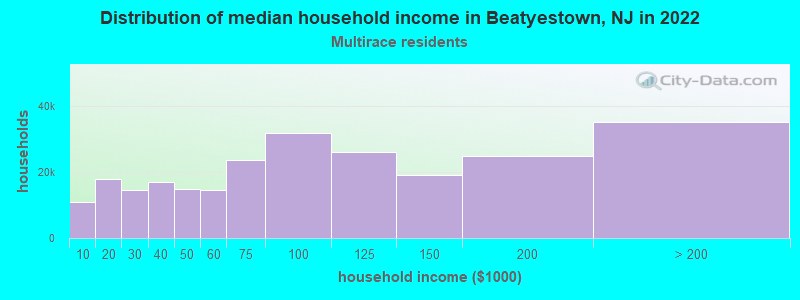
Household income for Two or more races householders
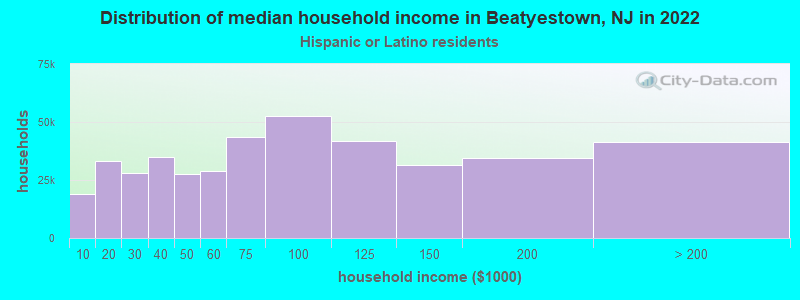
Household income for Hispanic or Latino race householders
Foreign-born residents in Beatyestown
245 residents are foreign born (3.9% Latin America, 2.4% Asia, 1.3% Europe).
| This city: | 7.6% |
| New Jersey: | 17.5% |
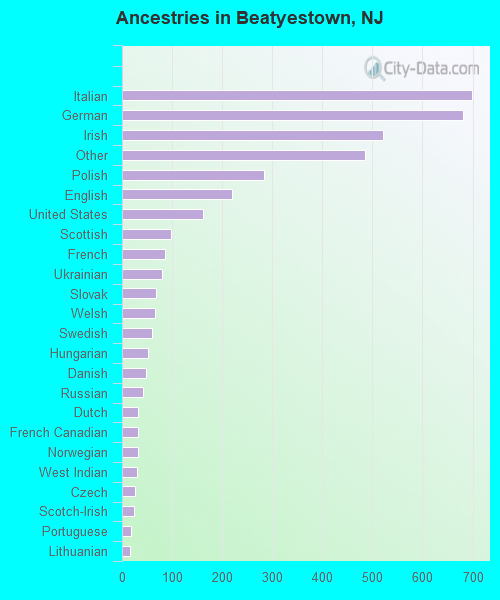
Ancestries in Beatyestown

- 69818.1%Italian
- 68117.7%German
- 52213.5%Irish
- 48612.6%Other
- 2837.3%Polish
- 2205.7%English
- 1614.2%United States
- 972.5%Scottish
- 862.2%French
- 802.1%Ukrainian
- 671.7%Slovak
- 651.7%Welsh
- 591.5%Swedish
- 511.3%Hungarian
- 481.2%Danish
- 421.1%Russian
- 320.8%Dutch
- 320.8%French Canadian
- 320.8%Norwegian
- 290.8%West Indian
- 260.7%Czech
- 230.6%Scotch-Irish
- 170.4%Portuguese
- 160.4%Lithuanian
Zip codes: 07840.