Races in Beckley, West Virginia (WV) Detailed Stats
Data:
Races - White alone (%)
Races - White alone (% change since 2000)
Races - Black alone (%)
Races - Black alone (% change since 2000)
Races - American Indian alone (%)
Races - American Indian alone (% change since 2000)
Races - Asian alone (%)
Races - Asian alone (% change since 2000)
Races - Hispanic (%)
Races - Hispanic (% change since 2000)
Races - Native Hawaiian and Other Pacific Islander alone (%)
Races - Native Hawaiian and Other Pacific Islander alone (% change since 2000)
Races - Two or more races(%)
Races - Two or more races(% change since 2000)
Races - Other race alone (%)
Races - Other race alone (% change since 2000)
Racial diversity
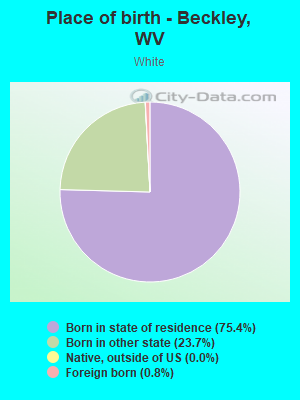
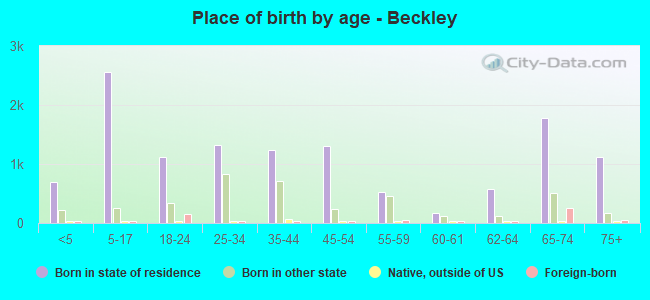
Place of birth - Born in state of residence (%)
Place of birth - Born in state of residence (%) - White
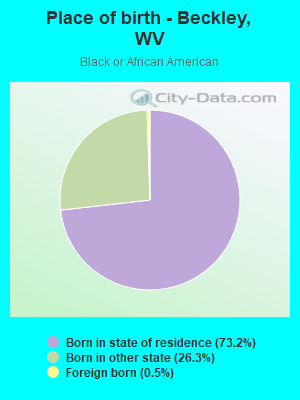
Place of birth - Born in state of residence (%) - Black or African American
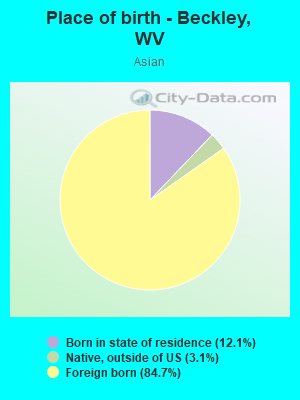
Place of birth - Born in state of residence (%) - Asian
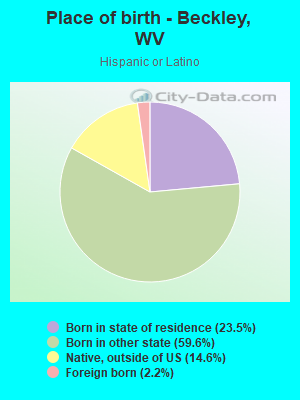
Place of birth - Born in state of residence (%) - Hispanic or Latino
Place of birth - Born in state of residence (%) - American Indian and Alaska Native
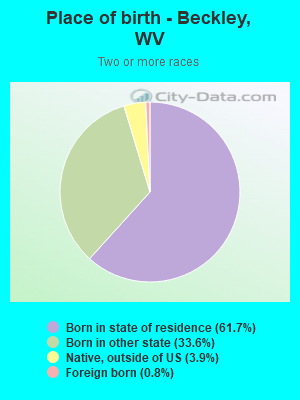
Place of birth - Born in state of residence (%) - Multirace
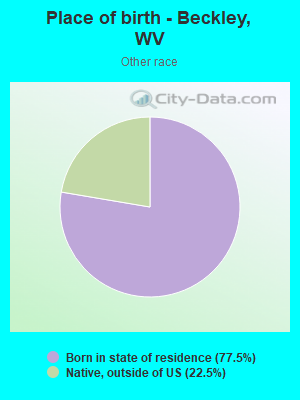
Place of birth - Born in state of residence (%) - Other Race
Place of birth - Born in other state (%)
Place of birth - Born in other state (%) - White
Place of birth - Born in other state (%) - Black or African American
Place of birth - Born in other state (%) - Asian
Place of birth - Born in other state (%) - Hispanic or Latino
Place of birth - Born in other state (%) - American Indian and Alaska Native
Place of birth - Born in other state (%) - Multirace
Place of birth - Born in other state (%) - Other Race
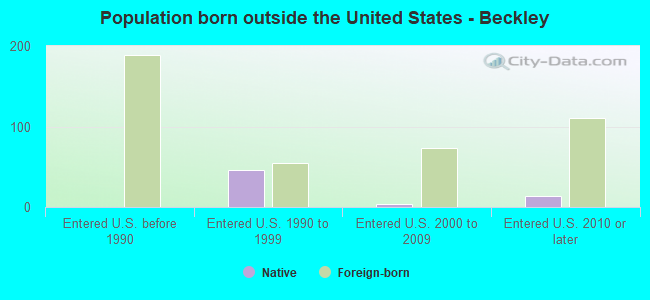
Place of birth - Native, outside of US (%)
Place of birth - Native, outside of US (%) - White
Place of birth - Native, outside of US (%) - Black or African American
Place of birth - Native, outside of US (%) - Asian
Place of birth - Native, outside of US (%) - Hispanic or Latino
Place of birth - Native, outside of US (%) - American Indian and Alaska Native
Place of birth - Native, outside of US (%) - Multirace
Place of birth - Native, outside of US (%) - Other Race
Place of birth - Foreign born (%)
Place of birth - Foreign born (%) - White
Place of birth - Foreign born (%) - Black or African American
Place of birth - Foreign born (%) - Asian
Place of birth - Foreign born (%) - Hispanic or Latino
Place of birth - Foreign born (%) - American Indian and Alaska Native
Place of birth - Foreign born (%) - Multirace
Place of birth - Foreign born (%) - Other Race
Residents speaking English at home (%)
Residents speaking English at home - Born in the United States (%)
Residents speaking English at home - Native, born elsewhere (%)
Residents speaking English at home - Foreign born (%)
Residents speaking Spanish at home (%)
Residents speaking Spanish at home - Born in the United States (%)
Residents speaking Spanish at home - Native, born elsewhere (%)
Residents speaking Spanish at home - Foreign born (%)
Residents speaking other language at home (%)
Residents speaking other language at home - Born in the United States (%)
Residents speaking other language at home - Native, born elsewhere (%)
Residents speaking other language at home - Foreign born (%)
Marital status - Never married (%)
Marital status - Now married (%)
Marital status - Separated (%)
Marital status - Widowed (%)
Marital status - Divorced (%)
Ancestries Reported - Arab (%)
Ancestries Reported - Czech (%)
Ancestries Reported - Danish (%)
Ancestries Reported - Dutch (%)
Ancestries Reported - English (%)
Ancestries Reported - French (%)
Ancestries Reported - French Canadian (%)
Ancestries Reported - German (%)
Ancestries Reported - Greek (%)
Ancestries Reported - Hungarian (%)
Ancestries Reported - Irish (%)
Ancestries Reported - Italian (%)
Ancestries Reported - Lithuanian (%)
Ancestries Reported - Norwegian (%)
Ancestries Reported - Polish (%)
Ancestries Reported - Portuguese (%)
Ancestries Reported - Russian (%)
Ancestries Reported - Scotch-Irish (%)
Ancestries Reported - Scottish (%)
Ancestries Reported - Slovak (%)
Ancestries Reported - Subsaharan African (%)
Ancestries Reported - Swedish (%)
Ancestries Reported - Swiss (%)
Ancestries Reported - Ukrainian (%)
Ancestries Reported - United States (%)
Ancestries Reported - Welsh (%)
Ancestries Reported - West Indian (%)
Ancestries Reported - Other (%)
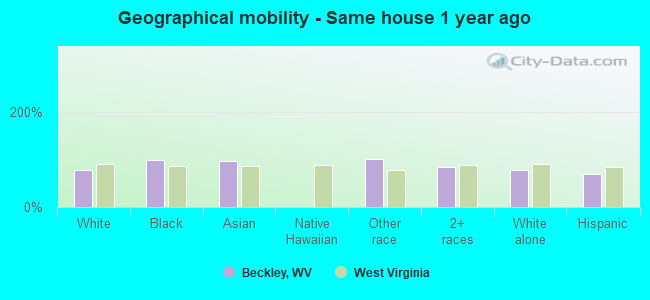
Geographical mobility - Same house 1 year ago (%)
Geographical mobility - Same house 1 year ago (%) - White
Geographical mobility - Same house 1 year ago (%) - Black or African American
Geographical mobility - Same house 1 year ago (%) - Asian
Geographical mobility - Same house 1 year ago (%) - Hispanic or Latino
Geographical mobility - Same house 1 year ago (%) - American Indian and Alaska Native
Geographical mobility - Same house 1 year ago (%) - Multirace
Geographical mobility - Same house 1 year ago (%) - Other Race
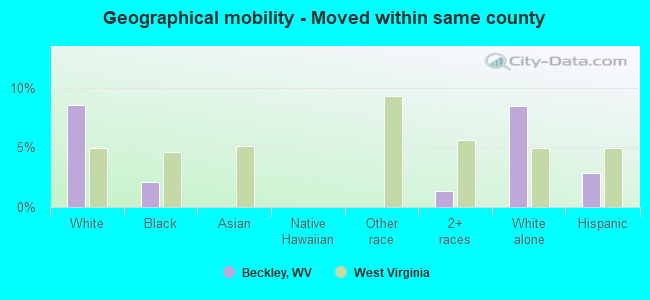
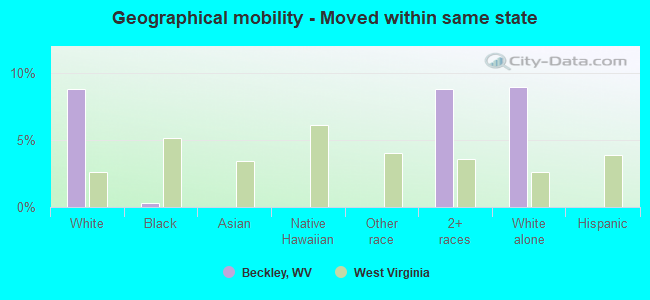
Geographical mobility - Moved within same county (%)
Geographical mobility - Moved within same county (%) - White
Geographical mobility - Moved within same county (%) - Black or African American
Geographical mobility - Moved within same county (%) - Asian
Geographical mobility - Moved within same county (%) - Hispanic or Latino
Geographical mobility - Moved within same county (%) - American Indian and Alaska Native
Geographical mobility - Moved within same county (%) - Multirace
Geographical mobility - Moved within same county (%) - Other Race
Geographical mobility - Moved from different county within same state (%)
Geographical mobility - Moved from different county within same state (%) - White
Geographical mobility - Moved from different county within same state (%) - Black or African American
Geographical mobility - Moved from different county within same state (%) - Asian
Geographical mobility - Moved from different county within same state (%) - Hispanic or Latino
Geographical mobility - Moved from different county within same state (%) - American Indian and Alaska Native
Geographical mobility - Moved from different county within same state (%) - Multirace
Geographical mobility - Moved from different county within same state (%) - Other Race
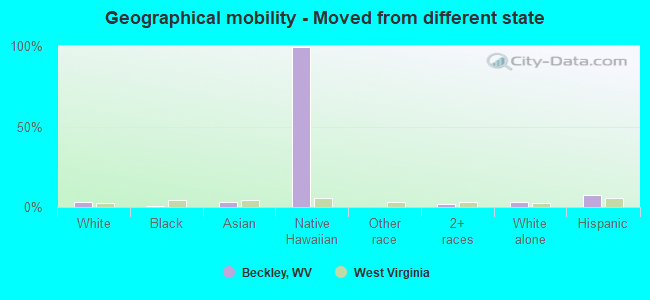
Geographical mobility - Moved from different state (%)
Geographical mobility - Moved from different state (%) - White
Geographical mobility - Moved from different state (%) - Black or African American
Geographical mobility - Moved from different state (%) - Asian
Geographical mobility - Moved from different state (%) - Hispanic or Latino
Geographical mobility - Moved from different state (%) - American Indian and Alaska Native
Geographical mobility - Moved from different state (%) - Multirace
Geographical mobility - Moved from different state (%) - Other Race
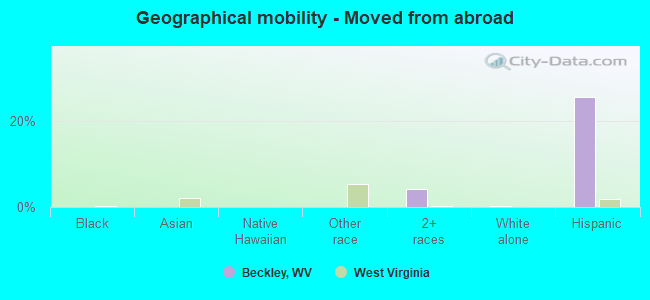
Geographical mobility - Moved from abroad (%)
Geographical mobility - Moved from abroad (%) - White
Geographical mobility - Moved from abroad (%) - Black or African American
Geographical mobility - Moved from abroad (%) - Asian
Geographical mobility - Moved from abroad (%) - Hispanic or Latino
Geographical mobility - Moved from abroad (%) - American Indian and Alaska Native
Geographical mobility - Moved from abroad (%) - Multirace
Geographical mobility - Moved from abroad (%) - Other Race
Place of birth for the foreign-born population - Ireland (%)
Place of birth for the foreign-born population - Denmark (%)
Place of birth for the foreign-born population - Norway (%)
Place of birth for the foreign-born population - Sweden (%)
Place of birth for the foreign-born population - United Kingdom (%)
Place of birth for the foreign-born population - England (%)
Place of birth for the foreign-born population - Scotland (%)
Place of birth for the foreign-born population - Other Northern Europe (%)
Place of birth for the foreign-born population - Austria (%)
Place of birth for the foreign-born population - Belgium (%)
Place of birth for the foreign-born population - France (%)
Place of birth for the foreign-born population - Germany (%)
Place of birth for the foreign-born population - Netherlands (%)
Place of birth for the foreign-born population - Switzerland (%)
Place of birth for the foreign-born population - Other Western Europe (%)
Place of birth for the foreign-born population - Greece (%)
Place of birth for the foreign-born population - Italy (%)
Place of birth for the foreign-born population - Portugal (%)
Place of birth for the foreign-born population - Spain (%)
Place of birth for the foreign-born population - Other Southern Europe (%)
Place of birth for the foreign-born population - Albania (%)
Place of birth for the foreign-born population - Belarus (%)
Place of birth for the foreign-born population - Bosnia and Herzegovina (%)
Place of birth for the foreign-born population - Bulgaria (%)
Place of birth for the foreign-born population - Croatia (%)
Place of birth for the foreign-born population - Czechoslovakia (%)
Place of birth for the foreign-born population - Hungary (%)
Place of birth for the foreign-born population - Latvia (%)
Place of birth for the foreign-born population - Lithuania (%)
Place of birth for the foreign-born population - North Macedonia (Macedonia) (%)
Place of birth for the foreign-born population - Moldova (%)
Place of birth for the foreign-born population - Poland (%)
Place of birth for the foreign-born population - Romania (%)
Place of birth for the foreign-born population - Russia (%)
Place of birth for the foreign-born population - Serbia (%)
Place of birth for the foreign-born population - Ukraine (%)
Place of birth for the foreign-born population - Other Eastern Europe (%)
Place of birth for the foreign-born population - China (%)
Place of birth for the foreign-born population - Hong Kong (%)
Place of birth for the foreign-born population - Taiwan (%)
Place of birth for the foreign-born population - Japan (%)
Place of birth for the foreign-born population - Korea (%)
Place of birth for the foreign-born population - Other Eastern Asia (%)
Place of birth for the foreign-born population - Afghanistan (%)
Place of birth for the foreign-born population - Bangladesh (%)
Place of birth for the foreign-born population - India (%)
Place of birth for the foreign-born population - Iran (%)
Place of birth for the foreign-born population - Kazakhstan (%)
Place of birth for the foreign-born population - Nepal (%)
Place of birth for the foreign-born population - Pakistan (%)
Place of birth for the foreign-born population - Sri Lanka (%)
Place of birth for the foreign-born population - Uzbekistan (%)
Place of birth for the foreign-born population - Other South Central Asia (%)
Place of birth for the foreign-born population - Burma (%)
Place of birth for the foreign-born population - Cambodia (%)
Place of birth for the foreign-born population - Indonesia (%)
Place of birth for the foreign-born population - Laos (%)
Place of birth for the foreign-born population - Malaysia (%)
Place of birth for the foreign-born population - Philippines (%)
Place of birth for the foreign-born population - Singapore (%)
Place of birth for the foreign-born population - Thailand (%)
Place of birth for the foreign-born population - Vietnam (%)
Place of birth for the foreign-born population - Other South Eastern Asia (%)
Place of birth for the foreign-born population - Armenia (%)
Place of birth for the foreign-born population - Iraq (%)
Place of birth for the foreign-born population - Israel (%)
Place of birth for the foreign-born population - Jordan (%)
Place of birth for the foreign-born population - Kuwait (%)
Place of birth for the foreign-born population - Lebanon (%)
Place of birth for the foreign-born population - Saudi Arabia (%)
Place of birth for the foreign-born population - Syria (%)
Place of birth for the foreign-born population - Turkey (%)
Place of birth for the foreign-born population - Yemen (%)
Place of birth for the foreign-born population - Other Western Asia (%)
Place of birth for the foreign-born population - Eritrea (%)
Place of birth for the foreign-born population - Ethiopia (%)
Place of birth for the foreign-born population - Kenya (%)
Place of birth for the foreign-born population - Somalia (%)
Place of birth for the foreign-born population - Uganda (%)
Place of birth for the foreign-born population - Zimbabwe (%)
Place of birth for the foreign-born population - Other Eastern Africa (%)
Place of birth for the foreign-born population - Cameroon (%)
Place of birth for the foreign-born population - Congo (%)
Place of birth for the foreign-born population - Democratic Republic of Congo (Zaire) (%)
Place of birth for the foreign-born population - Other Middle Africa (%)
Place of birth for the foreign-born population - Egypt (%)
Place of birth for the foreign-born population - Morocco (%)
Place of birth for the foreign-born population - Sudan (%)
Place of birth for the foreign-born population - Other Northern Africa (%)
Place of birth for the foreign-born population - South Africa (%)
Place of birth for the foreign-born population - Other Southern Africa (%)
Place of birth for the foreign-born population - Cabo Verde (%)
Place of birth for the foreign-born population - Ghana (%)
Place of birth for the foreign-born population - Liberia (%)
Place of birth for the foreign-born population - Nigeria (%)
Place of birth for the foreign-born population - Senegal (%)
Place of birth for the foreign-born population - Sierra Leone (%)
Place of birth for the foreign-born population - Other Western Africa (%)
Place of birth for the foreign-born population - Australia (%)
Place of birth for the foreign-born population - New Zealand (%)
Place of birth for the foreign-born population - Fiji (%)
Place of birth for the foreign-born population - Micronesia (%)
Place of birth for the foreign-born population - Bahamas (%)
Place of birth for the foreign-born population - Barbados (%)
Place of birth for the foreign-born population - Cuba (%)
Place of birth for the foreign-born population - Dominica (%)
Place of birth for the foreign-born population - Dominican Republic (%)
Place of birth for the foreign-born population - Grenada (%)
Place of birth for the foreign-born population - Haiti (%)
Place of birth for the foreign-born population - Jamaica (%)
Place of birth for the foreign-born population - St. Vincent and the Grenadines (%)
Place of birth for the foreign-born population - Trinidad and Tobago (%)
Place of birth for the foreign-born population - West Indies (%)
Place of birth for the foreign-born population - Other Caribbean (%)
Place of birth for the foreign-born population - Belize (%)
Place of birth for the foreign-born population - Costa Rica (%)
Place of birth for the foreign-born population - El Salvador (%)
Place of birth for the foreign-born population - Guatemala (%)
Place of birth for the foreign-born population - Honduras (%)
Place of birth for the foreign-born population - Mexico (%)
Place of birth for the foreign-born population - Nicaragua (%)
Place of birth for the foreign-born population - Panama (%)
Place of birth for the foreign-born population - Other Central America (%)
Place of birth for the foreign-born population - Argentina (%)
Place of birth for the foreign-born population - Bolivia (%)
Place of birth for the foreign-born population - Brazil (%)
Place of birth for the foreign-born population - Chile (%)
Place of birth for the foreign-born population - Colombia (%)
Place of birth for the foreign-born population - Ecuador (%)
Place of birth for the foreign-born population - Guyana (%)
Place of birth for the foreign-born population - Peru (%)
Place of birth for the foreign-born population - Uruguay (%)
Place of birth for the foreign-born population - Venezuela (%)
Place of birth for the foreign-born population - Other South America (%)
Place of birth for the foreign-born population - Canada (%)
Place of birth for the foreign-born population - Other Northern America (%)
Place of birth for the foreign-born population - Other (%)
Latest news about races in Beckley, WV collected exclusively by city-data.com from local newspapers, TV, and radio stations
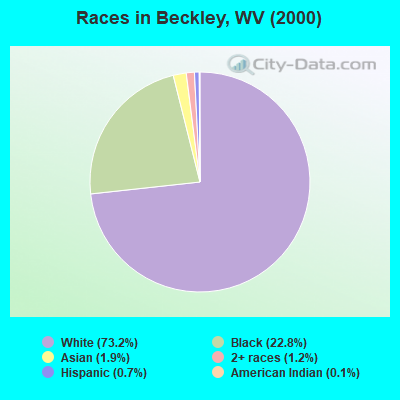
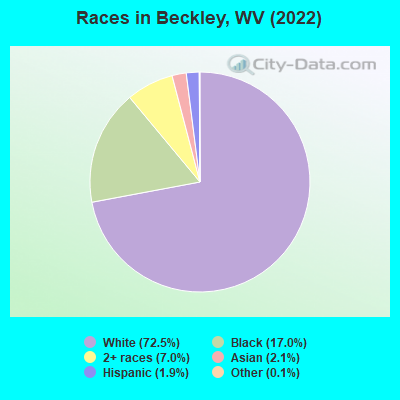
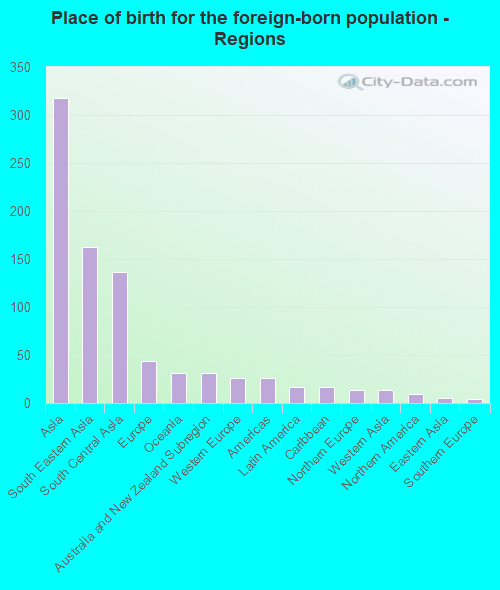
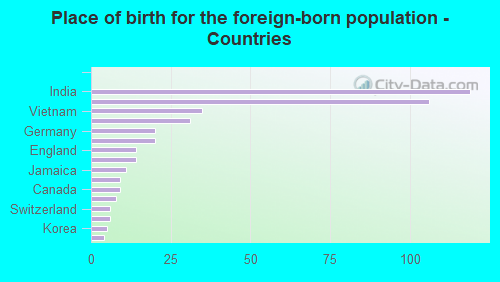
According to 2022 data, the most numerous races in Beckley, WV are White alone (12,289 residents), Two or more races (1,185 residents), and Black alone (2,887 residents). 94.2% of Beckley residents speak English at home. 2.5% of Beckley, WV residents are foreign-born (1.8% born in Asia, 0.3% born in Europe), which is 60.1% greater than the foreign-born rate of 1.0% across the entire state of West Virginia.
Race distribution in Beckley
2000 2022
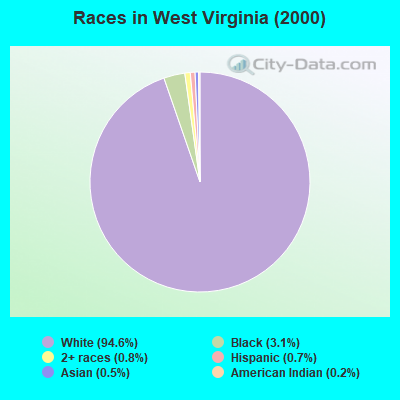
1,709,966 94.6% White alone 56,825 3.1% Black alone 14,983 0.8% Two or more races 12,279 0.7% Hispanic 9,356 0.5% Asian alone 3,456 0.2% American Indian alone 1,144 0.06% Other race alone 335 0.02% Native Hawaiian and Other
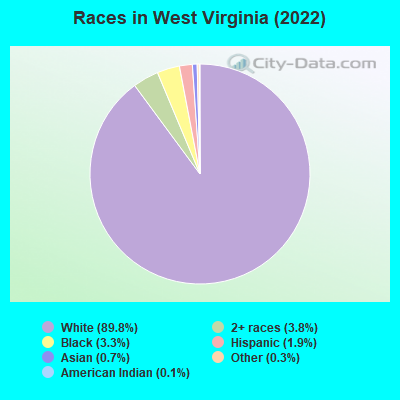
1,594,128 89.8% White alone 66,932 3.8% Two or more races 59,390 3.3% Black alone 34,343 1.9% Hispanic 13,134 0.7% Asian alone 5,238 0.3% Other race alone 1,880 0.1% American Indian alone 111 0.01% Native Hawaiian and Other
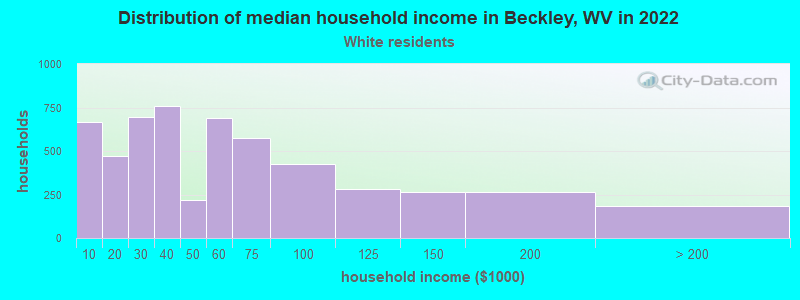
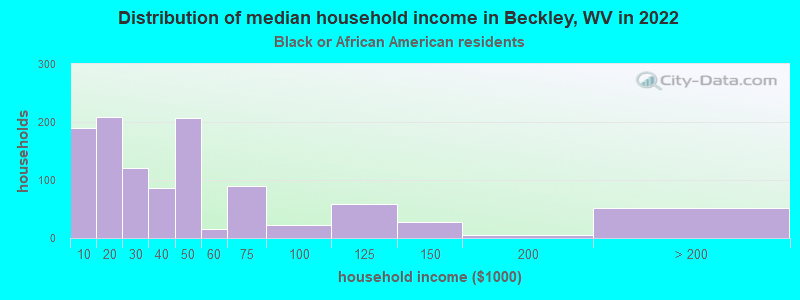
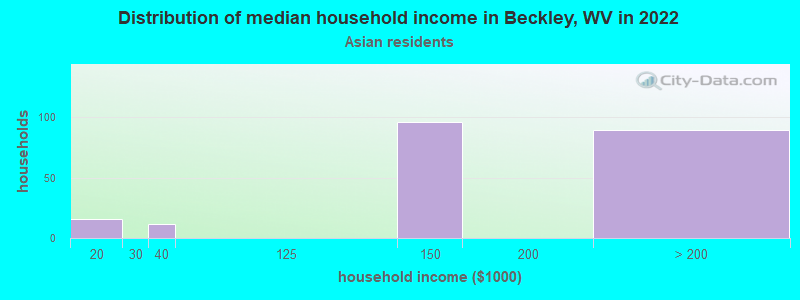
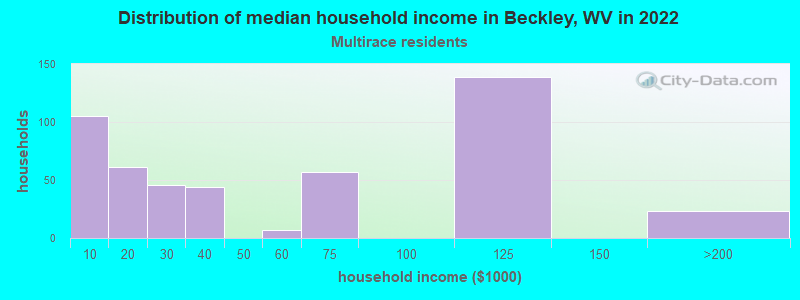
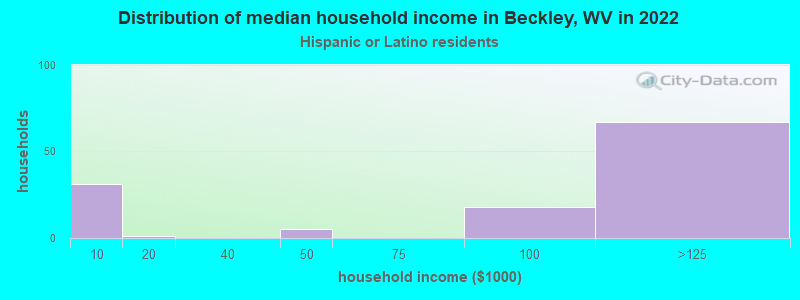
Income and house value in Beckley Median household income in 2022 $42,075 White non-Hispanic householders$31,168 Black householdersover $200,000 Asian householders$98,494 Hispanic or Latino race householdersMedian 2022 house value $171,045 White Non-Hispanic householders$109,149 Black or African American householders $432,605 Asian householders$122,016 Some other race householders$360,504 Two or more races householders$142,648 Hispanic or Latino householders
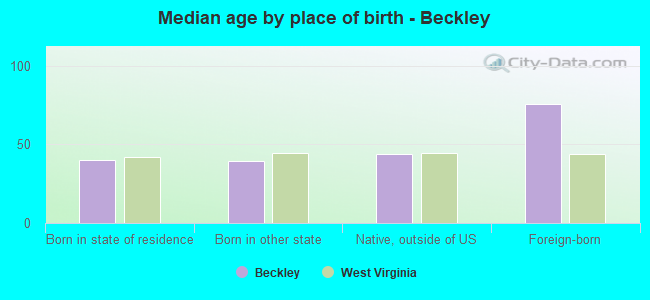
Median age by race in Beckley
42.0 Median age for White residents36.4 45.0 42.9 Median age for Black or African American residents34.2 59.3 -666,666,666.0 Median age for American Indian / Alaska Native residents-666,666,666.0 -666,666,666.0 73.6 Median age for Asian residents66.9 85.6 -666,666,666.0 Median age for Native Hawaiian / Pacific Islander residents-666,666,666.0 -666,666,666.0 5.2 Median age for Other race residents-764,285,713.5 -712,172,923.1 24.1 Median age for Two or more races residents17.8 41.2 42.1 Median age for White alone residents36.5 45.3 39.9 Median age for Hispanic or Latino residents29.1 83.5
Owner/renter occupied households by race in Beckley
House owners and renters - White residents 3,171 58.9% Owner occupied2,209 41.1% Renter occupiedHouse owners and renters - Black or African American residents 509 46.3% Owner occupied591 53.7% Renter occupiedHouse owners and renters - Asian residents 193 87.8% Owner occupied27 12.2% Renter occupiedHouse owners and renters - Two or more races residents 87 16.3% Owner occupied450 83.7% Renter occupiedHouse owners and renters - White alone residents 3,160 58.8% Owner occupied2,219 41.2% Renter occupiedHouse owners and renters - Hispanic or Latino residents 30 23.1% Owner occupied100 76.9% Renter occupied
Language usage in Beckley
English speakers - Total 94.2% of residents of Beckley speak English at home.
2.8% of residents speak Spanish at home 436 95.4% Speak English very well21 4.6% Speak English less than very well2.8% of residents speak other language at home 411 92.8% Speak English very well32 7.2% Speak English less than very well
English speakers - Born in the United States 90.8% of residents of Beckley speak English at home.
8.9% of residents speak Spanish at home 375 100.0% Speak English very well0.5% of residents speak other language at home 21 100.0% Speak English very well
English speakers - Native, born elsewhere 23.0% of residents of Beckley speak English at home.
85.1% of residents speak Spanish at home 63 100.0% Speak English very well
English speakers - Foreign-born 23.2% of residents of Beckley speak English at home.
1.9% of residents speak Spanish at home 9 100.0% Speak English less than very well70.1% of residents speak other language at home 293 90.4% Speak English very well31 9.6% Speak English less than very well
White (Caucasian) - Speak only English Native:
96.8% (11,213)Foreign-born:
90.7% (92)
White (Caucasian) - Speak another language Native:
2.7% (313)Foreign-born:
24.4% (25)
Black or African American - Speak only English Native:
99.8% (2,695)Foreign-born:
88.1% (12)
Asian - Speak only English Native:
100.0% (73)Foreign-born:
3.1% (9)
Two or more races - Speak another language Native:
22.1% (299)Foreign-born:
100.0% (12)
White alone - Speak only English Native:
97.0% (11,206)Foreign-born:
87.9% (95)
White alone - Speak another language Native:
2.5% (291)Foreign-born:
23.4% (25)
Hispanic or Latino - Speak another language Native:
99.2% (291)Foreign-born:
100.0% (8)
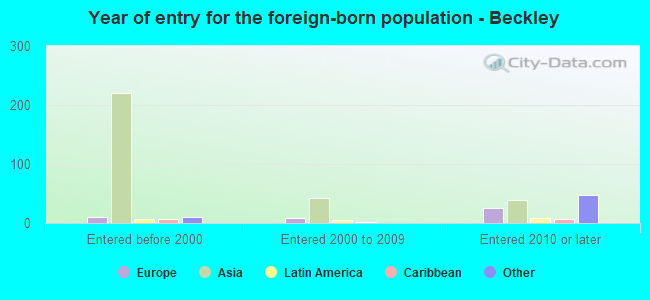
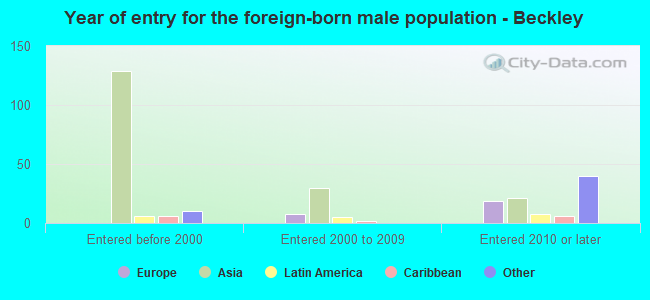
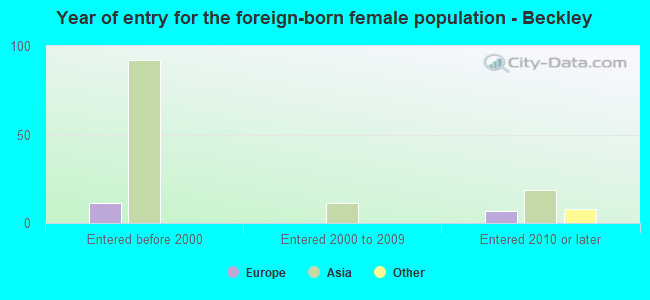
Foreign-born residents in Beckley 421 residents are foreign born (1.8% Asia , 0.3% Europe ).
This city:
2.5%West Virginia:
1.6%
Marital status for residents in Beckley Marital status - White (Caucasian) population 15 years and over
Males 34.4% Never married42.0% Now married0.7% Separated3.7% Widowed19.3% DivorcedFemales 23.2% Never married39.2% Now married1.0% Separated16.9% Widowed19.7% DivorcedWomen who gave birth in the past 12 months Now married:
17.8% (16)Unmarried:
82.2% (72)
Women who did not give birth in the past 12 months Now married:
40.7% (1,032)Unmarried:
59.3% (1,504)
Marital status - Black or African American population 15 years and over
Males 61.1% Never married22.6% Now married1.6% Separated3.6% Widowed11.1% DivorcedFemales 43.7% Never married23.2% Now married1.5% Separated9.5% Widowed22.1% DivorcedWomen who gave birth in the past 12 months Now married:
0.0% (0)Unmarried:
100.0% (117)
Women who did not give birth in the past 12 months Now married:
7.1% (42)Unmarried:
92.9% (545)
Marital status - Asian population 15 years and over
Males 13.8% Never married86.2% Now married0.0% Separated0.0% Widowed0.0% DivorcedFemales 6.9% Never married93.1% Now married0.0% Separated0.0% Widowed0.0% DivorcedWomen who did not give birth in the past 12 months Now married:
71.4% (20)Unmarried:
28.6% (8)
Marital status - Two or more races population 15 years and over
Males 64.0% Never married30.0% Now married0.0% Separated0.0% Widowed6.0% DivorcedFemales 44.9% Never married35.8% Now married0.0% Separated1.4% Widowed17.9% DivorcedWomen who gave birth in the past 12 months Now married:
100.0% (55)Unmarried:
0.0% (0)
Women who did not give birth in the past 12 months Now married:
38.9% (126)Unmarried:
61.1% (198)
Marital status - White alone, not Hispanic / Latino population 15 years and over
Males 34.3% Never married42.0% Now married0.7% Separated3.7% Widowed19.3% DivorcedFemales 23.4% Never married39.6% Now married1.0% Separated17.1% Widowed19.0% DivorcedWomen who gave birth in the past 12 months Now married:
18.2% (16)Unmarried:
81.8% (71)
Women who did not give birth in the past 12 months Now married:
41.5% (1,042)Unmarried:
58.5% (1,469)
Marital status - Hispanic or Latino population 15 years and over
Males 31.8% Never married54.3% Now married0.0% Separated9.3% Widowed4.7% DivorcedFemales 35.8% Never married35.2% Now married0.0% Separated0.0% Widowed29.0% DivorcedWomen who gave birth in the past 12 months Now married:
0.0% (0)Unmarried:
100.0% (2)
Women who did not give birth in the past 12 months Now married:
53.0% (61)Unmarried:
47.0% (54)
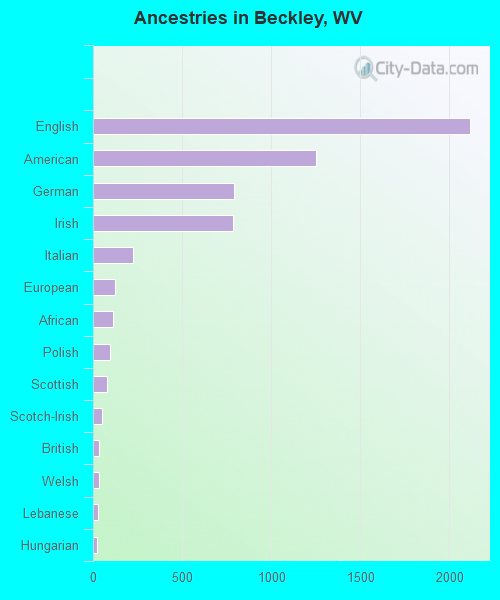
Ancestries in Beckley
2,116 24.3% English1,249 14.3% American790 9.1% German787 9.0% Irish222 2.5% Italian121 1.4% European110 1.3% African95 1.1% Polish77 0.9% Scottish53 0.6% Scotch-Irish35 0.4% British31 0.4% Welsh29 0.3% Lebanese22 0.3% Hungarian19 0.2% Eastern European16 0.2% Pennsylvania German14 0.2% Australian13 0.1% Israeli11 0.1% Dutch11 0.1% Norwegian10 0.1% Czechoslovakian9 0.1% Iranian7 0.08% Greek3 0.03% Portuguese3 0.03% Jamaican
Geographical mobility in Beckley Same house 1 year ago 9,612 78.2% White (Caucasian)2,778 99.5% Black or African American346 95.9% Asian24 100.0% Other race1,189 83.4% Two or more races9,587 78.3% White alone, not Hispanic / Latino232 70.4% Hispanic or LatinoMoved within same county 1,057 8.6% White / Caucasian59 2.1% Black or African American19 1.3% Two or more races1,035 8.5% White alone, not Hispanic / Latino9 2.9% Hispanic or LatinoMoved within same state 1,077 8.8% White / Caucasian8 0.3% Black or African American125 8.8% Two or more races1,093 8.9% White alone, not Hispanic / LatinoMoved from different state 392 3.2% White / Caucasian15 0.5% Black or African American11 3.0% Asian3 99.3% Native Hawaiian / Pacific Islander30 2.1% Two or more races365 3.0% White alone, not Hispanic / Latino24 7.2% Hispanic or LatinoMoved from abroad 27 0.2% White59 4.2% Two or more races27 0.2% White alone, not Hispanic / Latino85 25.7% Hispanic or Latino
Children Nativity (place of birth) in Beckley
Children under 6 years - Living with two parents Both parents native 510 100.0% NativeOne native, one foreign-born parent 24 100.0% NativeChildren under 6 years - Living with one parent Native parent 292 100.0% Native
Children 6 to 17 years - Living with two parents Both parents native 1,008 100.0% NativeBoth parents foreign-born 74 100.0% NativeOne native, one foreign-born parent 72 100.0% NativeChildren 6 to 17 years - Living with one parent Native parent 1,441 100.0% Native
Grandparents responsible for own grandchildren in Beckley
Grandparents (30 to 59 years) White / Caucasian 57 78.5% Responsible for grandchildren16 21.5% Not responsible for grandchildrenTwo or more races 22 100.0% Responsible for grandchildrenWhite alone, not Hispanic / Latino 57 78.5% Responsible for grandchildren16 21.5% Not responsible for grandchildrenGrandparents (60 years and over) White / Caucasian 53 46.4% Responsible for grandchildren61 53.6% Not responsible for grandchildrenTwo or more races 72 100.0% Not responsible for grandchildrenWhite alone, not Hispanic / Latino 53 46.1% Responsible for grandchildren61 53.9% Not responsible for grandchildren