Races in Bellair-Meadowbrook Terrace, Florida (FL) Detailed Stats
Data:
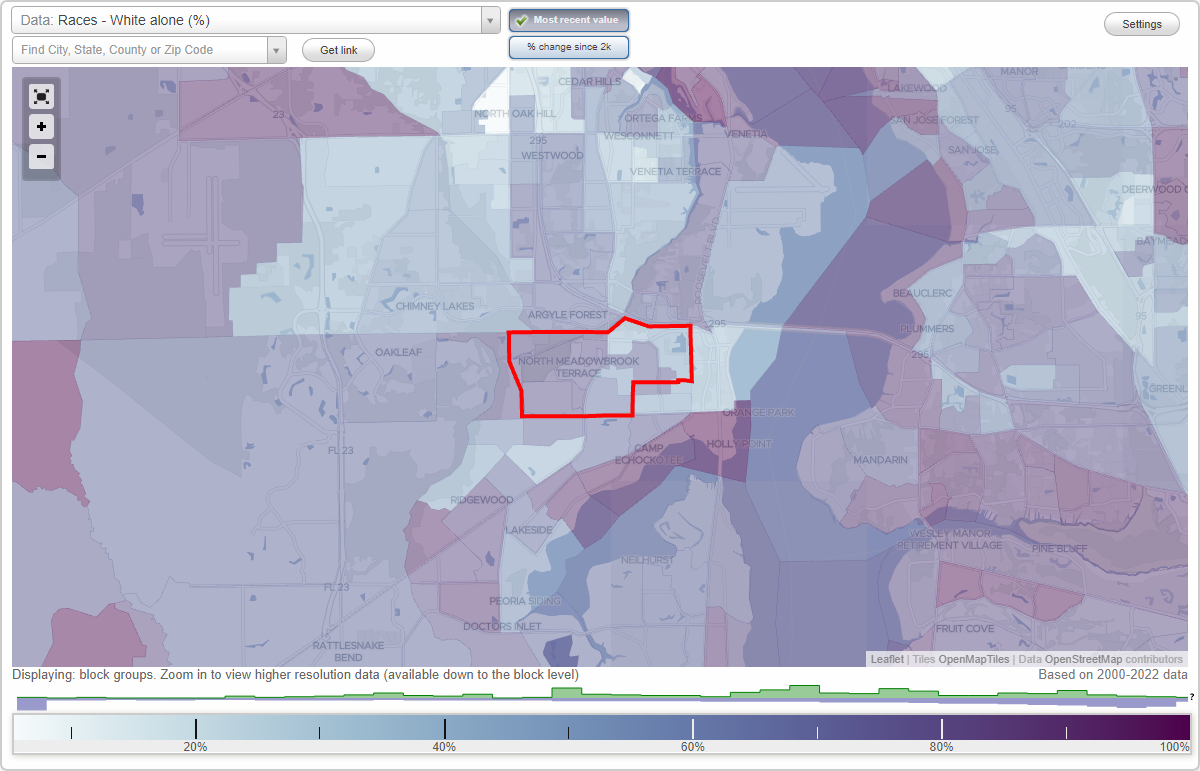
Races - White alone (%)
Races - White alone (% change since 2000)
Races - Black alone (%)
Races - Black alone (% change since 2000)
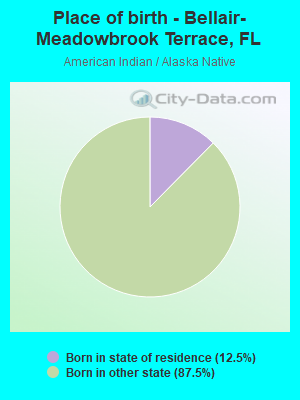
Races - American Indian alone (%)
Races - American Indian alone (% change since 2000)
Races - Asian alone (%)
Races - Asian alone (% change since 2000)
Races - Hispanic (%)
Races - Hispanic (% change since 2000)
Races - Native Hawaiian and Other Pacific Islander alone (%)
Races - Native Hawaiian and Other Pacific Islander alone (% change since 2000)
Races - Two or more races(%)
Races - Two or more races(% change since 2000)
Races - Other race alone (%)
Races - Other race alone (% change since 2000)
Racial diversity
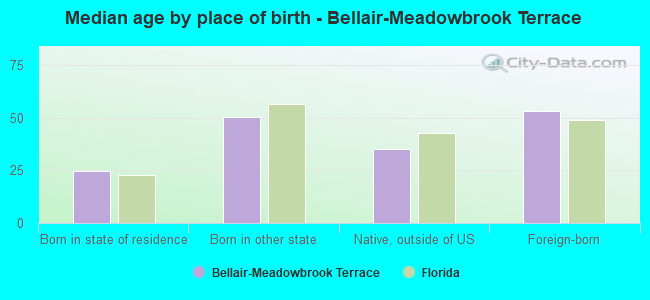
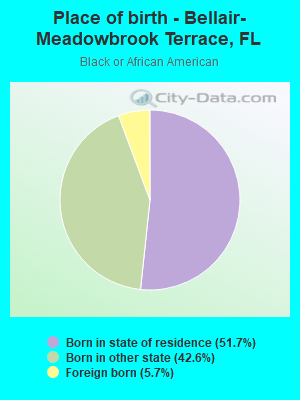
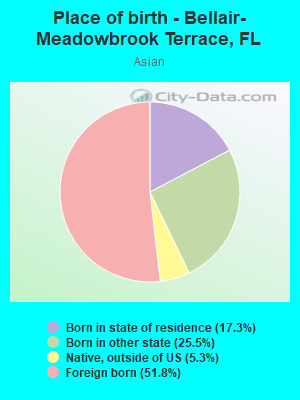
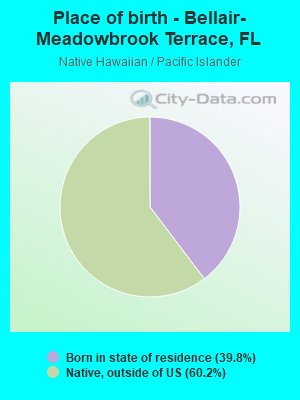
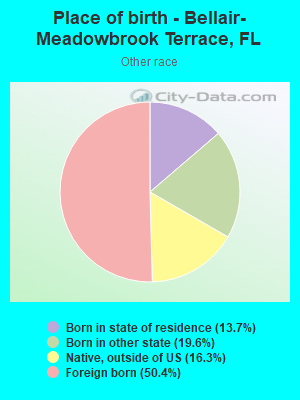
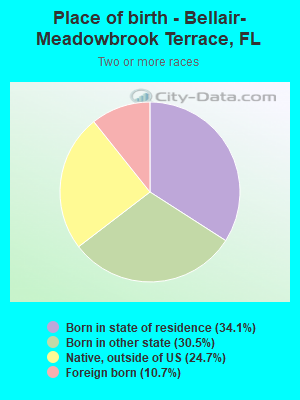
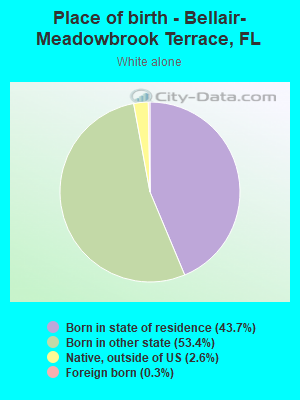
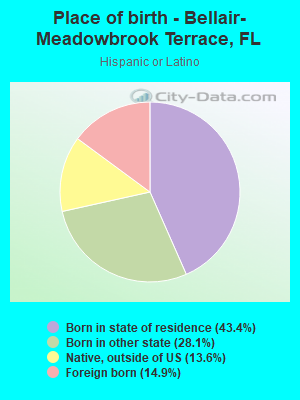
Place of birth - Born in state of residence (%)
Place of birth - Born in state of residence (%) - White
Place of birth - Born in state of residence (%) - Black or African American
Place of birth - Born in state of residence (%) - Asian
Place of birth - Born in state of residence (%) - Hispanic or Latino
Place of birth - Born in state of residence (%) - American Indian and Alaska Native
Place of birth - Born in state of residence (%) - Multirace
Place of birth - Born in state of residence (%) - Other Race
Place of birth - Born in other state (%)
Place of birth - Born in other state (%) - White
Place of birth - Born in other state (%) - Black or African American
Place of birth - Born in other state (%) - Asian
Place of birth - Born in other state (%) - Hispanic or Latino
Place of birth - Born in other state (%) - American Indian and Alaska Native
Place of birth - Born in other state (%) - Multirace
Place of birth - Born in other state (%) - Other Race
Place of birth - Native, outside of US (%)
Place of birth - Native, outside of US (%) - White
Place of birth - Native, outside of US (%) - Black or African American
Place of birth - Native, outside of US (%) - Asian
Place of birth - Native, outside of US (%) - Hispanic or Latino
Place of birth - Native, outside of US (%) - American Indian and Alaska Native
Place of birth - Native, outside of US (%) - Multirace
Place of birth - Native, outside of US (%) - Other Race
Place of birth - Foreign born (%)
Place of birth - Foreign born (%) - White
Place of birth - Foreign born (%) - Black or African American
Place of birth - Foreign born (%) - Asian
Place of birth - Foreign born (%) - Hispanic or Latino
Place of birth - Foreign born (%) - American Indian and Alaska Native
Place of birth - Foreign born (%) - Multirace
Place of birth - Foreign born (%) - Other Race
Residents speaking English at home (%)
Residents speaking English at home - Born in the United States (%)
Residents speaking English at home - Native, born elsewhere (%)
Residents speaking English at home - Foreign born (%)
Residents speaking Spanish at home (%)
Residents speaking Spanish at home - Born in the United States (%)
Residents speaking Spanish at home - Native, born elsewhere (%)
Residents speaking Spanish at home - Foreign born (%)
Residents speaking other language at home (%)
Residents speaking other language at home - Born in the United States (%)
Residents speaking other language at home - Native, born elsewhere (%)
Residents speaking other language at home - Foreign born (%)
Marital status - Never married (%)
Marital status - Now married (%)
Marital status - Separated (%)
Marital status - Widowed (%)
Marital status - Divorced (%)
Ancestries Reported - Arab (%)
Ancestries Reported - Czech (%)
Ancestries Reported - Danish (%)
Ancestries Reported - Dutch (%)
Ancestries Reported - English (%)
Ancestries Reported - French (%)
Ancestries Reported - French Canadian (%)
Ancestries Reported - German (%)
Ancestries Reported - Greek (%)
Ancestries Reported - Hungarian (%)
Ancestries Reported - Irish (%)
Ancestries Reported - Italian (%)
Ancestries Reported - Lithuanian (%)
Ancestries Reported - Norwegian (%)
Ancestries Reported - Polish (%)
Ancestries Reported - Portuguese (%)
Ancestries Reported - Russian (%)
Ancestries Reported - Scotch-Irish (%)
Ancestries Reported - Scottish (%)
Ancestries Reported - Slovak (%)
Ancestries Reported - Subsaharan African (%)
Ancestries Reported - Swedish (%)
Ancestries Reported - Swiss (%)
Ancestries Reported - Ukrainian (%)
Ancestries Reported - United States (%)
Ancestries Reported - Welsh (%)
Ancestries Reported - West Indian (%)
Ancestries Reported - Other (%)
Geographical mobility - Same house 1 year ago (%)
Geographical mobility - Same house 1 year ago (%) - White
Geographical mobility - Same house 1 year ago (%) - Black or African American
Geographical mobility - Same house 1 year ago (%) - Asian
Geographical mobility - Same house 1 year ago (%) - Hispanic or Latino
Geographical mobility - Same house 1 year ago (%) - American Indian and Alaska Native
Geographical mobility - Same house 1 year ago (%) - Multirace
Geographical mobility - Same house 1 year ago (%) - Other Race
Geographical mobility - Moved within same county (%)
Geographical mobility - Moved within same county (%) - White
Geographical mobility - Moved within same county (%) - Black or African American
Geographical mobility - Moved within same county (%) - Asian
Geographical mobility - Moved within same county (%) - Hispanic or Latino
Geographical mobility - Moved within same county (%) - American Indian and Alaska Native
Geographical mobility - Moved within same county (%) - Multirace
Geographical mobility - Moved within same county (%) - Other Race
Geographical mobility - Moved from different county within same state (%)
Geographical mobility - Moved from different county within same state (%) - White
Geographical mobility - Moved from different county within same state (%) - Black or African American
Geographical mobility - Moved from different county within same state (%) - Asian
Geographical mobility - Moved from different county within same state (%) - Hispanic or Latino
Geographical mobility - Moved from different county within same state (%) - American Indian and Alaska Native
Geographical mobility - Moved from different county within same state (%) - Multirace
Geographical mobility - Moved from different county within same state (%) - Other Race
Geographical mobility - Moved from different state (%)
Geographical mobility - Moved from different state (%) - White
Geographical mobility - Moved from different state (%) - Black or African American
Geographical mobility - Moved from different state (%) - Asian
Geographical mobility - Moved from different state (%) - Hispanic or Latino
Geographical mobility - Moved from different state (%) - American Indian and Alaska Native
Geographical mobility - Moved from different state (%) - Multirace
Geographical mobility - Moved from different state (%) - Other Race
Geographical mobility - Moved from abroad (%)
Geographical mobility - Moved from abroad (%) - White
Geographical mobility - Moved from abroad (%) - Black or African American
Geographical mobility - Moved from abroad (%) - Asian
Geographical mobility - Moved from abroad (%) - Hispanic or Latino
Geographical mobility - Moved from abroad (%) - American Indian and Alaska Native
Geographical mobility - Moved from abroad (%) - Multirace
Geographical mobility - Moved from abroad (%) - Other Race
Place of birth for the foreign-born population - Ireland (%)
Place of birth for the foreign-born population - Denmark (%)
Place of birth for the foreign-born population - Norway (%)
Place of birth for the foreign-born population - Sweden (%)
Place of birth for the foreign-born population - United Kingdom (%)
Place of birth for the foreign-born population - England (%)
Place of birth for the foreign-born population - Scotland (%)
Place of birth for the foreign-born population - Other Northern Europe (%)
Place of birth for the foreign-born population - Austria (%)
Place of birth for the foreign-born population - Belgium (%)
Place of birth for the foreign-born population - France (%)
Place of birth for the foreign-born population - Germany (%)
Place of birth for the foreign-born population - Netherlands (%)
Place of birth for the foreign-born population - Switzerland (%)
Place of birth for the foreign-born population - Other Western Europe (%)
Place of birth for the foreign-born population - Greece (%)
Place of birth for the foreign-born population - Italy (%)
Place of birth for the foreign-born population - Portugal (%)
Place of birth for the foreign-born population - Spain (%)
Place of birth for the foreign-born population - Other Southern Europe (%)
Place of birth for the foreign-born population - Albania (%)
Place of birth for the foreign-born population - Belarus (%)
Place of birth for the foreign-born population - Bosnia and Herzegovina (%)
Place of birth for the foreign-born population - Bulgaria (%)
Place of birth for the foreign-born population - Croatia (%)
Place of birth for the foreign-born population - Czechoslovakia (%)
Place of birth for the foreign-born population - Hungary (%)
Place of birth for the foreign-born population - Latvia (%)
Place of birth for the foreign-born population - Lithuania (%)
Place of birth for the foreign-born population - North Macedonia (Macedonia) (%)
Place of birth for the foreign-born population - Moldova (%)
Place of birth for the foreign-born population - Poland (%)
Place of birth for the foreign-born population - Romania (%)
Place of birth for the foreign-born population - Russia (%)
Place of birth for the foreign-born population - Serbia (%)
Place of birth for the foreign-born population - Ukraine (%)
Place of birth for the foreign-born population - Other Eastern Europe (%)
Place of birth for the foreign-born population - China (%)
Place of birth for the foreign-born population - Hong Kong (%)
Place of birth for the foreign-born population - Taiwan (%)
Place of birth for the foreign-born population - Japan (%)
Place of birth for the foreign-born population - Korea (%)
Place of birth for the foreign-born population - Other Eastern Asia (%)
Place of birth for the foreign-born population - Afghanistan (%)
Place of birth for the foreign-born population - Bangladesh (%)
Place of birth for the foreign-born population - India (%)
Place of birth for the foreign-born population - Iran (%)
Place of birth for the foreign-born population - Kazakhstan (%)
Place of birth for the foreign-born population - Nepal (%)
Place of birth for the foreign-born population - Pakistan (%)
Place of birth for the foreign-born population - Sri Lanka (%)
Place of birth for the foreign-born population - Uzbekistan (%)
Place of birth for the foreign-born population - Other South Central Asia (%)
Place of birth for the foreign-born population - Burma (%)
Place of birth for the foreign-born population - Cambodia (%)
Place of birth for the foreign-born population - Indonesia (%)
Place of birth for the foreign-born population - Laos (%)
Place of birth for the foreign-born population - Malaysia (%)
Place of birth for the foreign-born population - Philippines (%)
Place of birth for the foreign-born population - Singapore (%)
Place of birth for the foreign-born population - Thailand (%)
Place of birth for the foreign-born population - Vietnam (%)
Place of birth for the foreign-born population - Other South Eastern Asia (%)
Place of birth for the foreign-born population - Armenia (%)
Place of birth for the foreign-born population - Iraq (%)
Place of birth for the foreign-born population - Israel (%)
Place of birth for the foreign-born population - Jordan (%)
Place of birth for the foreign-born population - Kuwait (%)
Place of birth for the foreign-born population - Lebanon (%)
Place of birth for the foreign-born population - Saudi Arabia (%)
Place of birth for the foreign-born population - Syria (%)
Place of birth for the foreign-born population - Turkey (%)
Place of birth for the foreign-born population - Yemen (%)
Place of birth for the foreign-born population - Other Western Asia (%)
Place of birth for the foreign-born population - Eritrea (%)
Place of birth for the foreign-born population - Ethiopia (%)
Place of birth for the foreign-born population - Kenya (%)
Place of birth for the foreign-born population - Somalia (%)
Place of birth for the foreign-born population - Uganda (%)
Place of birth for the foreign-born population - Zimbabwe (%)
Place of birth for the foreign-born population - Other Eastern Africa (%)
Place of birth for the foreign-born population - Cameroon (%)
Place of birth for the foreign-born population - Congo (%)
Place of birth for the foreign-born population - Democratic Republic of Congo (Zaire) (%)
Place of birth for the foreign-born population - Other Middle Africa (%)
Place of birth for the foreign-born population - Egypt (%)
Place of birth for the foreign-born population - Morocco (%)
Place of birth for the foreign-born population - Sudan (%)
Place of birth for the foreign-born population - Other Northern Africa (%)
Place of birth for the foreign-born population - South Africa (%)
Place of birth for the foreign-born population - Other Southern Africa (%)
Place of birth for the foreign-born population - Cabo Verde (%)
Place of birth for the foreign-born population - Ghana (%)
Place of birth for the foreign-born population - Liberia (%)
Place of birth for the foreign-born population - Nigeria (%)
Place of birth for the foreign-born population - Senegal (%)
Place of birth for the foreign-born population - Sierra Leone (%)
Place of birth for the foreign-born population - Other Western Africa (%)
Place of birth for the foreign-born population - Australia (%)
Place of birth for the foreign-born population - New Zealand (%)
Place of birth for the foreign-born population - Fiji (%)
Place of birth for the foreign-born population - Micronesia (%)
Place of birth for the foreign-born population - Bahamas (%)
Place of birth for the foreign-born population - Barbados (%)
Place of birth for the foreign-born population - Cuba (%)
Place of birth for the foreign-born population - Dominica (%)
Place of birth for the foreign-born population - Dominican Republic (%)
Place of birth for the foreign-born population - Grenada (%)
Place of birth for the foreign-born population - Haiti (%)
Place of birth for the foreign-born population - Jamaica (%)
Place of birth for the foreign-born population - St. Vincent and the Grenadines (%)
Place of birth for the foreign-born population - Trinidad and Tobago (%)
Place of birth for the foreign-born population - West Indies (%)
Place of birth for the foreign-born population - Other Caribbean (%)
Place of birth for the foreign-born population - Belize (%)
Place of birth for the foreign-born population - Costa Rica (%)
Place of birth for the foreign-born population - El Salvador (%)
Place of birth for the foreign-born population - Guatemala (%)
Place of birth for the foreign-born population - Honduras (%)
Place of birth for the foreign-born population - Mexico (%)
Place of birth for the foreign-born population - Nicaragua (%)
Place of birth for the foreign-born population - Panama (%)
Place of birth for the foreign-born population - Other Central America (%)
Place of birth for the foreign-born population - Argentina (%)
Place of birth for the foreign-born population - Bolivia (%)
Place of birth for the foreign-born population - Brazil (%)
Place of birth for the foreign-born population - Chile (%)
Place of birth for the foreign-born population - Colombia (%)
Place of birth for the foreign-born population - Ecuador (%)
Place of birth for the foreign-born population - Guyana (%)
Place of birth for the foreign-born population - Peru (%)
Place of birth for the foreign-born population - Uruguay (%)
Place of birth for the foreign-born population - Venezuela (%)
Place of birth for the foreign-born population - Other South America (%)
Place of birth for the foreign-born population - Canada (%)
Place of birth for the foreign-born population - Other Northern America (%)
Place of birth for the foreign-born population - Other (%)
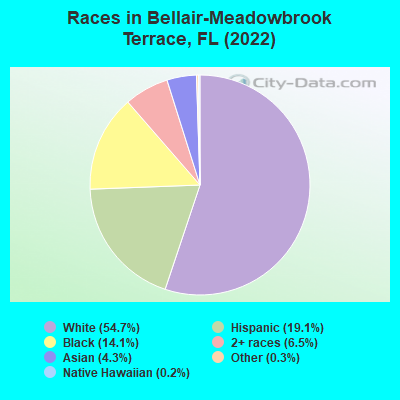
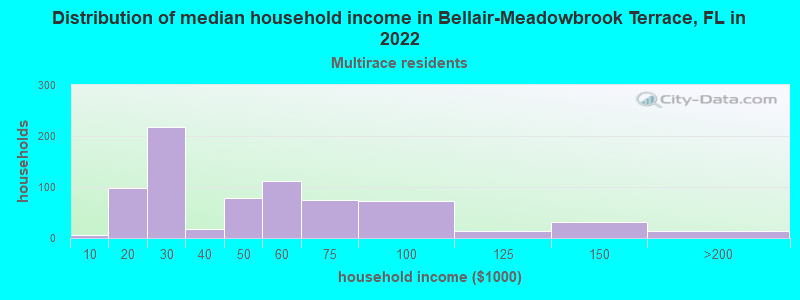
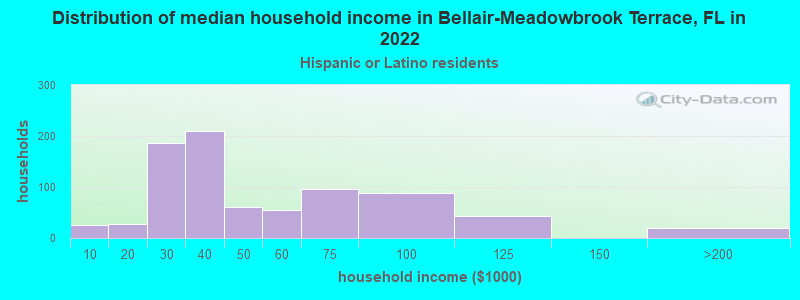
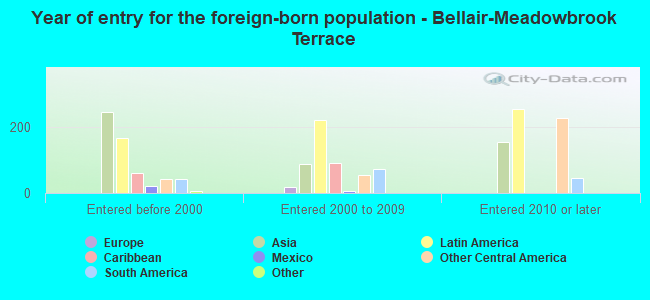
According to 2022 data, the most numerous races in Bellair-Meadowbrook Terrace, FL are White alone (7,817 residents), Hispanic (2,735 residents), and Black alone (2,011 residents). 85.3% of Bellair-Meadowbrook Terrace residents speak English at home. 8.1% of Bellair-Meadowbrook Terrace, FL residents are foreign-born (4.4% born in Latin America, 3.4% born in Asia), which is 160.0% less than the foreign-born rate of 21.0% across the entire state of Florida.
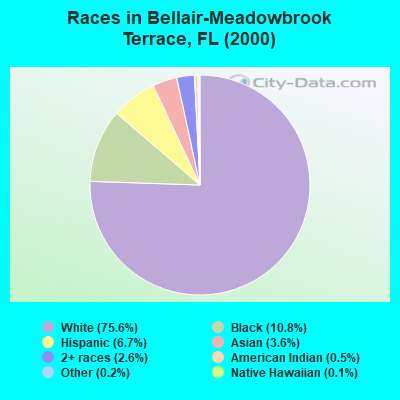
Race distribution in Bellair-Meadowbrook Terrace
2000 2022
10,458,509 65.4% White alone 2,682,715 16.8% Hispanic 2,264,268 14.2% Black alone 261,693 1.6% Asian alone 236,954 1.5% Two or more races 42,358 0.3% American Indian alone 28,994 0.2% Other race alone 6,887 0.04% Native Hawaiian and Other
11,309,403 50.8% White alone 6,025,039 27.1% Hispanic 3,241,015 14.6% Black alone 861,630 3.9% Two or more races 623,692 2.8% Asian alone 152,054 0.7% Other race alone 22,504 0.1% American Indian alone 9,486 0.04% Native Hawaiian and Other
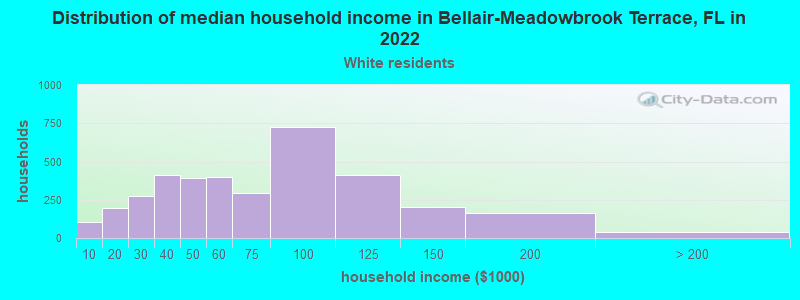
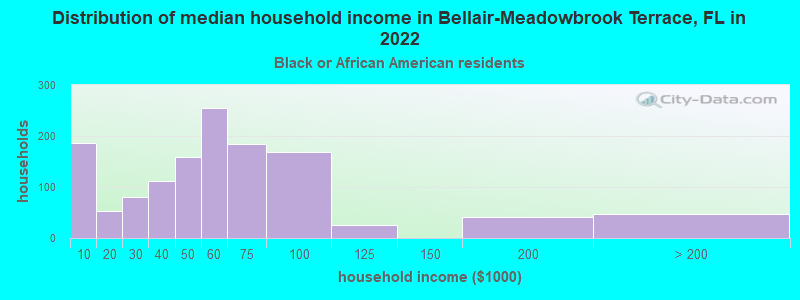
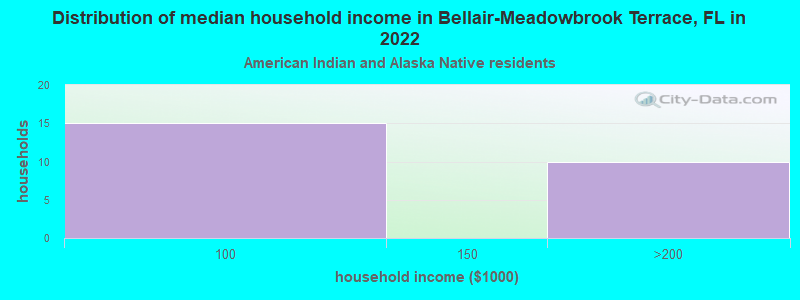
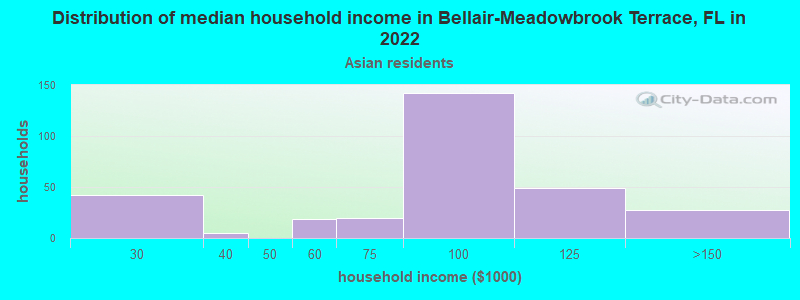
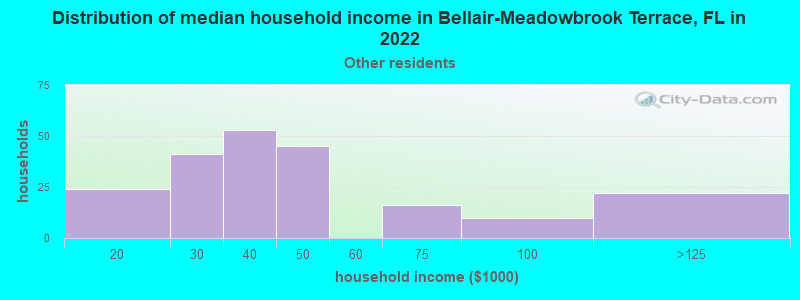
Income and house value in Bellair-Meadowbrook Terrace Median household income in 2022 $66,590 White non-Hispanic householders$55,562 Black householders$75,608 Asian householders$45,878 Some other race householders$37,581 Two or more races householders$41,851 Hispanic or Latino race householdersMedian 2022 house value $241,677 White Non-Hispanic householders$231,351 Black or African American householders$209,304 American Indian or Alaska Native householders $274,049 Asian householders$232,468 Some other race householders$238,049 Two or more races householders$222,421 Hispanic or Latino householders
Median age by race in Bellair-Meadowbrook Terrace
34.8 Median age for White residents35.1 35.1 45.5 Median age for Black or African American residents43.1 44.0 40.4 Median age for American Indian / Alaska Native residents40.7 -594,925,633.7 56.4 Median age for Asian residents55.0 59.3 -679,849,340.2 Median age for Native Hawaiian / Pacific Islander residents-666,666,666.0 -666,666,666.0 53.3 Median age for Other race residents44.6 48.6 35.9 Median age for Two or more races residents35.4 33.5 38.3 Median age for White alone residents38.1 38.0 28.6 Median age for Hispanic or Latino residents20.2 33.7
Owner/renter occupied households by race in Bellair-Meadowbrook Terrace
House owners and renters - White residents 1,922 52.4% Owner occupied1,743 47.6% Renter occupiedHouse owners and renters - Black or African American residents 285 22.8% Owner occupied962 77.2% Renter occupiedHouse owners and renters - American Indian / Alaska Native residents 23 100.0% Renter occupiedHouse owners and renters - Asian residents 166 58.7% Owner occupied116 41.3% Renter occupiedHouse owners and renters - Native Hawaiian / Pacific Islander residents 15 29.1% Owner occupied37 70.9% Renter occupiedHouse owners and renters - Other race residents 79 39.1% Owner occupied123 60.9% Renter occupiedHouse owners and renters - Two or more races residents 274 27.0% Owner occupied740 73.0% Renter occupiedHouse owners and renters - White alone residents 1,891 56.6% Owner occupied1,449 43.4% Renter occupiedHouse owners and renters - Hispanic or Latino residents 244 23.3% Owner occupied801 76.7% Renter occupied
Language usage in Bellair-Meadowbrook Terrace
English speakers - Total 85.3% of residents of Bellair-Meadowbrook Terrace speak English at home.
9.2% of residents speak Spanish at home 827 67.6% Speak English very well397 32.4% Speak English less than very well5.0% of residents speak other language at home 310 46.3% Speak English very well359 53.7% Speak English less than very well
English speakers - Born in the United States 95.5% of residents of Bellair-Meadowbrook Terrace speak English at home.
3.1% of residents speak Spanish at home 164 84.5% Speak English very well30 15.5% Speak English less than very well0.8% of residents speak other language at home 49 100.0% Speak English very well
English speakers - Native, born elsewhere 73.3% of residents of Bellair-Meadowbrook Terrace speak English at home.
27.9% of residents speak Spanish at home 185 69.0% Speak English very well83 31.0% Speak English less than very well7.3% of residents speak other language at home 60 85.7% Speak English very well10 14.3% Speak English less than very well
English speakers - Foreign-born 12.3% of residents of Bellair-Meadowbrook Terrace speak English at home.
36.9% of residents speak Spanish at home 116 27.8% Speak English very well301 72.2% Speak English less than very well44.5% of residents speak other language at home 183 36.4% Speak English very well320 63.6% Speak English less than very well
White (Caucasian) - Speak only English Native:
98.6% (7,802)Foreign-born:
5.0% (7)
White (Caucasian) - Speak another language Native:
1.8% (141)Foreign-born:
92.8% (124)
Black or African American - Speak only English Native:
99.5% (2,045)Foreign-born:
69.7% (74)
Black or African American - Speak another language Native:
0.3% (6)Foreign-born:
28.8% (31)
Asian - Speak only English Native:
40.9% (88)Foreign-born:
2.0% (7)
Asian - Speak another language Native:
100.0% (215)Foreign-born:
89.1% (324)
Other race - Speak only English Native:
31.5% (67)Foreign-born:
3.8% (8)
Other race - Speak another language Native:
55.9% (119)Foreign-born:
82.9% (180)
Two or more races - Speak only English Native:
57.2% (1,110)Foreign-born:
3.1% (8)
Two or more races - Speak another language Native:
42.2% (819)Foreign-born:
71.7% (182)
White alone - Speak only English Native:
99.4% (7,075)Foreign-born:
29.2% (7)
White alone - Speak another language Native:
0.8% (55)Foreign-born:
72.1% (17)
Hispanic or Latino - Speak only English Native:
61.3% (1,285)Foreign-born:
2.4% (10)
Hispanic or Latino - Speak another language Native:
38.2% (802)Foreign-born:
93.2% (383)
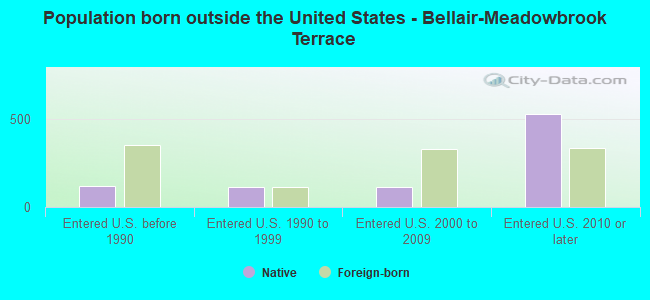
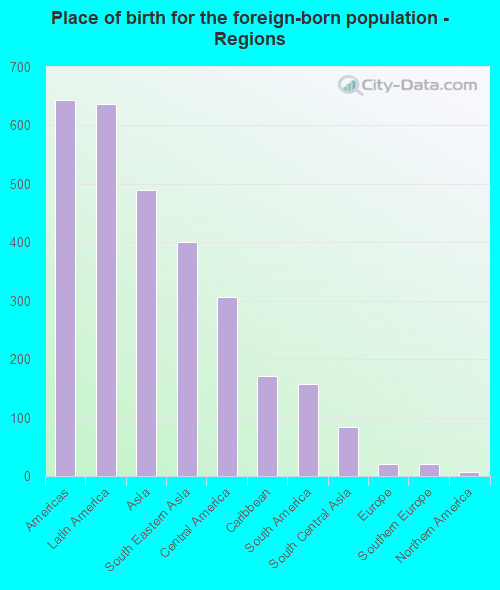
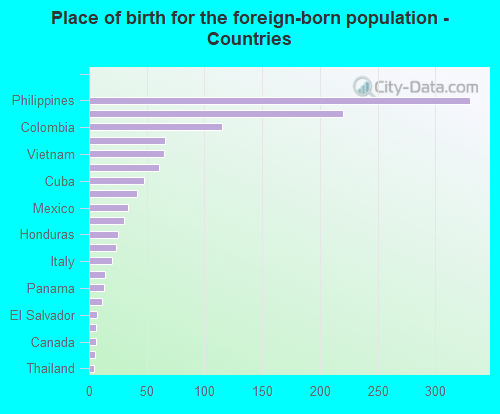
Foreign-born residents in Bellair-Meadowbrook Terrace 1,154 residents are foreign born (4.4% Latin America , 3.4% Asia ).
This city:
8.1%Florida:
21.1%
Marital status for residents in Bellair-Meadowbrook Terrace Marital status - White (Caucasian) population 15 years and over
Males 37.3% Never married41.3% Now married0.9% Separated2.7% Widowed17.8% DivorcedFemales 29.4% Never married39.6% Now married2.0% Separated11.2% Widowed17.8% DivorcedWomen who gave birth in the past 12 months Now married:
70.0% (76)Unmarried:
30.0% (33)
Women who did not give birth in the past 12 months Now married:
35.5% (708)Unmarried:
64.5% (1,284)
Marital status - Black or African American population 15 years and over
Males 49.5% Never married44.4% Now married2.6% Separated0.0% Widowed3.4% DivorcedFemales 36.2% Never married40.1% Now married2.9% Separated1.6% Widowed19.3% DivorcedWomen who gave birth in the past 12 months Now married:
0.0% (0)Unmarried:
100.0% (9)
Women who did not give birth in the past 12 months Now married:
43.6% (330)Unmarried:
56.4% (426)
Marital status - American Indian / Alaska Native population 15 years and over
Males 11.6% Never married88.4% Now married0.0% Separated0.0% Widowed0.0% DivorcedFemales 0.0% Never married100.0% Now married0.0% Separated0.0% Widowed0.0% DivorcedWomen who did not give birth in the past 12 months Now married:
100.0% (15)Unmarried:
0.0% (0)
Marital status - Asian population 15 years and over
Males 11.9% Never married88.1% Now married0.0% Separated0.0% Widowed0.0% DivorcedFemales 15.2% Never married52.5% Now married20.7% Separated1.1% Widowed10.5% DivorcedWomen who gave birth in the past 12 months Now married:
100.0% (14)Unmarried:
0.0% (0)
Women who did not give birth in the past 12 months Now married:
41.7% (41)Unmarried:
58.3% (57)
Marital status - Native Hawaiian / Pacific Islander population 15 years and over
Males 0.0% Never married100.0% Now married0.0% Separated0.0% Widowed0.0% DivorcedFemales 0.0% Never married100.0% Now married0.0% Separated0.0% Widowed0.0% DivorcedWomen who did not give birth in the past 12 months Now married:
100.0% (26)Unmarried:
0.0% (0)
Marital status - Other race population 15 years and over
Males 41.5% Never married51.5% Now married0.0% Separated0.0% Widowed6.9% DivorcedFemales 28.7% Never married56.1% Now married0.0% Separated0.0% Widowed15.2% DivorcedWomen who gave birth in the past 12 months Now married:
0.0% (0)Unmarried:
100.0% (10)
Women who did not give birth in the past 12 months Now married:
44.7% (66)Unmarried:
55.3% (82)
Marital status - Two or more races population 15 years and over
Males 22.2% Never married54.6% Now married0.0% Separated0.2% Widowed23.0% DivorcedFemales 68.1% Never married23.7% Now married2.2% Separated0.8% Widowed5.3% DivorcedWomen who gave birth in the past 12 months Now married:
90.5% (63)Unmarried:
9.5% (7)
Women who did not give birth in the past 12 months Now married:
21.0% (145)Unmarried:
79.0% (546)
Marital status - White alone, not Hispanic / Latino population 15 years and over
Males 36.9% Never married42.0% Now married0.4% Separated2.5% Widowed18.2% DivorcedFemales 30.0% Never married40.8% Now married1.5% Separated12.0% Widowed15.8% DivorcedWomen who gave birth in the past 12 months Now married:
92.8% (77)Unmarried:
7.2% (6)
Women who did not give birth in the past 12 months Now married:
36.0% (652)Unmarried:
64.0% (1,158)
Marital status - Hispanic or Latino population 15 years and over
Males 42.5% Never married41.3% Now married2.4% Separated2.4% Widowed11.4% DivorcedFemales 48.6% Never married29.0% Now married3.9% Separated0.7% Widowed17.8% DivorcedWomen who gave birth in the past 12 months Now married:
52.8% (39)Unmarried:
47.2% (35)
Women who did not give birth in the past 12 months Now married:
28.3% (175)Unmarried:
71.7% (443)
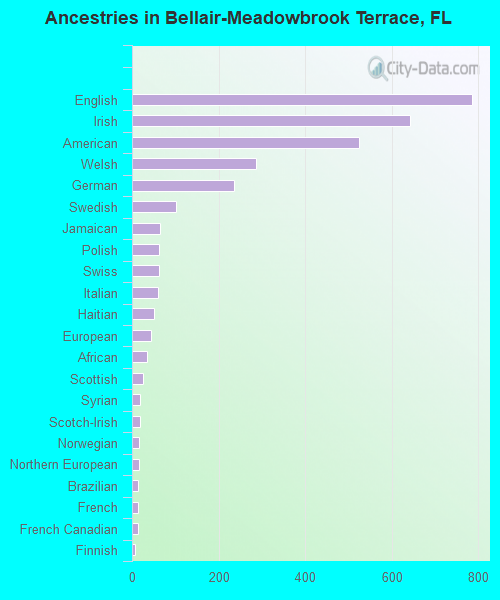
Ancestries in Bellair-Meadowbrook Terrace
785 12.1% English642 9.9% Irish524 8.1% American286 4.4% Welsh235 3.6% German101 1.6% Swedish64 1.0% Jamaican62 1.0% Polish62 1.0% Swiss60 0.9% Italian50 0.8% Haitian44 0.7% European35 0.5% African25 0.4% Scottish18 0.3% Syrian18 0.3% Scotch-Irish17 0.3% Norwegian16 0.2% Northern European15 0.2% Brazilian14 0.2% French13 0.2% French Canadian8 0.1% Finnish5 0.08% Palestinian5 0.08% Scandinavian4 0.06% Hungarian
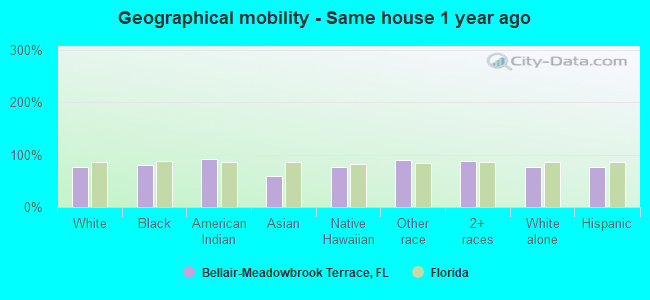
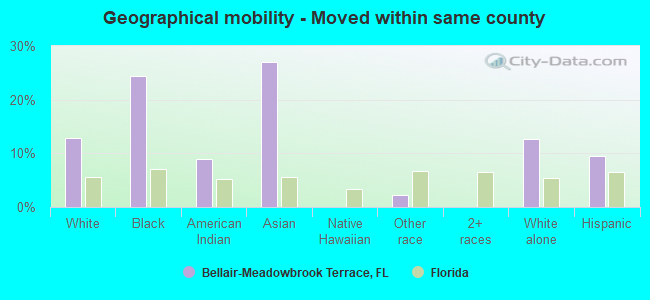
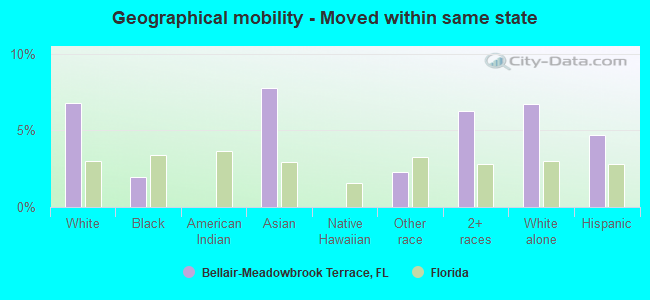
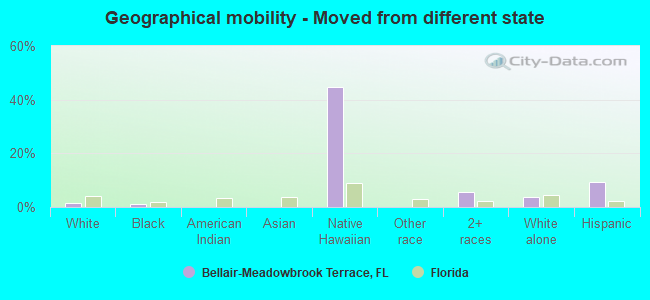
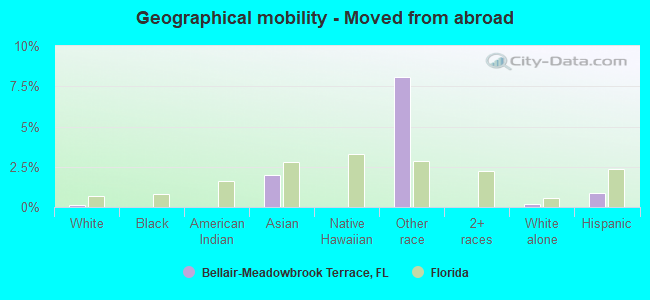
Geographical mobility in Bellair-Meadowbrook Terrace Same house 1 year ago 6,526 76.0% White (Caucasian)1,679 79.9% Black or African American73 91.4% American Indian / Alaska Native464 58.5% Asian34 75.9% Native Hawaiian / Pacific Islander454 89.1% Other race2,148 88.1% Two or more races5,873 76.0% White alone, not Hispanic / Latino2,074 76.8% Hispanic or LatinoMoved within same county 1,112 13.0% White / Caucasian511 24.3% Black or African American7 8.9% American Indian / Alaska Native214 27.0% Asian11 2.3% Other race980 12.7% White alone, not Hispanic / Latino254 9.4% Hispanic or LatinoMoved within same state 582 6.8% White / Caucasian41 1.9% Black or African American62 7.8% Asian12 2.3% Other race153 6.3% Two or more races518 6.7% White alone, not Hispanic / Latino126 4.7% Hispanic or LatinoMoved from different state 136 1.6% White / Caucasian24 1.2% Black or African American20 44.7% Native Hawaiian / Pacific Islander138 5.6% Two or more races282 3.7% White alone, not Hispanic / Latino250 9.2% Hispanic or LatinoMoved from abroad 12 0.1% White16 2.0% Asian41 8.1% Other race16 0.2% White alone, not Hispanic / Latino24 0.9% Hispanic or Latino
Children Nativity (place of birth) in Bellair-Meadowbrook Terrace
Children under 6 years - Living with two parents Both parents native 501 100.0% NativeBoth parents foreign-born 21 100.0% NativeChildren under 6 years - Living with one parent Native parent 430 100.0% NativeForeign-born parent 27 100.0% NativeChildren 6 to 17 years - Living with two parents Both parents native 561 100.0% Native0 0.0% Foreign-bornBoth parents foreign-born 62 78.8% Native17 21.2% Foreign-bornOne native, one foreign-born parent 34 69.0% Native15 31.0% Foreign-bornChildren 6 to 17 years - Living with one parent Native parent 427 99.9% Native0 0.1% Foreign-bornForeign-born parent 36 66.5% Native18 33.5% Foreign-born
Grandparents responsible for own grandchildren in Bellair-Meadowbrook Terrace
Grandparents (30 to 59 years) White / Caucasian 19 42.3% Responsible for grandchildren26 57.7% Not responsible for grandchildrenBlack or African American 20 100.0% Not responsible for grandchildrenAsian 23 37.5% Responsible for grandchildren38 62.5% Not responsible for grandchildrenWhite alone, not Hispanic / Latino 6 14.7% Responsible for grandchildren33 85.3% Not responsible for grandchildrenHispanic or Latino 25 100.0% Responsible for grandchildren
Grandparents (60 years and over) White / Caucasian 87 100.0% Not responsible for grandchildrenWhite alone, not Hispanic / Latino 90 100.0% Not responsible for grandchildren