Races in Belmont, New Hampshire (NH) Detailed Stats
Ancestries, Foreign-born residents, place of birth
Data:
Latest news about races in Belmont, NH collected exclusively by city-data.com from local newspapers, TV, and radio stations
1.0% of Belmont, NH residents are foreign-born , which is 416.6% less than the foreign-born rate of 5.0% across the entire state of New Hampshire.
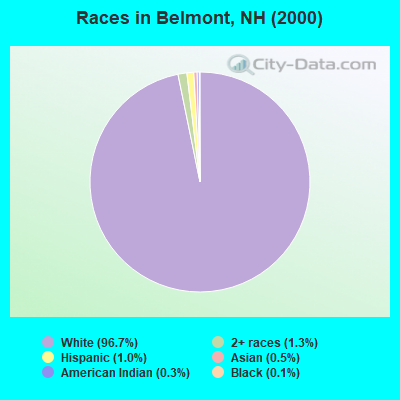
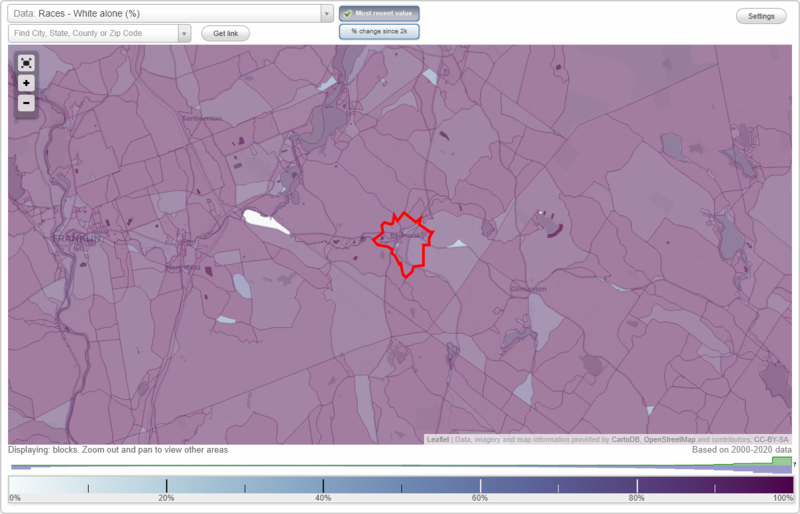
Race distribution in Belmont

- 6,49796.7%White alone
- 841.3%Two or more races
- 641.0%Hispanic
- 350.5%Asian alone
- 220.3%American Indian alone
- 90.1%Black alone
- 50.07%Other race alone
2000
2022
-
- 1,175,25295.1%White alone
- 20,4891.7%Hispanic
- 15,8031.3%Asian alone
- 11,6060.9%Two or more races
- 8,3540.7%Black alone
- 2,6980.2%American Indian alone
- 1,2540.1%Other race alone
- 3300.03%Native Hawaiian and Other
Pacific Islander alone
-
- 1,208,10186.6%White alone
- 63,4794.5%Hispanic
- 60,7244.4%Two or more races
- 36,5192.6%Asian alone
- 17,9311.3%Black alone
- 6,6150.5%Other race alone
- 1,0140.07%American Indian alone
- 8480.06%Native Hawaiian and Other
Pacific Islander alone
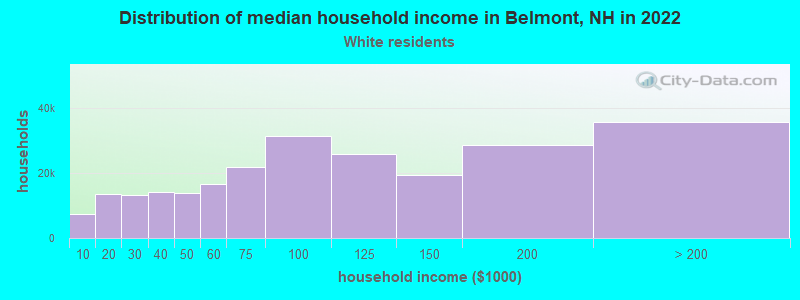
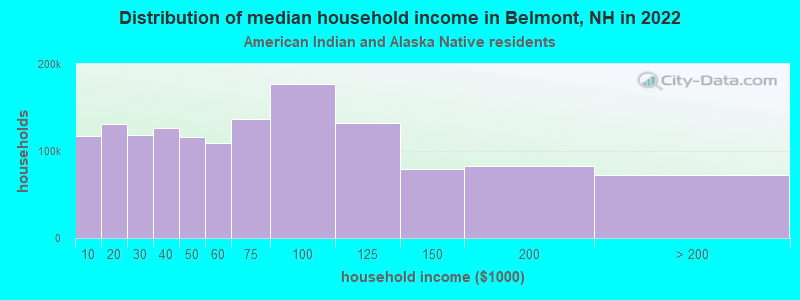
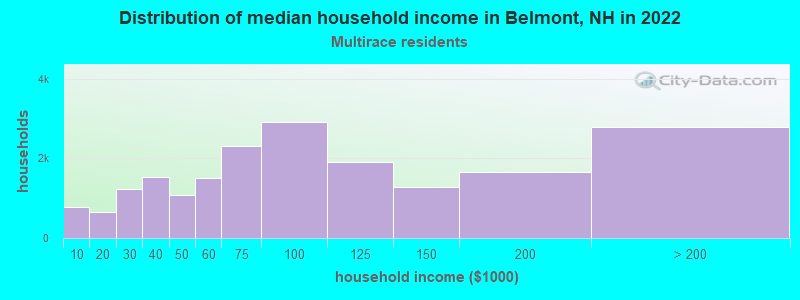
Income and house value in Belmont
- Median household income in 2022
- $91,463White non-Hispanic householders
- $104,930American Indian and Alaska Native householders
- $113,662Two or more races householders
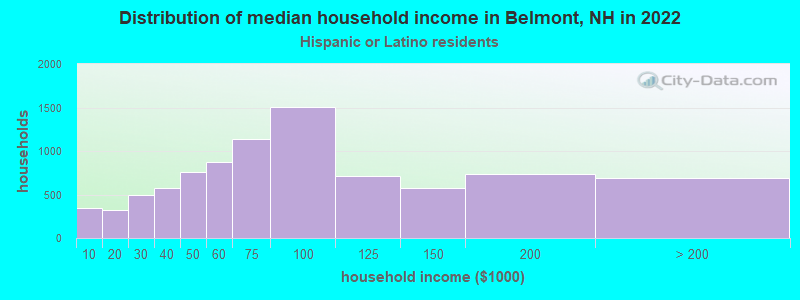
- $31,623Hispanic or Latino race householders
- Median 2022 house value
- $312,704White Non-Hispanic householders
- $446,026American Indian or Alaska Native householders
- $254,640Two or more races householders
- $178,410Hispanic or Latino householders
Foreign-born residents in Belmont
65 residents are foreign born
| This city: | 1.0% |
| New Hampshire: | 4.4% |
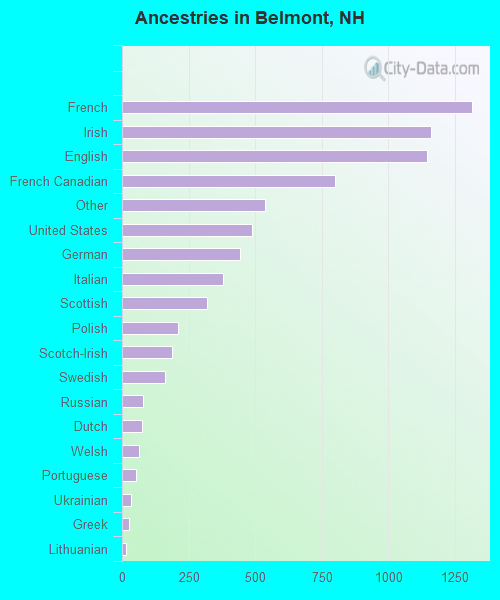
Ancestries in Belmont

- 1,31317.5%French
- 1,16115.4%Irish
- 1,14515.2%English
- 79910.6%French Canadian
- 5397.2%Other
- 4876.5%United States
- 4435.9%German
- 3805.1%Italian
- 3184.2%Scottish
- 2122.8%Polish
- 1862.5%Scotch-Irish
- 1602.1%Swedish
- 791.1%Russian
- 761.0%Dutch
- 620.8%Welsh
- 520.7%Portuguese
- 350.5%Ukrainian
- 270.4%Greek
- 160.2%Lithuanian
- 100.1%Danish
- 90.1%Hungarian
- 80.1%Swiss
- 50.07%Arab