Races in Camp Ground, South Carolina (SC) Detailed Stats
Ancestries, Foreign-born residents, place of birth
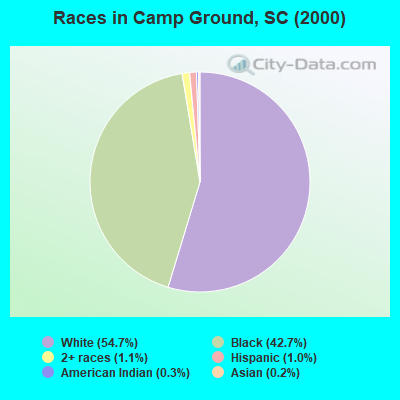
Race distribution in Camp Ground

- 2,90354.7%White alone
- 2,26542.7%Black alone
- 581.1%Two or more races
- 531.0%Hispanic
- 160.3%American Indian alone
- 100.2%Asian alone
- 20.04%Other race alone
- 10.02%Native Hawaiian and Other
Pacific Islander alone
2000
2022
-
- 2,652,29166.1%White alone
- 1,178,48629.4%Black alone
- 95,0762.4%Hispanic
- 35,5680.9%Asian alone
- 33,2900.8%Two or more races
- 12,7650.3%American Indian alone
- 3,2660.08%Other race alone
- 1,2700.03%Native Hawaiian and Other
Pacific Islander alone

-
- 3,301,73962.5%White alone
- 1,313,29024.9%Black alone
- 343,7836.5%Hispanic
- 190,5083.6%Two or more races
- 89,8881.7%Asian alone
- 29,3900.6%Other race alone
- 12,1120.2%American Indian alone
- 1,9240.04%Native Hawaiian and Other
Pacific Islander alone

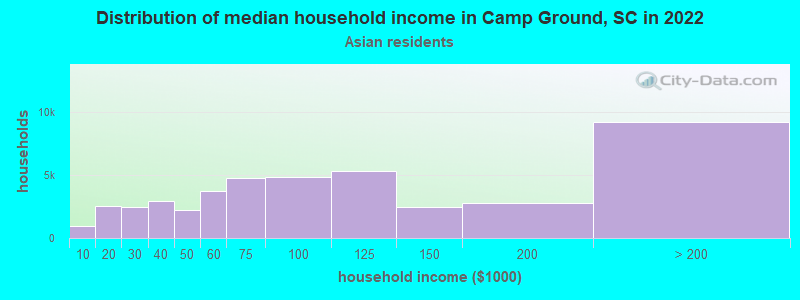
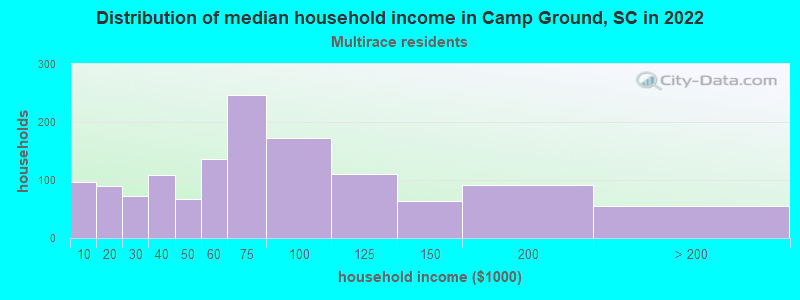
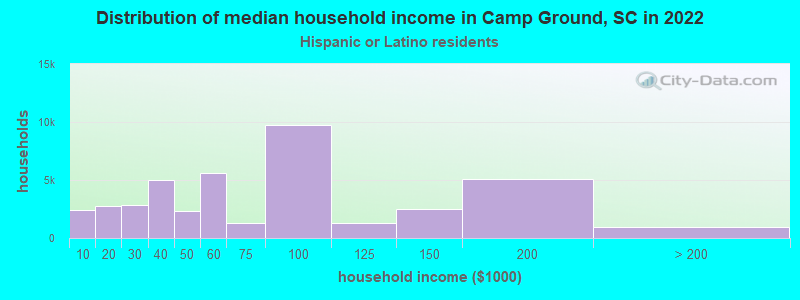
Income and house value in Camp Ground
- Median household income in 2022
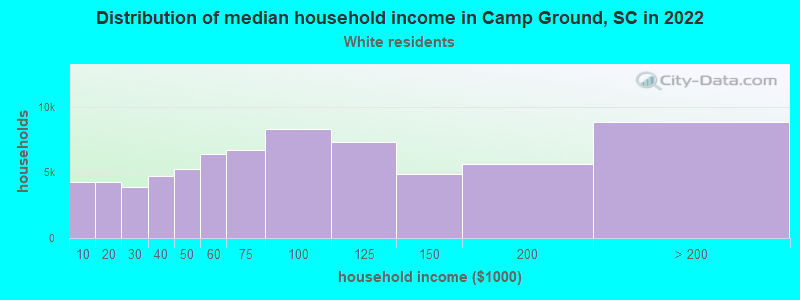
- $71,912White non-Hispanic householders
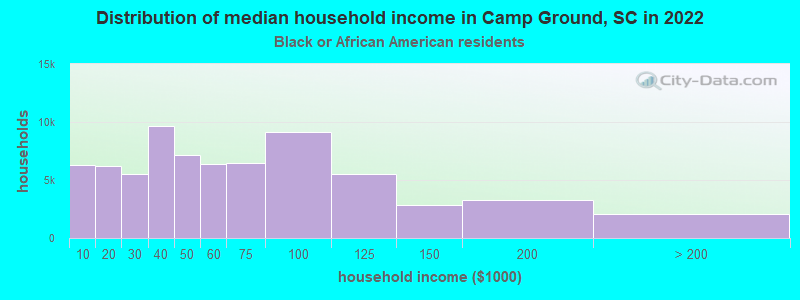
- $44,293Black householders
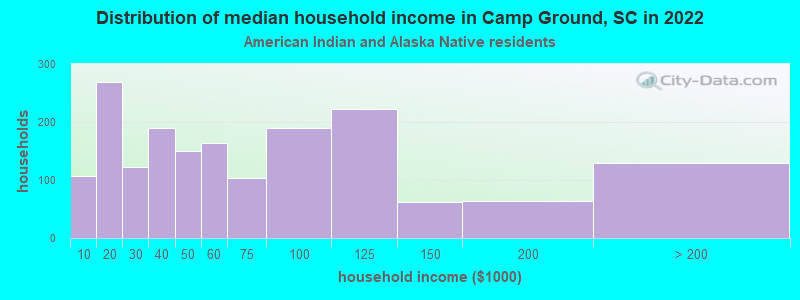
- $8,581American Indian and Alaska Native householders
- $149,047Asian householders
- $22,489Some other race householders
- $11,122Two or more races householders
- over $200,000Hispanic or Latino race householders
- Median 2022 house value
- $280,736White Non-Hispanic householders
- $160,624Black or African American householders
- $131,073American Indian or Alaska Native householders
- $226,400Two or more races householders
- $387,263Hispanic or Latino householders
Household income for White non-Hispanic householders
Household income for Black householders
Household income for American Indian and Alaska Native householders
Household income for Asian householders
Household income for Two or more races householders
Household income for Hispanic or Latino race householders
Zip code: 29016