Races in Carpinteria Valley, California (CA) Detailed Stats
Ancestries, Foreign-born residents, place of birth
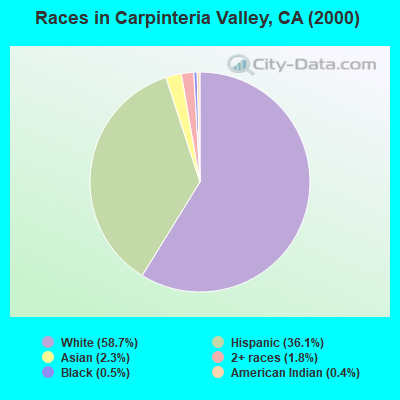
Race distribution in Carpinteria Valley

- 11,22258.7%White alone
- 6,89636.1%Hispanic
- 4442.3%Asian alone
- 3501.8%Two or more races
- 970.5%Black alone
- 740.4%American Indian alone
- 180.09%Native Hawaiian and Other
Pacific Islander alone - 70.04%Other race alone
2000
2022
-
- 15,816,79046.7%White alone
- 10,966,55632.4%Hispanic
- 3,648,86010.8%Asian alone
- 2,181,9266.4%Black alone
- 903,1152.7%Two or more races
- 178,9840.5%American Indian alone
- 103,7360.3%Native Hawaiian and Other
Pacific Islander alone - 71,6810.2%Other race alone

-
- 15,732,18440.3%Hispanic
- 13,160,42633.7%White alone
- 5,957,86715.3%Asian alone
- 2,025,2185.2%Black alone
- 1,663,2224.3%Two or more races
- 251,6180.6%Other race alone
- 135,7770.3%Native Hawaiian and Other
Pacific Islander alone - 103,0300.3%American Indian alone

Income and house value in Carpinteria Valley
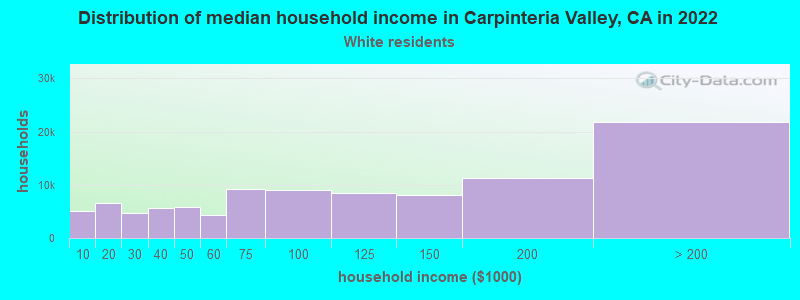
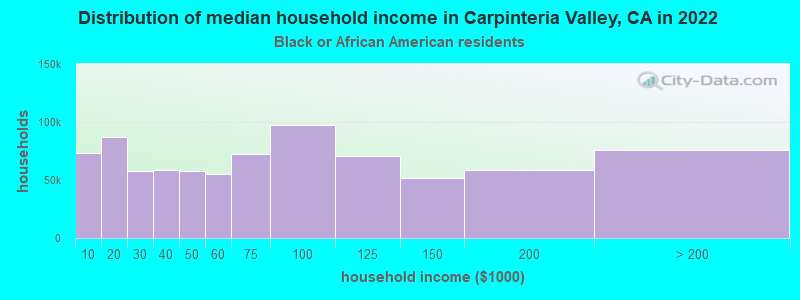
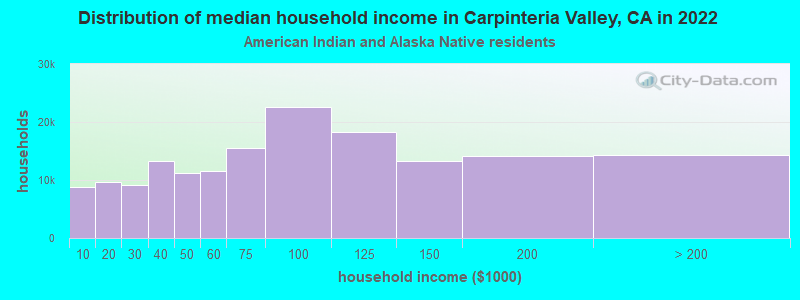
- Median household income in 2022
- $109,964White non-Hispanic householders
- $126,751Black householders
- $156,632American Indian and Alaska Native householders
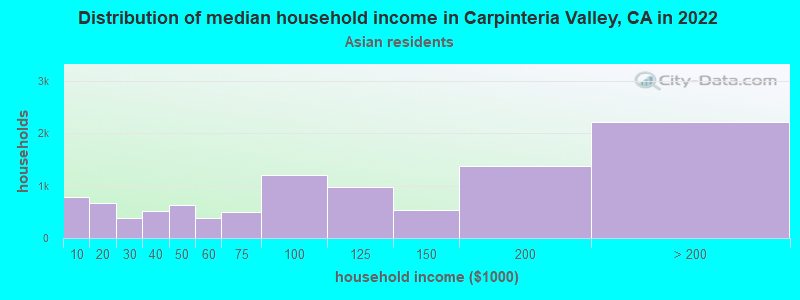
- $140,883Asian householders
- $93,193Some other race householders
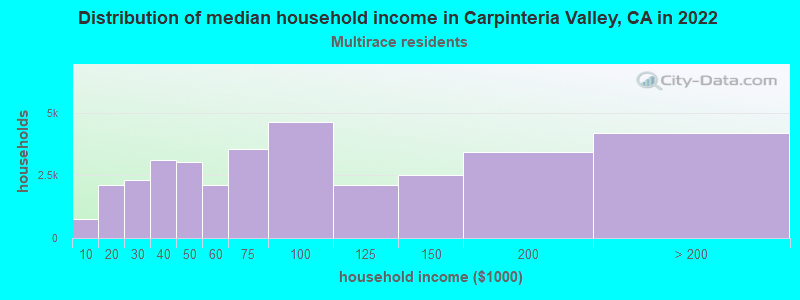
- $95,643Two or more races householders
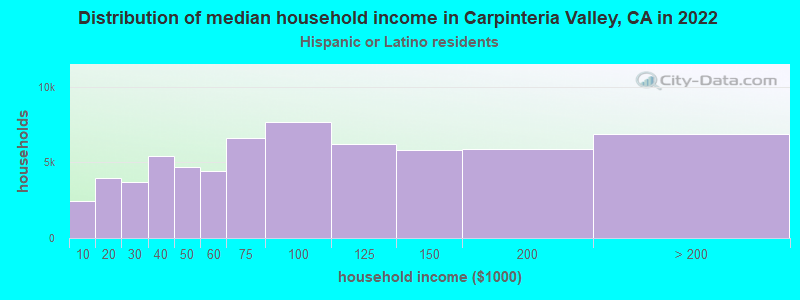
- $90,187Hispanic or Latino race householders
- Median 2022 house value
- over $1,000,000White Non-Hispanic householders
- $494,903American Indian or Alaska Native householders
- over $1,000,000Asian householders
- over $1,000,000Some other race householders
- over $1,000,000Two or more races householders
- over $1,000,000Hispanic or Latino householders
Household income for White non-Hispanic householders
Household income for Black householders
Household income for American Indian and Alaska Native householders
Household income for Asian householders
Household income for Two or more races householders
Household income for Hispanic or Latino race householders
Zip code: 93013