Races in Casper, Wyoming (WY) Detailed Stats
Data:
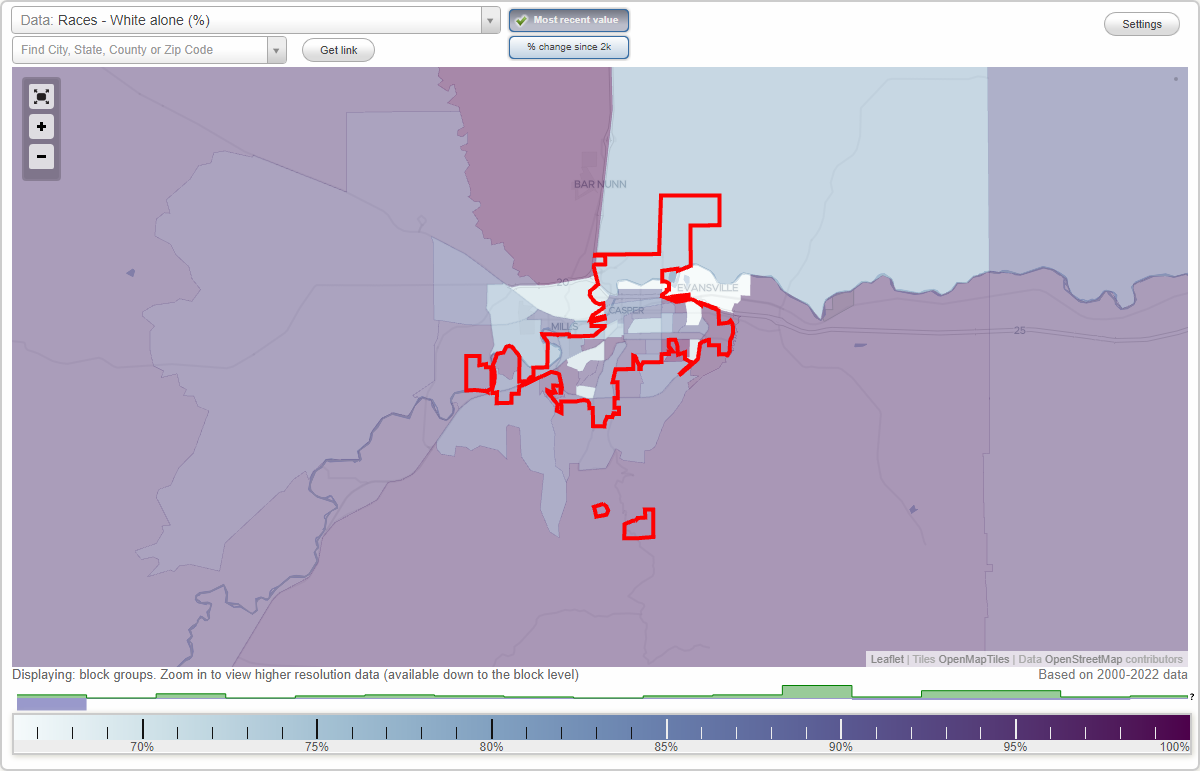
Races - White alone (%)
Races - White alone (% change since 2000)
Races - Black alone (%)
Races - Black alone (% change since 2000)
Races - American Indian alone (%)
Races - American Indian alone (% change since 2000)
Races - Asian alone (%)
Races - Asian alone (% change since 2000)
Races - Hispanic (%)
Races - Hispanic (% change since 2000)
Races - Native Hawaiian and Other Pacific Islander alone (%)
Races - Native Hawaiian and Other Pacific Islander alone (% change since 2000)
Races - Two or more races(%)
Races - Two or more races(% change since 2000)
Races - Other race alone (%)
Races - Other race alone (% change since 2000)
Racial diversity
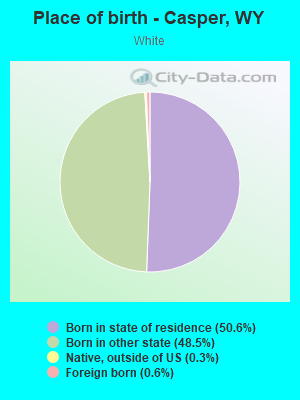
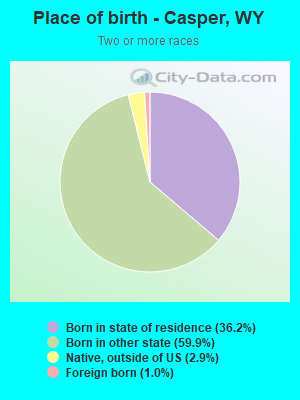
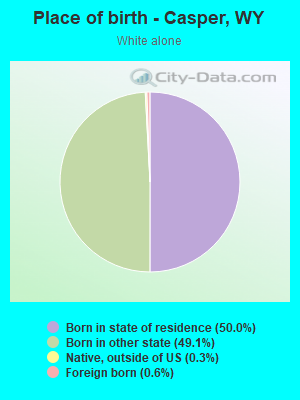
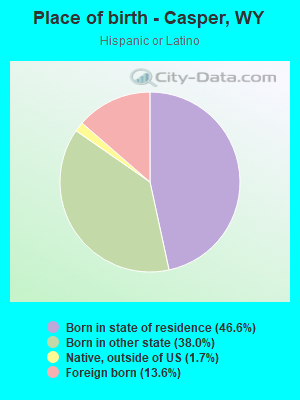
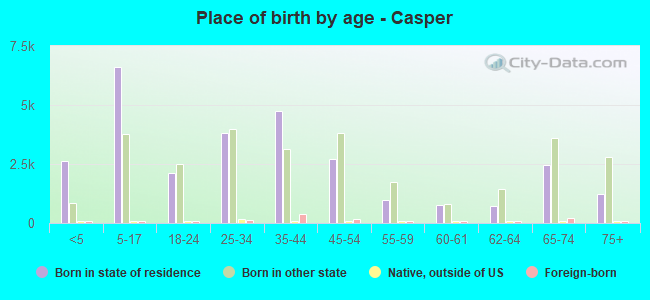
Place of birth - Born in state of residence (%)
Place of birth - Born in state of residence (%) - White
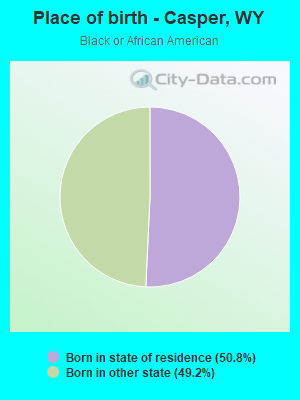
Place of birth - Born in state of residence (%) - Black or African American
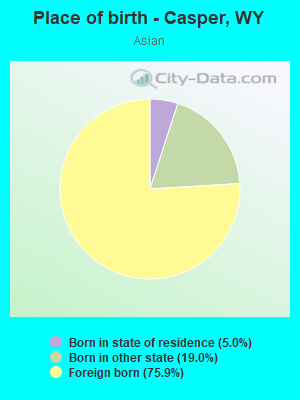
Place of birth - Born in state of residence (%) - Asian
Place of birth - Born in state of residence (%) - Hispanic or Latino
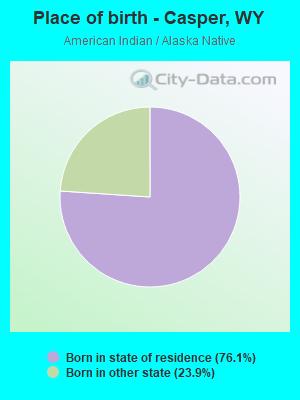
Place of birth - Born in state of residence (%) - American Indian and Alaska Native
Place of birth - Born in state of residence (%) - Multirace
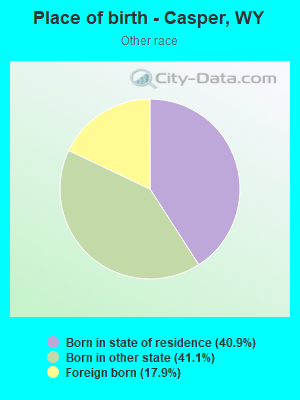
Place of birth - Born in state of residence (%) - Other Race
Place of birth - Born in other state (%)
Place of birth - Born in other state (%) - White
Place of birth - Born in other state (%) - Black or African American
Place of birth - Born in other state (%) - Asian
Place of birth - Born in other state (%) - Hispanic or Latino
Place of birth - Born in other state (%) - American Indian and Alaska Native
Place of birth - Born in other state (%) - Multirace
Place of birth - Born in other state (%) - Other Race
Place of birth - Native, outside of US (%)
Place of birth - Native, outside of US (%) - White
Place of birth - Native, outside of US (%) - Black or African American
Place of birth - Native, outside of US (%) - Asian
Place of birth - Native, outside of US (%) - Hispanic or Latino
Place of birth - Native, outside of US (%) - American Indian and Alaska Native
Place of birth - Native, outside of US (%) - Multirace
Place of birth - Native, outside of US (%) - Other Race
Place of birth - Foreign born (%)
Place of birth - Foreign born (%) - White
Place of birth - Foreign born (%) - Black or African American
Place of birth - Foreign born (%) - Asian
Place of birth - Foreign born (%) - Hispanic or Latino
Place of birth - Foreign born (%) - American Indian and Alaska Native
Place of birth - Foreign born (%) - Multirace
Place of birth - Foreign born (%) - Other Race
Residents speaking English at home (%)
Residents speaking English at home - Born in the United States (%)
Residents speaking English at home - Native, born elsewhere (%)
Residents speaking English at home - Foreign born (%)
Residents speaking Spanish at home (%)
Residents speaking Spanish at home - Born in the United States (%)
Residents speaking Spanish at home - Native, born elsewhere (%)
Residents speaking Spanish at home - Foreign born (%)
Residents speaking other language at home (%)
Residents speaking other language at home - Born in the United States (%)
Residents speaking other language at home - Native, born elsewhere (%)
Residents speaking other language at home - Foreign born (%)
Marital status - Never married (%)
Marital status - Now married (%)
Marital status - Separated (%)
Marital status - Widowed (%)
Marital status - Divorced (%)
Ancestries Reported - Arab (%)
Ancestries Reported - Czech (%)
Ancestries Reported - Danish (%)
Ancestries Reported - Dutch (%)
Ancestries Reported - English (%)
Ancestries Reported - French (%)
Ancestries Reported - French Canadian (%)
Ancestries Reported - German (%)
Ancestries Reported - Greek (%)
Ancestries Reported - Hungarian (%)
Ancestries Reported - Irish (%)
Ancestries Reported - Italian (%)
Ancestries Reported - Lithuanian (%)
Ancestries Reported - Norwegian (%)
Ancestries Reported - Polish (%)
Ancestries Reported - Portuguese (%)
Ancestries Reported - Russian (%)
Ancestries Reported - Scotch-Irish (%)
Ancestries Reported - Scottish (%)
Ancestries Reported - Slovak (%)
Ancestries Reported - Subsaharan African (%)
Ancestries Reported - Swedish (%)
Ancestries Reported - Swiss (%)
Ancestries Reported - Ukrainian (%)
Ancestries Reported - United States (%)
Ancestries Reported - Welsh (%)
Ancestries Reported - West Indian (%)
Ancestries Reported - Other (%)
Geographical mobility - Same house 1 year ago (%)
Geographical mobility - Same house 1 year ago (%) - White
Geographical mobility - Same house 1 year ago (%) - Black or African American
Geographical mobility - Same house 1 year ago (%) - Asian
Geographical mobility - Same house 1 year ago (%) - Hispanic or Latino
Geographical mobility - Same house 1 year ago (%) - American Indian and Alaska Native
Geographical mobility - Same house 1 year ago (%) - Multirace
Geographical mobility - Same house 1 year ago (%) - Other Race
Geographical mobility - Moved within same county (%)
Geographical mobility - Moved within same county (%) - White
Geographical mobility - Moved within same county (%) - Black or African American
Geographical mobility - Moved within same county (%) - Asian
Geographical mobility - Moved within same county (%) - Hispanic or Latino
Geographical mobility - Moved within same county (%) - American Indian and Alaska Native
Geographical mobility - Moved within same county (%) - Multirace
Geographical mobility - Moved within same county (%) - Other Race
Geographical mobility - Moved from different county within same state (%)
Geographical mobility - Moved from different county within same state (%) - White
Geographical mobility - Moved from different county within same state (%) - Black or African American
Geographical mobility - Moved from different county within same state (%) - Asian
Geographical mobility - Moved from different county within same state (%) - Hispanic or Latino
Geographical mobility - Moved from different county within same state (%) - American Indian and Alaska Native
Geographical mobility - Moved from different county within same state (%) - Multirace
Geographical mobility - Moved from different county within same state (%) - Other Race
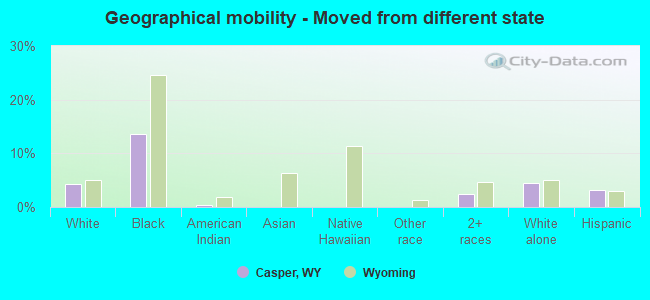
Geographical mobility - Moved from different state (%)
Geographical mobility - Moved from different state (%) - White
Geographical mobility - Moved from different state (%) - Black or African American
Geographical mobility - Moved from different state (%) - Asian
Geographical mobility - Moved from different state (%) - Hispanic or Latino
Geographical mobility - Moved from different state (%) - American Indian and Alaska Native
Geographical mobility - Moved from different state (%) - Multirace
Geographical mobility - Moved from different state (%) - Other Race
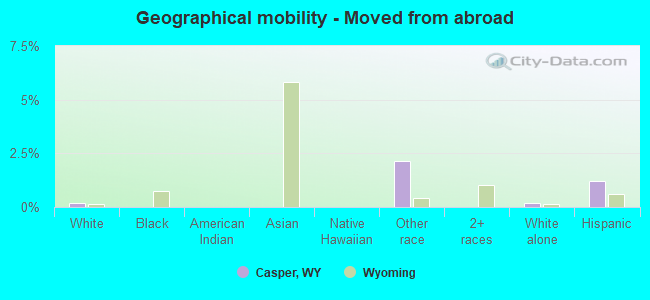
Geographical mobility - Moved from abroad (%)
Geographical mobility - Moved from abroad (%) - White
Geographical mobility - Moved from abroad (%) - Black or African American
Geographical mobility - Moved from abroad (%) - Asian
Geographical mobility - Moved from abroad (%) - Hispanic or Latino
Geographical mobility - Moved from abroad (%) - American Indian and Alaska Native
Geographical mobility - Moved from abroad (%) - Multirace
Geographical mobility - Moved from abroad (%) - Other Race
Place of birth for the foreign-born population - Ireland (%)
Place of birth for the foreign-born population - Denmark (%)
Place of birth for the foreign-born population - Norway (%)
Place of birth for the foreign-born population - Sweden (%)
Place of birth for the foreign-born population - United Kingdom (%)
Place of birth for the foreign-born population - England (%)
Place of birth for the foreign-born population - Scotland (%)
Place of birth for the foreign-born population - Other Northern Europe (%)
Place of birth for the foreign-born population - Austria (%)
Place of birth for the foreign-born population - Belgium (%)
Place of birth for the foreign-born population - France (%)
Place of birth for the foreign-born population - Germany (%)
Place of birth for the foreign-born population - Netherlands (%)
Place of birth for the foreign-born population - Switzerland (%)
Place of birth for the foreign-born population - Other Western Europe (%)
Place of birth for the foreign-born population - Greece (%)
Place of birth for the foreign-born population - Italy (%)
Place of birth for the foreign-born population - Portugal (%)
Place of birth for the foreign-born population - Spain (%)
Place of birth for the foreign-born population - Other Southern Europe (%)
Place of birth for the foreign-born population - Albania (%)
Place of birth for the foreign-born population - Belarus (%)
Place of birth for the foreign-born population - Bosnia and Herzegovina (%)
Place of birth for the foreign-born population - Bulgaria (%)
Place of birth for the foreign-born population - Croatia (%)
Place of birth for the foreign-born population - Czechoslovakia (%)
Place of birth for the foreign-born population - Hungary (%)
Place of birth for the foreign-born population - Latvia (%)
Place of birth for the foreign-born population - Lithuania (%)
Place of birth for the foreign-born population - North Macedonia (Macedonia) (%)
Place of birth for the foreign-born population - Moldova (%)
Place of birth for the foreign-born population - Poland (%)
Place of birth for the foreign-born population - Romania (%)
Place of birth for the foreign-born population - Russia (%)
Place of birth for the foreign-born population - Serbia (%)
Place of birth for the foreign-born population - Ukraine (%)
Place of birth for the foreign-born population - Other Eastern Europe (%)
Place of birth for the foreign-born population - China (%)
Place of birth for the foreign-born population - Hong Kong (%)
Place of birth for the foreign-born population - Taiwan (%)
Place of birth for the foreign-born population - Japan (%)
Place of birth for the foreign-born population - Korea (%)
Place of birth for the foreign-born population - Other Eastern Asia (%)
Place of birth for the foreign-born population - Afghanistan (%)
Place of birth for the foreign-born population - Bangladesh (%)
Place of birth for the foreign-born population - India (%)
Place of birth for the foreign-born population - Iran (%)
Place of birth for the foreign-born population - Kazakhstan (%)
Place of birth for the foreign-born population - Nepal (%)
Place of birth for the foreign-born population - Pakistan (%)
Place of birth for the foreign-born population - Sri Lanka (%)
Place of birth for the foreign-born population - Uzbekistan (%)
Place of birth for the foreign-born population - Other South Central Asia (%)
Place of birth for the foreign-born population - Burma (%)
Place of birth for the foreign-born population - Cambodia (%)
Place of birth for the foreign-born population - Indonesia (%)
Place of birth for the foreign-born population - Laos (%)
Place of birth for the foreign-born population - Malaysia (%)
Place of birth for the foreign-born population - Philippines (%)
Place of birth for the foreign-born population - Singapore (%)
Place of birth for the foreign-born population - Thailand (%)
Place of birth for the foreign-born population - Vietnam (%)
Place of birth for the foreign-born population - Other South Eastern Asia (%)
Place of birth for the foreign-born population - Armenia (%)
Place of birth for the foreign-born population - Iraq (%)
Place of birth for the foreign-born population - Israel (%)
Place of birth for the foreign-born population - Jordan (%)
Place of birth for the foreign-born population - Kuwait (%)
Place of birth for the foreign-born population - Lebanon (%)
Place of birth for the foreign-born population - Saudi Arabia (%)
Place of birth for the foreign-born population - Syria (%)
Place of birth for the foreign-born population - Turkey (%)
Place of birth for the foreign-born population - Yemen (%)
Place of birth for the foreign-born population - Other Western Asia (%)
Place of birth for the foreign-born population - Eritrea (%)
Place of birth for the foreign-born population - Ethiopia (%)
Place of birth for the foreign-born population - Kenya (%)
Place of birth for the foreign-born population - Somalia (%)
Place of birth for the foreign-born population - Uganda (%)
Place of birth for the foreign-born population - Zimbabwe (%)
Place of birth for the foreign-born population - Other Eastern Africa (%)
Place of birth for the foreign-born population - Cameroon (%)
Place of birth for the foreign-born population - Congo (%)
Place of birth for the foreign-born population - Democratic Republic of Congo (Zaire) (%)
Place of birth for the foreign-born population - Other Middle Africa (%)
Place of birth for the foreign-born population - Egypt (%)
Place of birth for the foreign-born population - Morocco (%)
Place of birth for the foreign-born population - Sudan (%)
Place of birth for the foreign-born population - Other Northern Africa (%)
Place of birth for the foreign-born population - South Africa (%)
Place of birth for the foreign-born population - Other Southern Africa (%)
Place of birth for the foreign-born population - Cabo Verde (%)
Place of birth for the foreign-born population - Ghana (%)
Place of birth for the foreign-born population - Liberia (%)
Place of birth for the foreign-born population - Nigeria (%)
Place of birth for the foreign-born population - Senegal (%)
Place of birth for the foreign-born population - Sierra Leone (%)
Place of birth for the foreign-born population - Other Western Africa (%)
Place of birth for the foreign-born population - Australia (%)
Place of birth for the foreign-born population - New Zealand (%)
Place of birth for the foreign-born population - Fiji (%)
Place of birth for the foreign-born population - Micronesia (%)
Place of birth for the foreign-born population - Bahamas (%)
Place of birth for the foreign-born population - Barbados (%)
Place of birth for the foreign-born population - Cuba (%)
Place of birth for the foreign-born population - Dominica (%)
Place of birth for the foreign-born population - Dominican Republic (%)
Place of birth for the foreign-born population - Grenada (%)
Place of birth for the foreign-born population - Haiti (%)
Place of birth for the foreign-born population - Jamaica (%)
Place of birth for the foreign-born population - St. Vincent and the Grenadines (%)
Place of birth for the foreign-born population - Trinidad and Tobago (%)
Place of birth for the foreign-born population - West Indies (%)
Place of birth for the foreign-born population - Other Caribbean (%)
Place of birth for the foreign-born population - Belize (%)
Place of birth for the foreign-born population - Costa Rica (%)
Place of birth for the foreign-born population - El Salvador (%)
Place of birth for the foreign-born population - Guatemala (%)
Place of birth for the foreign-born population - Honduras (%)
Place of birth for the foreign-born population - Mexico (%)
Place of birth for the foreign-born population - Nicaragua (%)
Place of birth for the foreign-born population - Panama (%)
Place of birth for the foreign-born population - Other Central America (%)
Place of birth for the foreign-born population - Argentina (%)
Place of birth for the foreign-born population - Bolivia (%)
Place of birth for the foreign-born population - Brazil (%)
Place of birth for the foreign-born population - Chile (%)
Place of birth for the foreign-born population - Colombia (%)
Place of birth for the foreign-born population - Ecuador (%)
Place of birth for the foreign-born population - Guyana (%)
Place of birth for the foreign-born population - Peru (%)
Place of birth for the foreign-born population - Uruguay (%)
Place of birth for the foreign-born population - Venezuela (%)
Place of birth for the foreign-born population - Other South America (%)
Place of birth for the foreign-born population - Canada (%)
Place of birth for the foreign-born population - Other Northern America (%)
Place of birth for the foreign-born population - Other (%)
Latest news about races in Casper, WY collected exclusively by city-data.com from local newspapers, TV, and radio stations
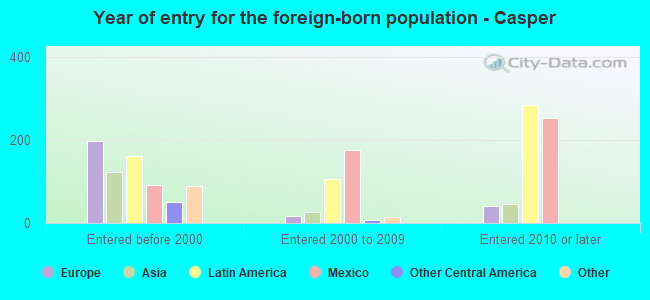
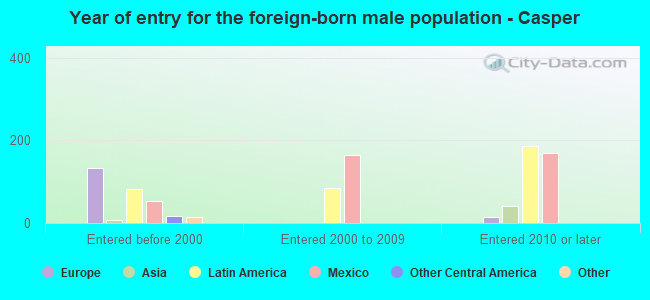
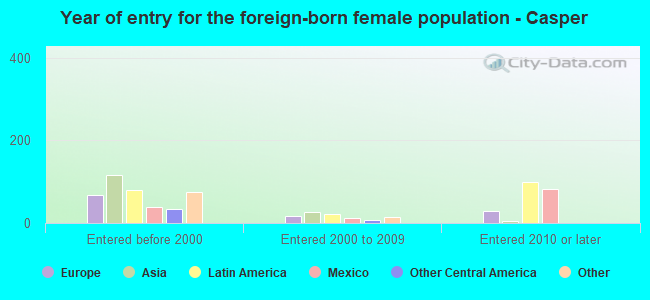
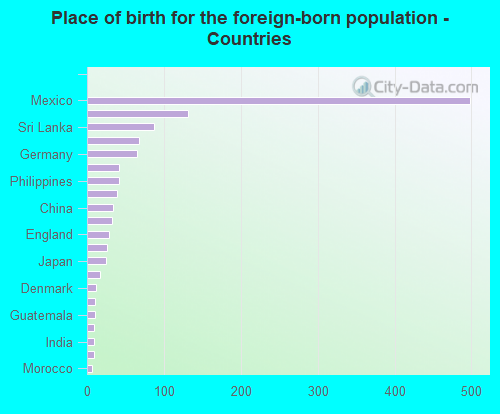
According to 2022 data, the most numerous races in Casper, WY are White alone (49,535 residents), Hispanic (5,495 residents), and Two or more races (2,545 residents). 95.7% of Casper residents speak English at home. 2.1% of Casper, WY residents are foreign-born (0.9% born in Latin America, 0.5% born in Europe, 0.4% born in Asia, 0.2% born in North America), which is 44.9% less than the foreign-born rate of 3.0% across the entire state of Wyoming.
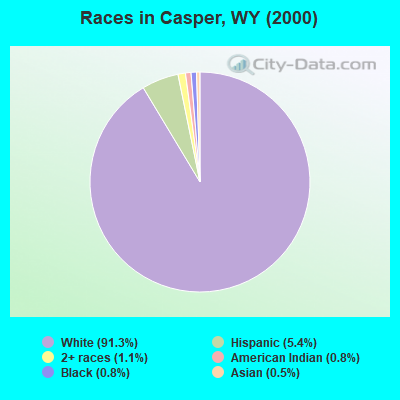
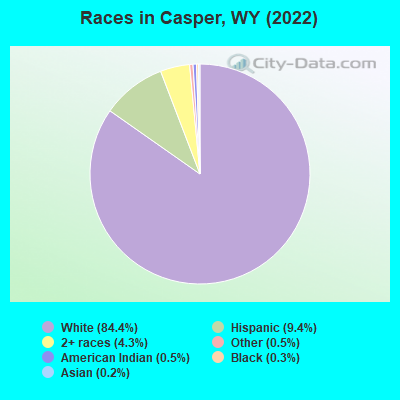
Race distribution in Casper
2000 2022
438,799 88.9% White alone 31,669 6.4% Hispanic 10,238 2.1% American Indian alone 6,164 1.2% Two or more races 3,504 0.7% Black alone 2,670 0.5% Asian alone 474 0.10% Other race alone 264 0.05% Native Hawaiian and Other
473,220 81.4% White alone 62,803 10.8% Hispanic 22,911 3.9% Two or more races 9,589 1.6% American Indian alone 4,997 0.9% Other race alone 3,990 0.7% Black alone 3,577 0.6% Asian alone 294 0.05% Native Hawaiian and Other
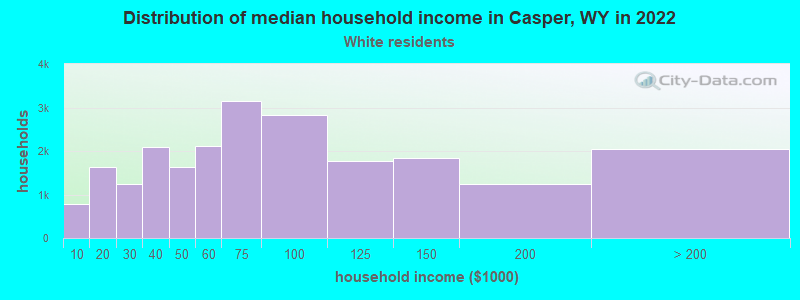
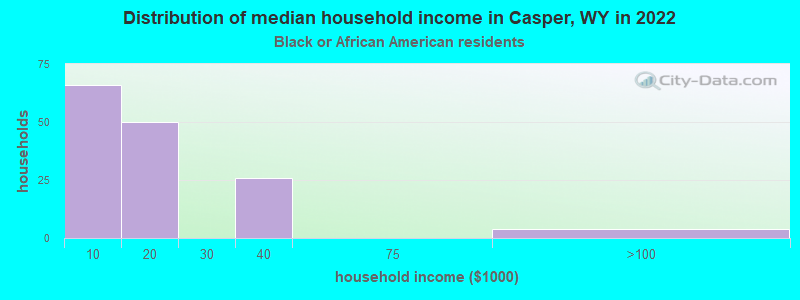
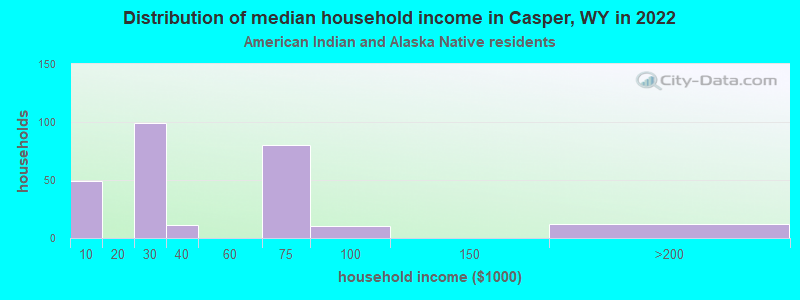
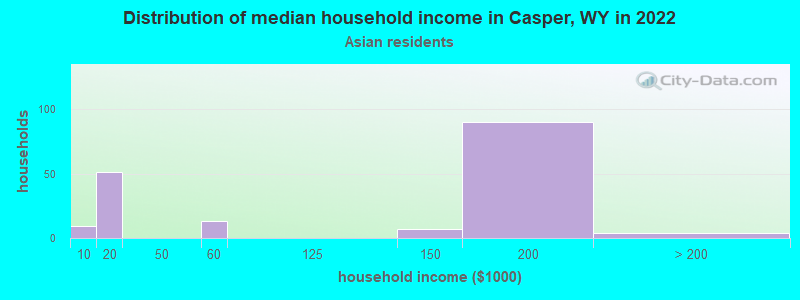
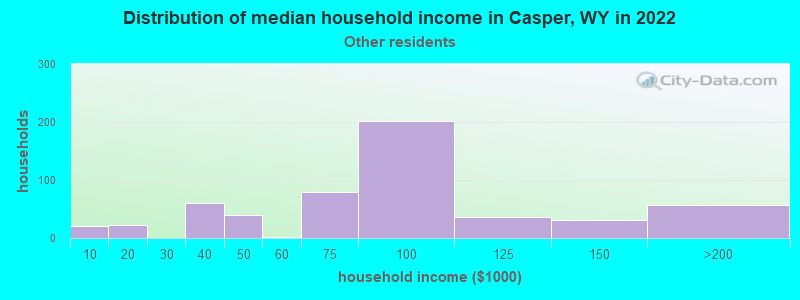
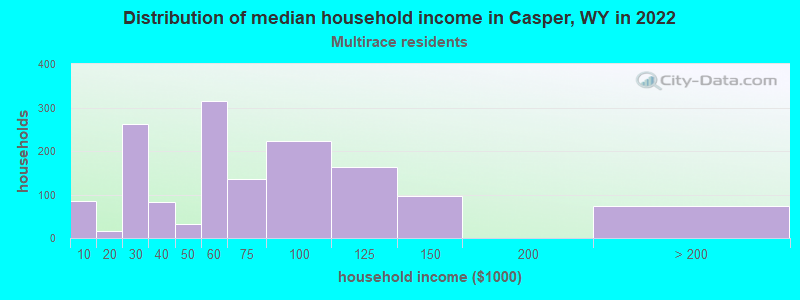
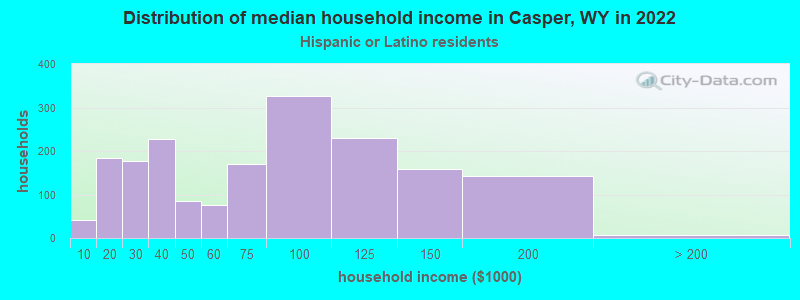
Income and house value in Casper Median household income in 2022 $66,177 White non-Hispanic householders$75,847 Some other race householders$82,560 Two or more races householders$67,897 Hispanic or Latino race householdersMedian 2022 house value $260,593 White Non-Hispanic householders$248,957 Black or African American householders$119,732 American Indian or Alaska Native householders $237,320 Asian householders$290,909 Native Hawaiian and other Pacific Islander householders$194,450 Some other race householders$247,732 Two or more races householders$223,847 Hispanic or Latino householders
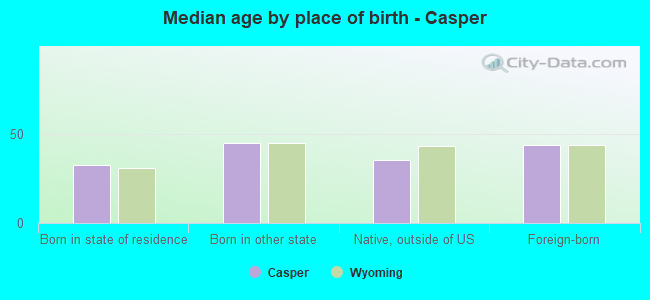
Median age by race in Casper
37.2 Median age for White residents35.8 38.8 70.7 Median age for Black or African American residents18.9 40.0 24.5 Median age for American Indian / Alaska Native residents13.3 23.0 82.8 Median age for Asian residents44.0 68.6 -594,708,994.1 Median age for Native Hawaiian / Pacific Islander residents-652,729,383.8 -666,666,666.0 41.3 Median age for Other race residents31.3 41.1 37.0 Median age for Two or more races residents33.7 41.2 37.7 Median age for White alone residents36.8 39.9 27.2 Median age for Hispanic or Latino residents25.9 35.0
Owner/renter occupied households by race in Casper
House owners and renters - White residents 16,008 71.8% Owner occupied6,302 28.2% Renter occupiedHouse owners and renters - Black or African American residents 134 100.0% Renter occupiedHouse owners and renters - American Indian / Alaska Native residents 92 37.2% Owner occupied155 62.8% Renter occupiedHouse owners and renters - Asian residents 116 100.0% Owner occupiedHouse owners and renters - Native Hawaiian / Pacific Islander residents 18 100.0% Renter occupiedHouse owners and renters - Other race residents 358 61.4% Owner occupied224 38.6% Renter occupiedHouse owners and renters - Two or more races residents 1,080 76.3% Owner occupied336 23.7% Renter occupiedHouse owners and renters - White alone residents 15,838 72.7% Owner occupied5,933 27.3% Renter occupiedHouse owners and renters - Hispanic or Latino residents 1,132 56.4% Owner occupied875 43.6% Renter occupied
Language usage in Casper
English speakers - Total 95.7% of residents of Casper speak English at home.
2.8% of residents speak Spanish at home 1,073 70.6% Speak English very well447 29.4% Speak English less than very well1.5% of residents speak other language at home 766 91.6% Speak English very well70 8.4% Speak English less than very well
English speakers - Born in the United States 97.8% of residents of Casper speak English at home.
1.5% of residents speak Spanish at home 341 84.0% Speak English very well65 16.0% Speak English less than very well0.7% of residents speak other language at home 184 97.9% Speak English very well4 2.1% Speak English less than very well
English speakers - Native, born elsewhere 76.6% of residents of Casper speak English at home.
2.8% of residents speak Spanish at home 10 100.0% Speak English very well18.6% of residents speak other language at home 66 100.0% Speak English very well
English speakers - Foreign-born 42.5% of residents of Casper speak English at home.
38.2% of residents speak Spanish at home 100 24.4% Speak English very well310 75.6% Speak English less than very well18.4% of residents speak other language at home 135 68.5% Speak English very well62 31.5% Speak English less than very well
White (Caucasian) - Speak only English Native:
97.8% (47,877)Foreign-born:
58.6% (241)
White (Caucasian) - Speak another language Native:
2.0% (982)Foreign-born:
43.9% (180)
Asian - Speak only English Native:
100.0% (31)Foreign-born:
98.1% (187)
Other race - Speak only English Native:
86.2% (858)Foreign-born:
7.5% (21)
Other race - Speak another language Native:
17.9% (178)Foreign-born:
92.4% (256)
Two or more races - Speak only English Native:
90.5% (3,016)Foreign-born:
26.4% (17)
Two or more races - Speak another language Native:
8.9% (295)Foreign-born:
21.5% (14)
White alone - Speak only English Native:
97.8% (45,925)Foreign-born:
59.7% (199)
White alone - Speak another language Native:
2.0% (925)Foreign-born:
40.2% (134)
Hispanic or Latino - Speak only English Native:
85.0% (3,683)Foreign-born:
25.3% (122)
Hispanic or Latino - Speak another language Native:
14.8% (642)Foreign-born:
83.9% (405)
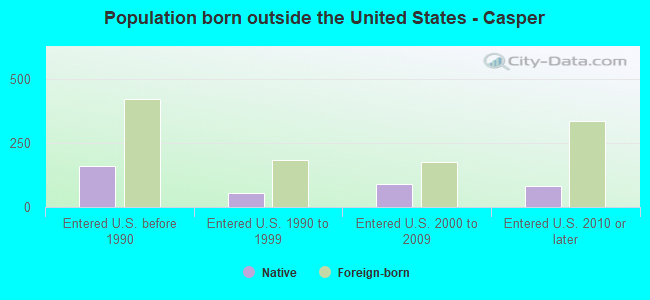
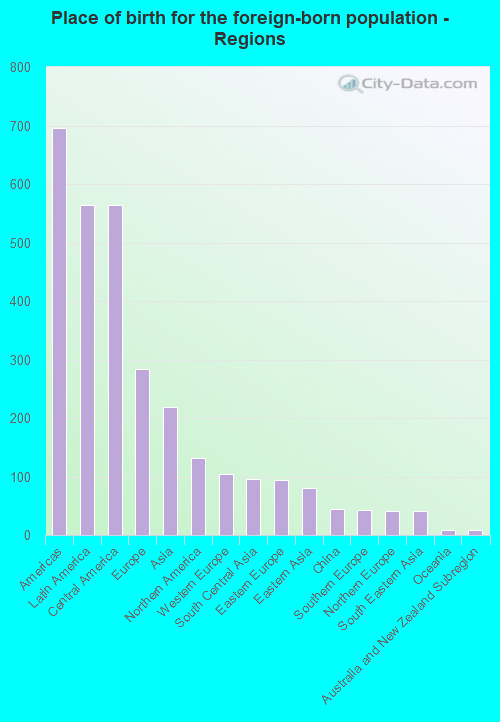
Foreign-born residents in Casper 1,215 residents are foreign born (0.9% Latin America , 0.5% Europe , 0.4% Asia , 0.2% North America ).
This city:
2.1%Wyoming:
3.4%
Marital status for residents in Casper Marital status - White (Caucasian) population 15 years and over
Males 35.1% Never married48.9% Now married0.3% Separated3.3% Widowed12.4% DivorcedFemales 25.0% Never married47.8% Now married1.3% Separated8.6% Widowed17.3% DivorcedWomen who gave birth in the past 12 months Now married:
69.4% (560)Unmarried:
30.6% (247)
Women who did not give birth in the past 12 months Now married:
44.4% (4,840)Unmarried:
55.6% (6,059)
Marital status - Black or African American population 15 years and over
Males 100.0% Never married0.0% Now married0.0% Separated0.0% Widowed0.0% DivorcedFemales 69.1% Never married14.6% Now married0.0% Separated2.2% Widowed14.0% DivorcedWomen who did not give birth in the past 12 months Now married:
0.0% (0)Unmarried:
100.0% (94)
Marital status - American Indian / Alaska Native population 15 years and over
Males 37.3% Never married24.0% Now married0.0% Separated33.3% Widowed5.3% DivorcedFemales 57.8% Never married32.7% Now married0.0% Separated1.6% Widowed7.9% DivorcedWomen who gave birth in the past 12 months Now married:
52.2% (11)Unmarried:
47.8% (10)
Women who did not give birth in the past 12 months Now married:
27.1% (65)Unmarried:
72.9% (175)
Marital status - Asian population 15 years and over
Males 0.0% Never married100.0% Now married0.0% Separated0.0% Widowed0.0% DivorcedFemales 4.3% Never married65.9% Now married0.0% Separated22.1% Widowed7.7% DivorcedWomen who did not give birth in the past 12 months Now married:
92.0% (105)Unmarried:
8.0% (9)
Marital status - Other race population 15 years and over
Males 54.0% Never married34.0% Now married2.1% Separated0.0% Widowed9.8% DivorcedFemales 3.0% Never married75.6% Now married0.0% Separated0.0% Widowed21.5% DivorcedWomen who did not give birth in the past 12 months Now married:
71.9% (207)Unmarried:
28.1% (81)
Marital status - Two or more races population 15 years and over
Males 52.1% Never married36.9% Now married0.6% Separated2.8% Widowed7.5% DivorcedFemales 39.1% Never married44.0% Now married0.0% Separated7.9% Widowed8.9% DivorcedWomen who gave birth in the past 12 months Now married:
100.0% (62)Unmarried:
0.0% (0)
Women who did not give birth in the past 12 months Now married:
32.5% (225)Unmarried:
67.5% (466)
Marital status - White alone, not Hispanic / Latino population 15 years and over
Males 33.4% Never married49.9% Now married0.2% Separated3.3% Widowed13.1% DivorcedFemales 24.3% Never married47.7% Now married1.3% Separated8.9% Widowed17.8% DivorcedWomen who gave birth in the past 12 months Now married:
65.1% (477)Unmarried:
34.9% (256)
Women who did not give birth in the past 12 months Now married:
44.6% (4,738)Unmarried:
55.4% (5,893)
Marital status - Hispanic or Latino population 15 years and over
Males 57.4% Never married36.1% Now married1.0% Separated1.9% Widowed3.6% DivorcedFemales 35.1% Never married53.8% Now married0.0% Separated1.7% Widowed9.4% DivorcedWomen who gave birth in the past 12 months Now married:
100.0% (143)Unmarried:
0.0% (0)
Women who did not give birth in the past 12 months Now married:
45.2% (524)Unmarried:
54.8% (636)
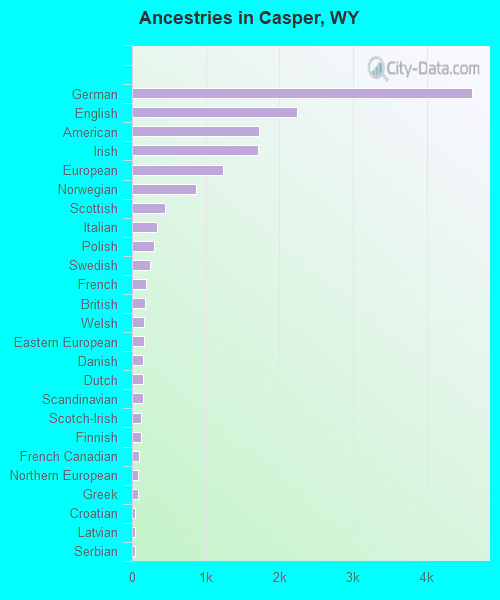
Ancestries in Casper
4,616 17.7% German2,239 8.6% English1,729 6.6% American1,713 6.6% Irish1,238 4.7% European867 3.3% Norwegian447 1.7% Scottish337 1.3% Italian302 1.2% Polish251 1.0% Swedish188 0.7% French174 0.7% British165 0.6% Welsh159 0.6% Eastern European154 0.6% Danish154 0.6% Dutch147 0.6% Scandinavian127 0.5% Scotch-Irish123 0.5% Finnish96 0.4% French Canadian84 0.3% Northern European76 0.3% Greek43 0.2% Croatian43 0.2% Latvian42 0.2% Serbian38 0.1% Arab38 0.1% Russian29 0.1% Belgian26 0.10% Czechoslovakian21 0.08% Canadian21 0.08% Czech13 0.05% Austrian11 0.04% Icelander9 0.03% Slovak7 0.03% Pennsylvania German
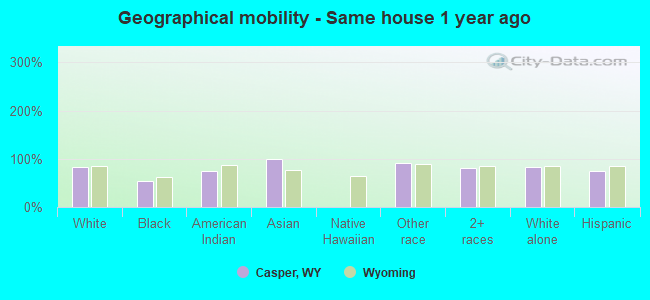
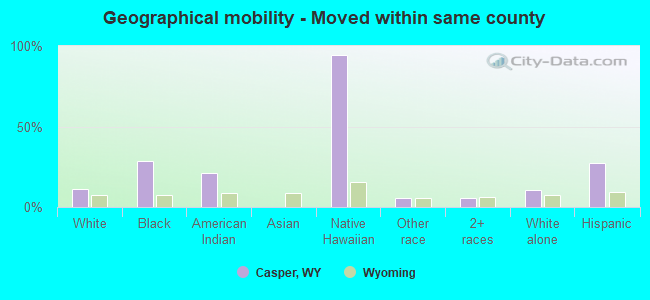
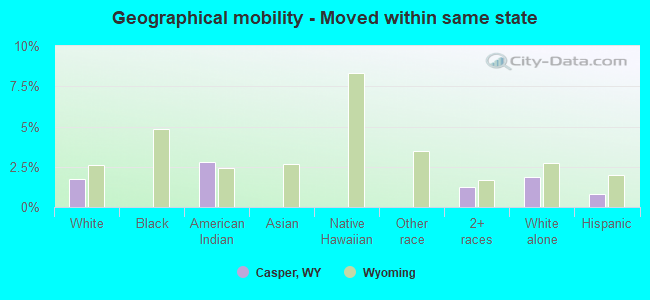
Geographical mobility in Casper Same house 1 year ago 43,019 84.2% White (Caucasian)85 53.0% Black or African American458 74.2% American Indian / Alaska Native268 99.8% Asian1,170 90.8% Other race2,963 81.3% Two or more races41,453 84.4% White alone, not Hispanic / Latino4,021 74.2% Hispanic or LatinoMoved within same county 5,769 11.3% White / Caucasian46 28.9% Black or African American129 20.8% American Indian / Alaska Native16 94.6% Native Hawaiian / Pacific Islander70 5.4% Other race205 5.6% Two or more races5,322 10.8% White alone, not Hispanic / Latino1,465 27.0% Hispanic or LatinoMoved within same state 895 1.8% White / Caucasian17 2.8% American Indian / Alaska Native45 1.2% Two or more races908 1.8% White alone, not Hispanic / Latino45 0.8% Hispanic or LatinoMoved from different state 2,206 4.3% White / Caucasian22 13.7% Black or African American2 0.3% American Indian / Alaska Native88 2.4% Two or more races2,205 4.5% White alone, not Hispanic / Latino169 3.1% Hispanic or LatinoMoved from abroad 90 0.2% White28 2.2% Other race90 0.2% White alone, not Hispanic / Latino65 1.2% Hispanic or Latino
Children Nativity (place of birth) in Casper
Children under 6 years - Living with two parents Both parents native 2,635 100.0% NativeOne native, one foreign-born parent 18 100.0% NativeChildren under 6 years - Living with one parent Native parent 1,593 100.0% NativeForeign-born parent 21 100.0% NativeChildren 6 to 17 years - Living with two parents Both parents native 5,370 99.9% Native3 0.1% Foreign-bornBoth parents foreign-born 22 70.9% Native9 29.1% Foreign-bornOne native, one foreign-born parent 299 100.0% NativeChildren 6 to 17 years - Living with one parent Native parent 3,493 100.0% NativeForeign-born parent 54 47.6% Native59 52.4% Foreign-born
Grandparents responsible for own grandchildren in Casper
Grandparents (30 to 59 years) White / Caucasian 112 26.9% Responsible for grandchildren303 73.1% Not responsible for grandchildrenAmerican Indian / Alaska Native 4 100.0% Not responsible for grandchildrenWhite alone, not Hispanic / Latino 121 32.8% Responsible for grandchildren247 67.2% Not responsible for grandchildrenHispanic or Latino 27 40.7% Responsible for grandchildren39 59.3% Not responsible for grandchildrenGrandparents (60 years and over) White / Caucasian 101 38.3% Responsible for grandchildren163 61.7% Not responsible for grandchildrenWhite alone, not Hispanic / Latino 71 33.9% Responsible for grandchildren139 66.1% Not responsible for grandchildrenHispanic or Latino 62 74.4% Responsible for grandchildren21 25.6% Not responsible for grandchildren