Races in Central Waterford, Connecticut (CT) Detailed Stats
Ancestries, Foreign-born residents, place of birth

Discuss Central Waterford, Connecticut races on our local forum with over 2,400,000 registered users
7.2% of Central Waterford, CT residents are foreign-born (2.9% born in Latin America, 2.4% born in Europe, 1.4% born in Asia), which is 109.6% less than the foreign-born rate of 15.0% across the entire state of Connecticut.
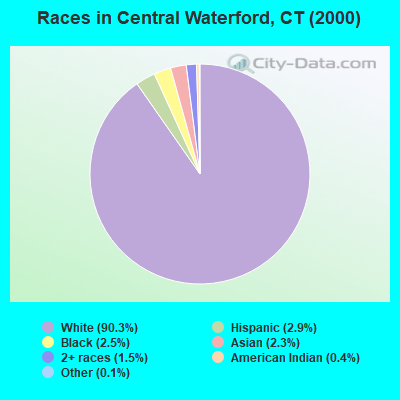
Race distribution in Central Waterford

- 2,65090.3%White alone
- 862.9%Hispanic
- 742.5%Black alone
- 672.3%Asian alone
- 431.5%Two or more races
- 120.4%American Indian alone
- 30.1%Other race alone
2000
2022
-
- 2,638,84577.5%White alone
- 320,3239.4%Hispanic
- 295,5718.7%Black alone
- 81,5642.4%Asian alone
- 52,8961.6%Two or more races
- 8,1410.2%Other race alone
- 7,2670.2%American Indian alone
- 9580.03%Native Hawaiian and Other
Pacific Islander alone

-
- 2,246,91362.0%White alone
- 658,97818.2%Hispanic
- 353,9739.8%Black alone
- 172,9294.8%Asian alone
- 159,6314.4%Two or more races
- 29,7610.8%Other race alone
- 3,4280.09%American Indian alone
- 5920.02%Native Hawaiian and Other
Pacific Islander alone

Income and house value in Central Waterford
- Median household income in 2022
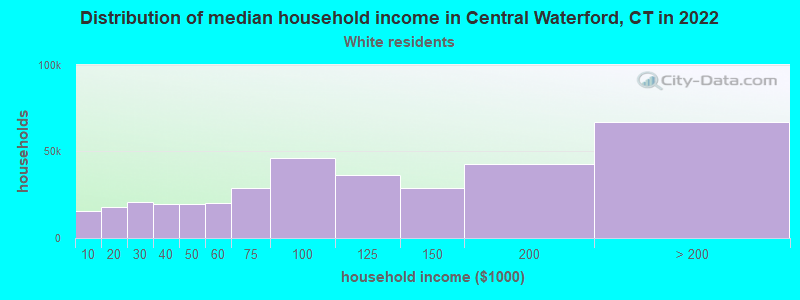
- $69,027White non-Hispanic householders
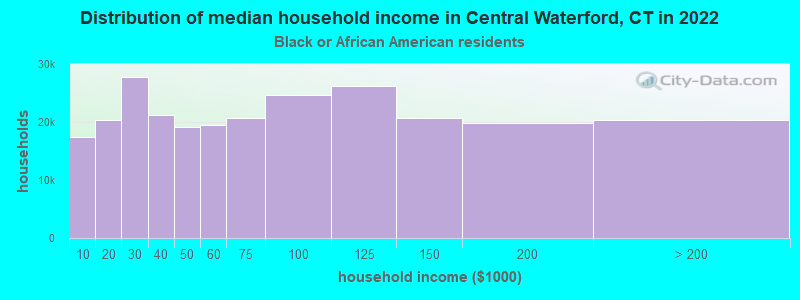
- $113,884Black householders
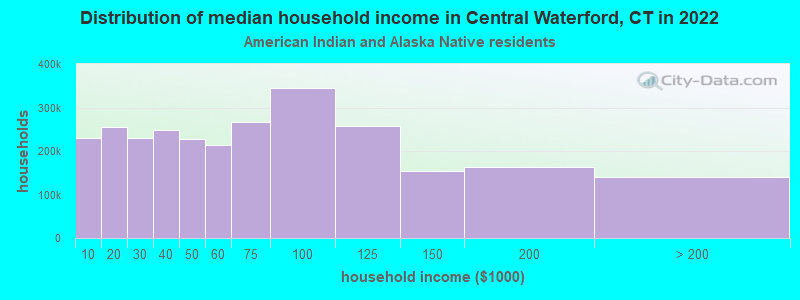
- $90,842American Indian and Alaska Native householders
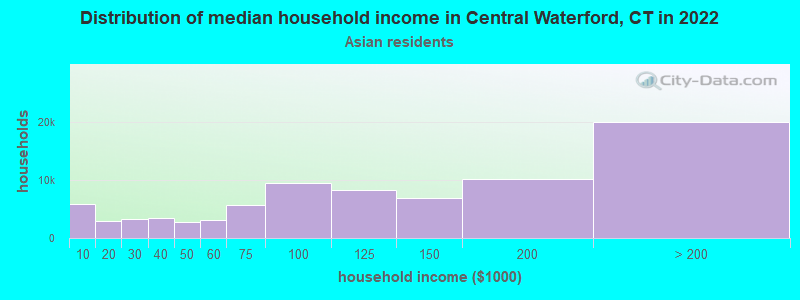
- $147,027Asian householders
- $141,160Some other race householders
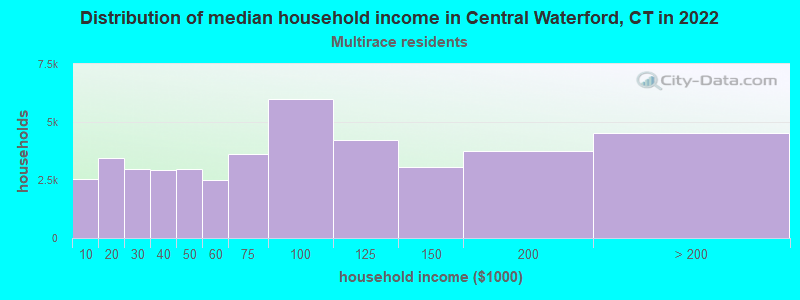
- $25,598Two or more races householders
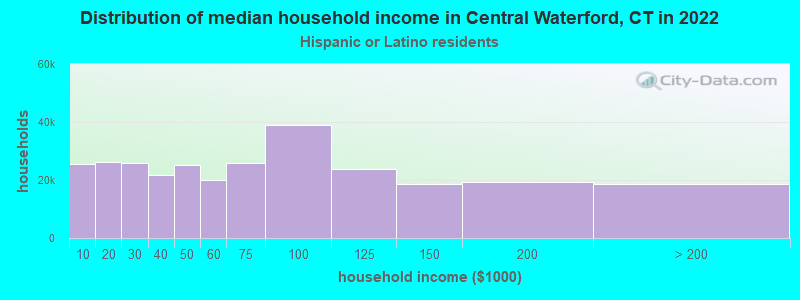
- $79,929Hispanic or Latino race householders
- Median 2022 house value
- $258,778White Non-Hispanic householders
- $258,130Black or African American householders
- $324,283American Indian or Alaska Native householders
- $297,260Some other race householders
- $205,379Two or more races householders
- $297,260Hispanic or Latino householders
Household income for White non-Hispanic householders
Household income for Black householders
Household income for American Indian and Alaska Native householders
Household income for Asian householders
Household income for Two or more races householders
Household income for Hispanic or Latino race householders
Foreign-born residents in Central Waterford
210 residents are foreign born (2.9% Latin America, 2.4% Europe, 1.4% Asia).
| This city: | 7.2% |
| Connecticut: | 10.9% |
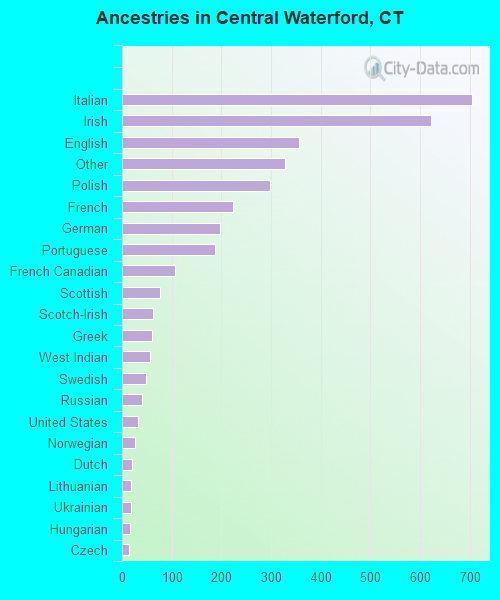
Ancestries in Central Waterford

- 70419.9%Italian
- 62317.7%Irish
- 35710.1%English
- 3289.3%Other
- 2998.5%Polish
- 2236.3%French
- 1985.6%German
- 1875.3%Portuguese
- 1073.0%French Canadian
- 772.2%Scottish
- 621.8%Scotch-Irish
- 601.7%Greek
- 561.6%West Indian
- 481.4%Swedish
- 401.1%Russian
- 320.9%United States
- 270.8%Norwegian
- 200.6%Dutch
- 190.5%Lithuanian
- 190.5%Ukrainian
- 160.5%Hungarian
- 150.4%Czech
- 60.2%Arab
- 60.2%Welsh
Zip codes: 06385.