Races in Chelsea, Massachusetts (MA) Detailed Stats
Data:
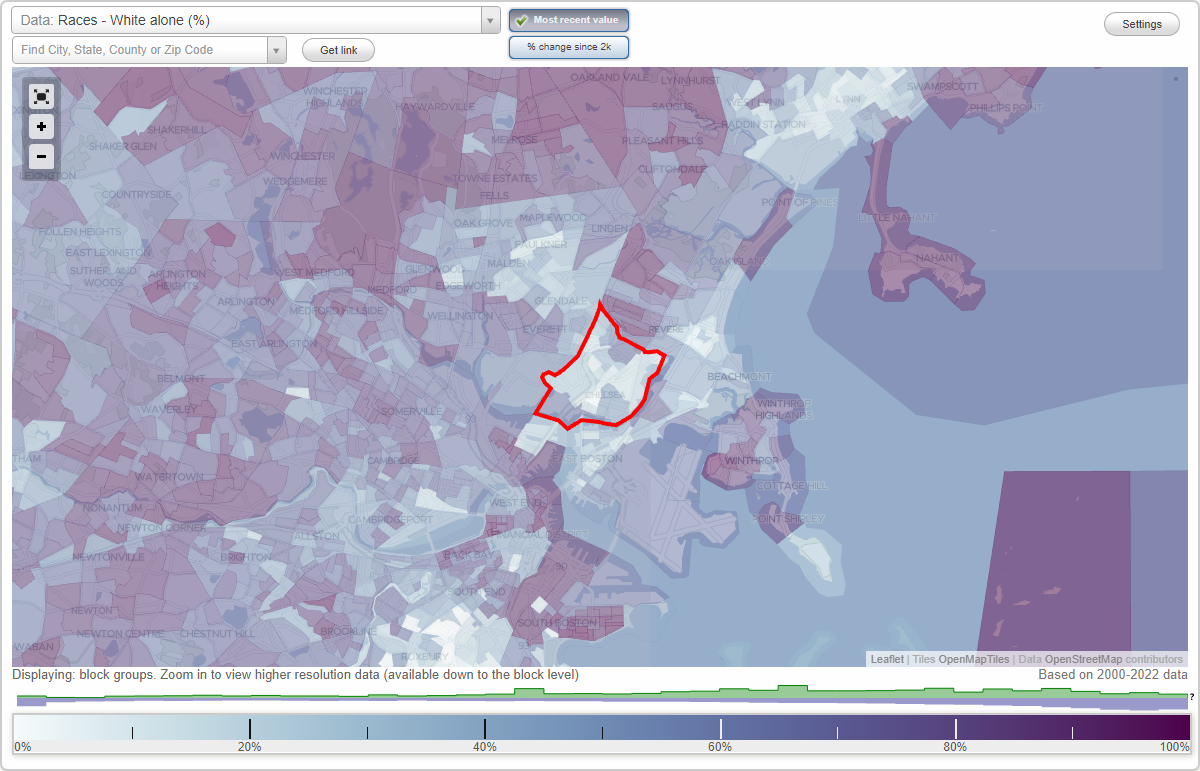
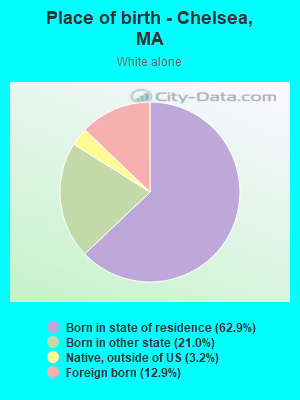
Races - White alone (%)
Races - White alone (% change since 2000)
Races - Black alone (%)
Races - Black alone (% change since 2000)
Races - American Indian alone (%)
Races - American Indian alone (% change since 2000)
Races - Asian alone (%)
Races - Asian alone (% change since 2000)
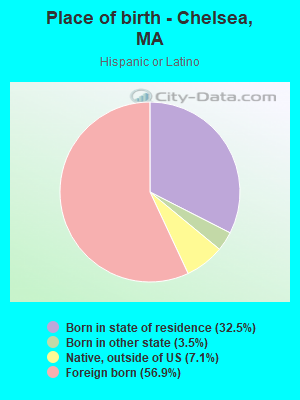
Races - Hispanic (%)
Races - Hispanic (% change since 2000)
Races - Native Hawaiian and Other Pacific Islander alone (%)
Races - Native Hawaiian and Other Pacific Islander alone (% change since 2000)
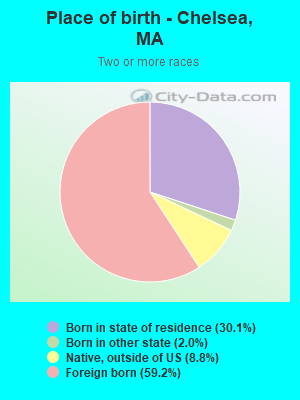
Races - Two or more races(%)
Races - Two or more races(% change since 2000)
Races - Other race alone (%)
Races - Other race alone (% change since 2000)
Racial diversity
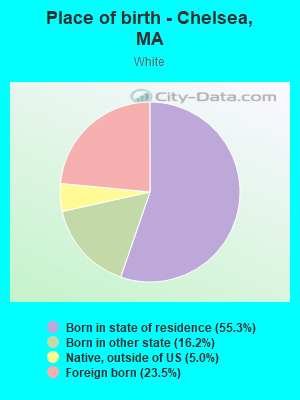
Place of birth - Born in state of residence (%)
Place of birth - Born in state of residence (%) - White
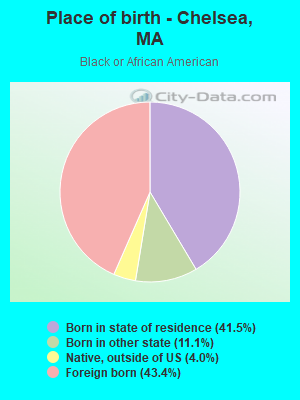
Place of birth - Born in state of residence (%) - Black or African American
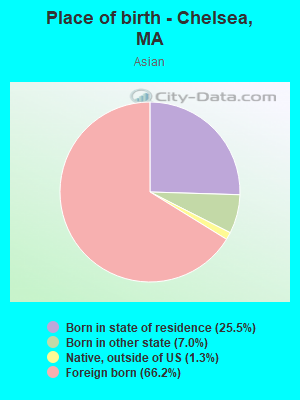
Place of birth - Born in state of residence (%) - Asian
Place of birth - Born in state of residence (%) - Hispanic or Latino
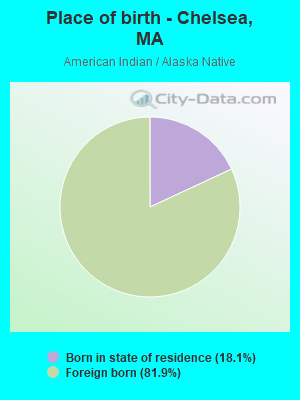
Place of birth - Born in state of residence (%) - American Indian and Alaska Native
Place of birth - Born in state of residence (%) - Multirace
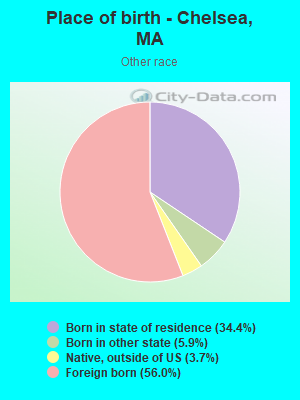
Place of birth - Born in state of residence (%) - Other Race
Place of birth - Born in other state (%)
Place of birth - Born in other state (%) - White
Place of birth - Born in other state (%) - Black or African American
Place of birth - Born in other state (%) - Asian
Place of birth - Born in other state (%) - Hispanic or Latino
Place of birth - Born in other state (%) - American Indian and Alaska Native
Place of birth - Born in other state (%) - Multirace
Place of birth - Born in other state (%) - Other Race
Place of birth - Native, outside of US (%)
Place of birth - Native, outside of US (%) - White
Place of birth - Native, outside of US (%) - Black or African American
Place of birth - Native, outside of US (%) - Asian
Place of birth - Native, outside of US (%) - Hispanic or Latino
Place of birth - Native, outside of US (%) - American Indian and Alaska Native
Place of birth - Native, outside of US (%) - Multirace
Place of birth - Native, outside of US (%) - Other Race
Place of birth - Foreign born (%)
Place of birth - Foreign born (%) - White
Place of birth - Foreign born (%) - Black or African American
Place of birth - Foreign born (%) - Asian
Place of birth - Foreign born (%) - Hispanic or Latino
Place of birth - Foreign born (%) - American Indian and Alaska Native
Place of birth - Foreign born (%) - Multirace
Place of birth - Foreign born (%) - Other Race
Residents speaking English at home (%)
Residents speaking English at home - Born in the United States (%)
Residents speaking English at home - Native, born elsewhere (%)
Residents speaking English at home - Foreign born (%)
Residents speaking Spanish at home (%)
Residents speaking Spanish at home - Born in the United States (%)
Residents speaking Spanish at home - Native, born elsewhere (%)
Residents speaking Spanish at home - Foreign born (%)
Residents speaking other language at home (%)
Residents speaking other language at home - Born in the United States (%)
Residents speaking other language at home - Native, born elsewhere (%)
Residents speaking other language at home - Foreign born (%)
Marital status - Never married (%)
Marital status - Now married (%)
Marital status - Separated (%)
Marital status - Widowed (%)
Marital status - Divorced (%)
Ancestries Reported - Arab (%)
Ancestries Reported - Czech (%)
Ancestries Reported - Danish (%)
Ancestries Reported - Dutch (%)
Ancestries Reported - English (%)
Ancestries Reported - French (%)
Ancestries Reported - French Canadian (%)
Ancestries Reported - German (%)
Ancestries Reported - Greek (%)
Ancestries Reported - Hungarian (%)
Ancestries Reported - Irish (%)
Ancestries Reported - Italian (%)
Ancestries Reported - Lithuanian (%)
Ancestries Reported - Norwegian (%)
Ancestries Reported - Polish (%)
Ancestries Reported - Portuguese (%)
Ancestries Reported - Russian (%)
Ancestries Reported - Scotch-Irish (%)
Ancestries Reported - Scottish (%)
Ancestries Reported - Slovak (%)
Ancestries Reported - Subsaharan African (%)
Ancestries Reported - Swedish (%)
Ancestries Reported - Swiss (%)
Ancestries Reported - Ukrainian (%)
Ancestries Reported - United States (%)
Ancestries Reported - Welsh (%)
Ancestries Reported - West Indian (%)
Ancestries Reported - Other (%)
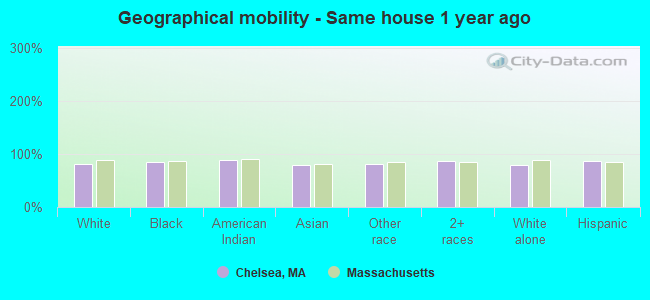
Geographical mobility - Same house 1 year ago (%)
Geographical mobility - Same house 1 year ago (%) - White
Geographical mobility - Same house 1 year ago (%) - Black or African American
Geographical mobility - Same house 1 year ago (%) - Asian
Geographical mobility - Same house 1 year ago (%) - Hispanic or Latino
Geographical mobility - Same house 1 year ago (%) - American Indian and Alaska Native
Geographical mobility - Same house 1 year ago (%) - Multirace
Geographical mobility - Same house 1 year ago (%) - Other Race
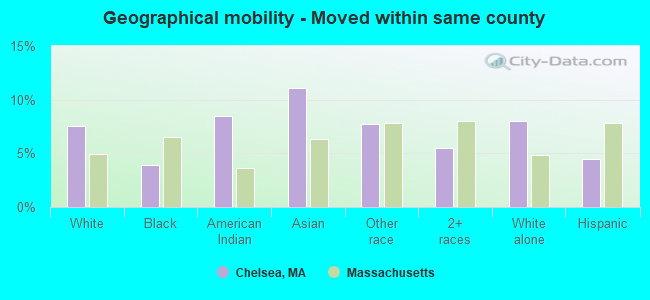
Geographical mobility - Moved within same county (%)
Geographical mobility - Moved within same county (%) - White
Geographical mobility - Moved within same county (%) - Black or African American
Geographical mobility - Moved within same county (%) - Asian
Geographical mobility - Moved within same county (%) - Hispanic or Latino
Geographical mobility - Moved within same county (%) - American Indian and Alaska Native
Geographical mobility - Moved within same county (%) - Multirace
Geographical mobility - Moved within same county (%) - Other Race
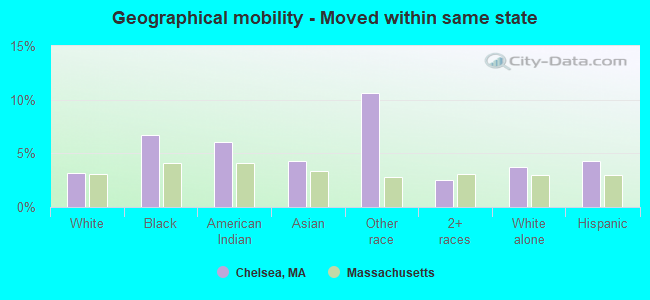
Geographical mobility - Moved from different county within same state (%)
Geographical mobility - Moved from different county within same state (%) - White
Geographical mobility - Moved from different county within same state (%) - Black or African American
Geographical mobility - Moved from different county within same state (%) - Asian
Geographical mobility - Moved from different county within same state (%) - Hispanic or Latino
Geographical mobility - Moved from different county within same state (%) - American Indian and Alaska Native
Geographical mobility - Moved from different county within same state (%) - Multirace
Geographical mobility - Moved from different county within same state (%) - Other Race
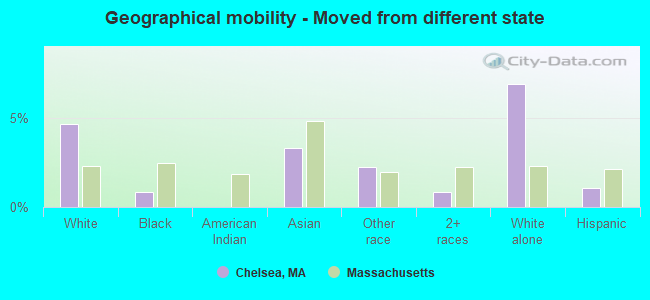
Geographical mobility - Moved from different state (%)
Geographical mobility - Moved from different state (%) - White
Geographical mobility - Moved from different state (%) - Black or African American
Geographical mobility - Moved from different state (%) - Asian
Geographical mobility - Moved from different state (%) - Hispanic or Latino
Geographical mobility - Moved from different state (%) - American Indian and Alaska Native
Geographical mobility - Moved from different state (%) - Multirace
Geographical mobility - Moved from different state (%) - Other Race
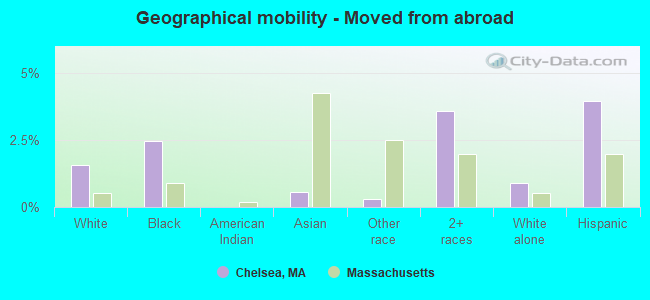
Geographical mobility - Moved from abroad (%)
Geographical mobility - Moved from abroad (%) - White
Geographical mobility - Moved from abroad (%) - Black or African American
Geographical mobility - Moved from abroad (%) - Asian
Geographical mobility - Moved from abroad (%) - Hispanic or Latino
Geographical mobility - Moved from abroad (%) - American Indian and Alaska Native
Geographical mobility - Moved from abroad (%) - Multirace
Geographical mobility - Moved from abroad (%) - Other Race
Place of birth for the foreign-born population - Ireland (%)
Place of birth for the foreign-born population - Denmark (%)
Place of birth for the foreign-born population - Norway (%)
Place of birth for the foreign-born population - Sweden (%)
Place of birth for the foreign-born population - United Kingdom (%)
Place of birth for the foreign-born population - England (%)
Place of birth for the foreign-born population - Scotland (%)
Place of birth for the foreign-born population - Other Northern Europe (%)
Place of birth for the foreign-born population - Austria (%)
Place of birth for the foreign-born population - Belgium (%)
Place of birth for the foreign-born population - France (%)
Place of birth for the foreign-born population - Germany (%)
Place of birth for the foreign-born population - Netherlands (%)
Place of birth for the foreign-born population - Switzerland (%)
Place of birth for the foreign-born population - Other Western Europe (%)
Place of birth for the foreign-born population - Greece (%)
Place of birth for the foreign-born population - Italy (%)
Place of birth for the foreign-born population - Portugal (%)
Place of birth for the foreign-born population - Spain (%)
Place of birth for the foreign-born population - Other Southern Europe (%)
Place of birth for the foreign-born population - Albania (%)
Place of birth for the foreign-born population - Belarus (%)
Place of birth for the foreign-born population - Bosnia and Herzegovina (%)
Place of birth for the foreign-born population - Bulgaria (%)
Place of birth for the foreign-born population - Croatia (%)
Place of birth for the foreign-born population - Czechoslovakia (%)
Place of birth for the foreign-born population - Hungary (%)
Place of birth for the foreign-born population - Latvia (%)
Place of birth for the foreign-born population - Lithuania (%)
Place of birth for the foreign-born population - North Macedonia (Macedonia) (%)
Place of birth for the foreign-born population - Moldova (%)
Place of birth for the foreign-born population - Poland (%)
Place of birth for the foreign-born population - Romania (%)
Place of birth for the foreign-born population - Russia (%)
Place of birth for the foreign-born population - Serbia (%)
Place of birth for the foreign-born population - Ukraine (%)
Place of birth for the foreign-born population - Other Eastern Europe (%)
Place of birth for the foreign-born population - China (%)
Place of birth for the foreign-born population - Hong Kong (%)
Place of birth for the foreign-born population - Taiwan (%)
Place of birth for the foreign-born population - Japan (%)
Place of birth for the foreign-born population - Korea (%)
Place of birth for the foreign-born population - Other Eastern Asia (%)
Place of birth for the foreign-born population - Afghanistan (%)
Place of birth for the foreign-born population - Bangladesh (%)
Place of birth for the foreign-born population - India (%)
Place of birth for the foreign-born population - Iran (%)
Place of birth for the foreign-born population - Kazakhstan (%)
Place of birth for the foreign-born population - Nepal (%)
Place of birth for the foreign-born population - Pakistan (%)
Place of birth for the foreign-born population - Sri Lanka (%)
Place of birth for the foreign-born population - Uzbekistan (%)
Place of birth for the foreign-born population - Other South Central Asia (%)
Place of birth for the foreign-born population - Burma (%)
Place of birth for the foreign-born population - Cambodia (%)
Place of birth for the foreign-born population - Indonesia (%)
Place of birth for the foreign-born population - Laos (%)
Place of birth for the foreign-born population - Malaysia (%)
Place of birth for the foreign-born population - Philippines (%)
Place of birth for the foreign-born population - Singapore (%)
Place of birth for the foreign-born population - Thailand (%)
Place of birth for the foreign-born population - Vietnam (%)
Place of birth for the foreign-born population - Other South Eastern Asia (%)
Place of birth for the foreign-born population - Armenia (%)
Place of birth for the foreign-born population - Iraq (%)
Place of birth for the foreign-born population - Israel (%)
Place of birth for the foreign-born population - Jordan (%)
Place of birth for the foreign-born population - Kuwait (%)
Place of birth for the foreign-born population - Lebanon (%)
Place of birth for the foreign-born population - Saudi Arabia (%)
Place of birth for the foreign-born population - Syria (%)
Place of birth for the foreign-born population - Turkey (%)
Place of birth for the foreign-born population - Yemen (%)
Place of birth for the foreign-born population - Other Western Asia (%)
Place of birth for the foreign-born population - Eritrea (%)
Place of birth for the foreign-born population - Ethiopia (%)
Place of birth for the foreign-born population - Kenya (%)
Place of birth for the foreign-born population - Somalia (%)
Place of birth for the foreign-born population - Uganda (%)
Place of birth for the foreign-born population - Zimbabwe (%)
Place of birth for the foreign-born population - Other Eastern Africa (%)
Place of birth for the foreign-born population - Cameroon (%)
Place of birth for the foreign-born population - Congo (%)
Place of birth for the foreign-born population - Democratic Republic of Congo (Zaire) (%)
Place of birth for the foreign-born population - Other Middle Africa (%)
Place of birth for the foreign-born population - Egypt (%)
Place of birth for the foreign-born population - Morocco (%)
Place of birth for the foreign-born population - Sudan (%)
Place of birth for the foreign-born population - Other Northern Africa (%)
Place of birth for the foreign-born population - South Africa (%)
Place of birth for the foreign-born population - Other Southern Africa (%)
Place of birth for the foreign-born population - Cabo Verde (%)
Place of birth for the foreign-born population - Ghana (%)
Place of birth for the foreign-born population - Liberia (%)
Place of birth for the foreign-born population - Nigeria (%)
Place of birth for the foreign-born population - Senegal (%)
Place of birth for the foreign-born population - Sierra Leone (%)
Place of birth for the foreign-born population - Other Western Africa (%)
Place of birth for the foreign-born population - Australia (%)
Place of birth for the foreign-born population - New Zealand (%)
Place of birth for the foreign-born population - Fiji (%)
Place of birth for the foreign-born population - Micronesia (%)
Place of birth for the foreign-born population - Bahamas (%)
Place of birth for the foreign-born population - Barbados (%)
Place of birth for the foreign-born population - Cuba (%)
Place of birth for the foreign-born population - Dominica (%)
Place of birth for the foreign-born population - Dominican Republic (%)
Place of birth for the foreign-born population - Grenada (%)
Place of birth for the foreign-born population - Haiti (%)
Place of birth for the foreign-born population - Jamaica (%)
Place of birth for the foreign-born population - St. Vincent and the Grenadines (%)
Place of birth for the foreign-born population - Trinidad and Tobago (%)
Place of birth for the foreign-born population - West Indies (%)
Place of birth for the foreign-born population - Other Caribbean (%)
Place of birth for the foreign-born population - Belize (%)
Place of birth for the foreign-born population - Costa Rica (%)
Place of birth for the foreign-born population - El Salvador (%)
Place of birth for the foreign-born population - Guatemala (%)
Place of birth for the foreign-born population - Honduras (%)
Place of birth for the foreign-born population - Mexico (%)
Place of birth for the foreign-born population - Nicaragua (%)
Place of birth for the foreign-born population - Panama (%)
Place of birth for the foreign-born population - Other Central America (%)
Place of birth for the foreign-born population - Argentina (%)
Place of birth for the foreign-born population - Bolivia (%)
Place of birth for the foreign-born population - Brazil (%)
Place of birth for the foreign-born population - Chile (%)
Place of birth for the foreign-born population - Colombia (%)
Place of birth for the foreign-born population - Ecuador (%)
Place of birth for the foreign-born population - Guyana (%)
Place of birth for the foreign-born population - Peru (%)
Place of birth for the foreign-born population - Uruguay (%)
Place of birth for the foreign-born population - Venezuela (%)
Place of birth for the foreign-born population - Other South America (%)
Place of birth for the foreign-born population - Canada (%)
Place of birth for the foreign-born population - Other Northern America (%)
Place of birth for the foreign-born population - Other (%)
Latest news about races in Chelsea, MA collected exclusively by city-data.com from local newspapers, TV, and radio stations
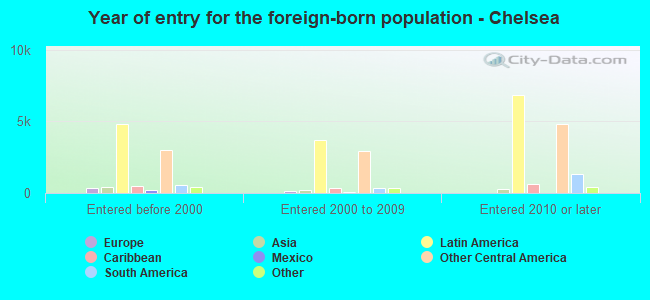
According to 2022 data, the most numerous races in Chelsea, MA are White alone (7,666 residents), Hispanic (26,701 residents), and Asian alone (1,118 residents). 29.4% of Chelsea residents speak English at home. 49.4% of Chelsea, MA residents are foreign-born (40.0% born in Latin America), which is 63.6% greater than the foreign-born rate of 18.0% across the entire state of Massachusetts.
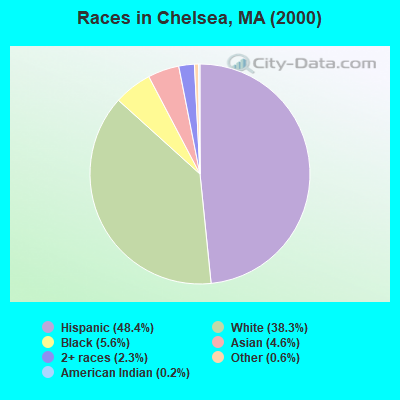
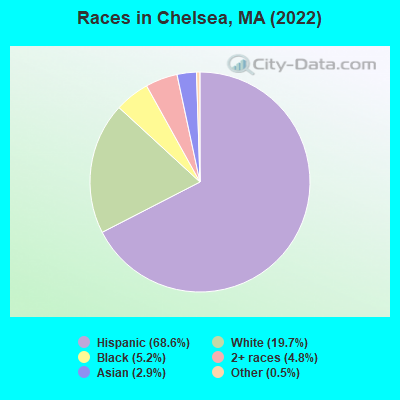
Race distribution in Chelsea
2000 2022
5,198,359 81.9% White alone 428,729 6.8% Hispanic 318,329 5.0% Black alone 236,786 3.7% Asian alone 110,338 1.7% Two or more races 43,586 0.7% Other race alone 11,264 0.2% American Indian alone 1,706 0.03% Native Hawaiian and Other
4,676,627 67.0% White alone 911,038 13.0% Hispanic 501,463 7.2% Asian alone 459,740 6.6% Black alone 341,889 4.9% Two or more races 84,403 1.2% Other race alone 5,838 0.08% American Indian alone 976 0.01% Native Hawaiian and Other
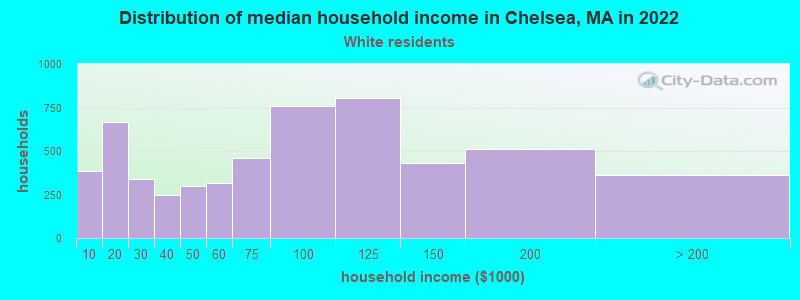
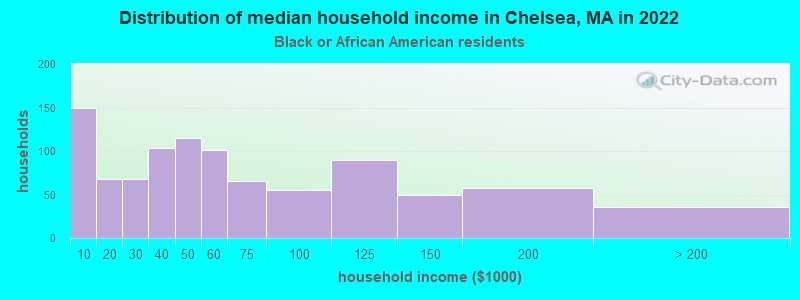
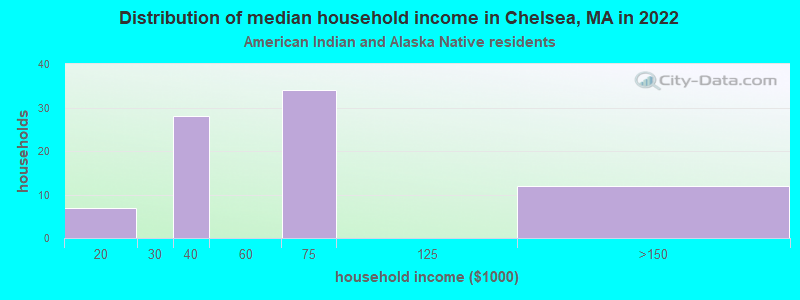
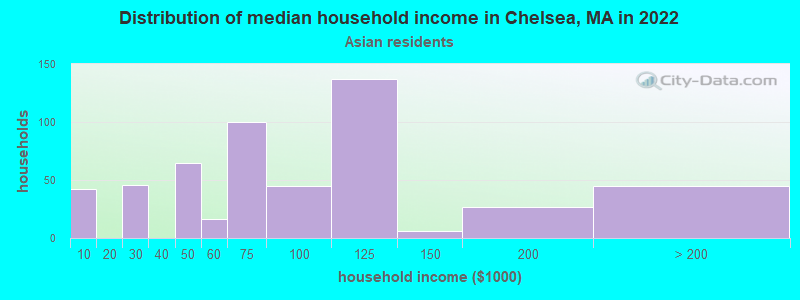
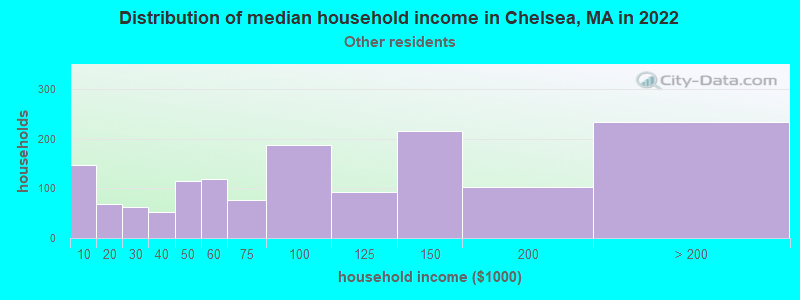
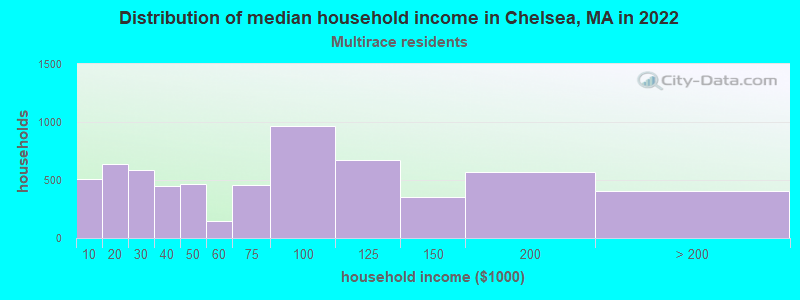
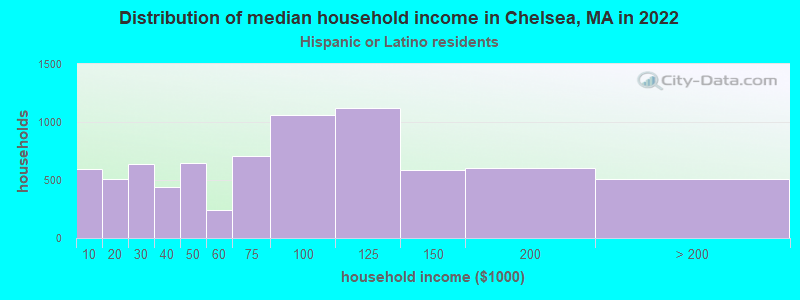
Income and house value in Chelsea Median household income in 2022 $72,109 White non-Hispanic householders$42,735 Black householders$73,394 American Indian and Alaska Native householders$84,249 Asian householders$86,761 Some other race householders$65,163 Two or more races householders$79,598 Hispanic or Latino race householdersMedian 2022 house value $440,386 White Non-Hispanic householders$473,628 Black or African American householders $222,466 Asian householders$400,041 Some other race householders$383,562 Two or more races householders$397,768 Hispanic or Latino householders
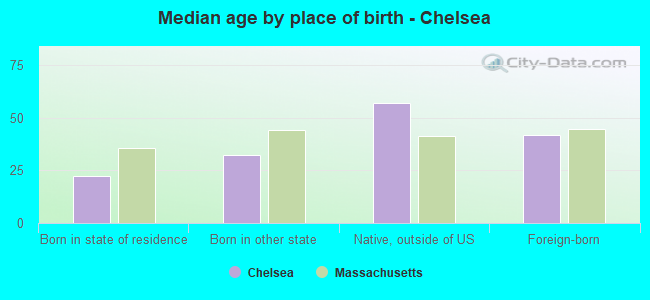
Median age by race in Chelsea
37.4 Median age for White residents37.0 37.5 35.6 Median age for Black or African American residents39.9 32.6 39.8 Median age for American Indian / Alaska Native residents41.8 35.1 43.1 Median age for Asian residents42.4 38.2 -514,227,641.8 Median age for Native Hawaiian / Pacific Islander residents-513,131,312.6 -508,717,948.2 32.1 Median age for Other race residents32.0 31.8 35.0 Median age for Two or more races residents34.8 35.3 44.3 Median age for White alone residents45.8 43.7 33.6 Median age for Hispanic or Latino residents34.0 32.7
Owner/renter occupied households by race in Chelsea
House owners and renters - White residents 1,902 34.1% Owner occupied3,678 65.9% Renter occupiedHouse owners and renters - Black or African American residents 162 16.1% Owner occupied843 83.9% Renter occupiedHouse owners and renters - American Indian / Alaska Native residents 110 100.0% Renter occupiedHouse owners and renters - Asian residents 279 54.7% Owner occupied231 45.3% Renter occupiedHouse owners and renters - Other race residents 467 29.9% Owner occupied1,096 70.1% Renter occupiedHouse owners and renters - Two or more races residents 1,450 23.0% Owner occupied4,855 77.0% Renter occupiedHouse owners and renters - White alone residents 1,626 37.8% Owner occupied2,680 62.2% Renter occupiedHouse owners and renters - Hispanic or Latino residents 1,774 23.4% Owner occupied5,797 76.6% Renter occupied
Language usage in Chelsea
English speakers - Total 29.4% of residents of Chelsea speak English at home.
61.0% of residents speak Spanish at home 8,252 37.6% Speak English very well13,702 62.4% Speak English less than very well10.0% of residents speak other language at home 1,847 51.1% Speak English very well1,764 48.9% Speak English less than very well
English speakers - Born in the United States 76.9% of residents of Chelsea speak English at home.
19.2% of residents speak Spanish at home 472 85.7% Speak English very well79 14.3% Speak English less than very well3.3% of residents speak other language at home 94 100.0% Speak English very well
English speakers - Native, born elsewhere 18.4% of residents of Chelsea speak English at home.
69.5% of residents speak Spanish at home 616 38.1% Speak English very well1,000 61.9% Speak English less than very well10.9% of residents speak other language at home 105 41.3% Speak English very well149 58.7% Speak English less than very well
English speakers - Foreign-born 5.0% of residents of Chelsea speak English at home.
82.9% of residents speak Spanish at home 2,696 18.2% Speak English very well12,137 81.8% Speak English less than very well15.3% of residents speak other language at home 1,162 42.5% Speak English very well1,571 57.5% Speak English less than very well
White (Caucasian) - Speak only English Native:
76.2% (6,432)Foreign-born:
8.9% (237)
White (Caucasian) - Speak another language Native:
18.0% (1,518)Foreign-born:
88.5% (2,353)
Black or African American - Speak only English Native:
80.3% (927)Foreign-born:
12.6% (122)
Black or African American - Speak another language Native:
18.6% (215)Foreign-born:
76.8% (745)
American Indian / Alaska Native - Speak only English Native:
17.9% (15)Foreign-born:
2.9% (11)
American Indian / Alaska Native - Speak another language Native:
100.0% (83)Foreign-born:
86.1% (330)
Asian - Speak only English Native:
40.0% (148)Foreign-born:
12.9% (93)
Asian - Speak another language Native:
59.8% (221)Foreign-born:
86.1% (623)
Other race - Speak only English Native:
39.8% (825)Foreign-born:
7.4% (234)
Other race - Speak another language Native:
61.2% (1,267)Foreign-born:
92.0% (2,895)
Two or more races - Speak only English Native:
22.9% (1,632)Foreign-born:
1.1% (138)
Two or more races - Speak another language Native:
79.1% (5,635)Foreign-born:
100.0% (12,647)
White alone - Speak only English Native:
90.7% (5,809)Foreign-born:
17.3% (170)
White alone - Speak another language Native:
8.4% (535)Foreign-born:
84.1% (830)
Hispanic or Latino - Speak only English Native:
23.5% (2,204)Foreign-born:
2.3% (342)
Hispanic or Latino - Speak another language Native:
76.0% (7,137)Foreign-born:
98.3% (14,686)
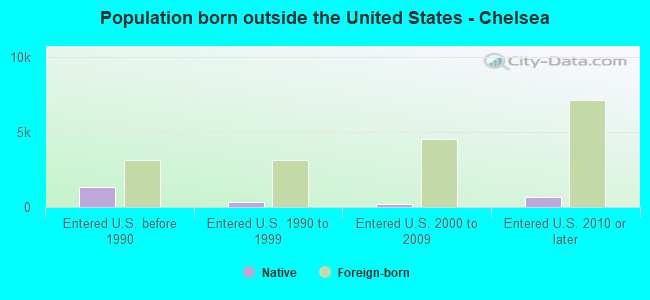
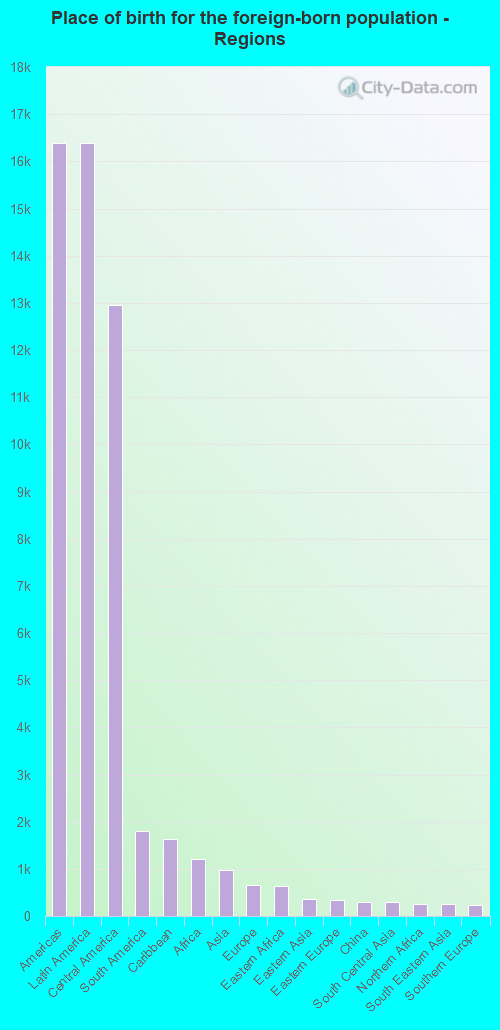
Foreign-born residents in Chelsea 19,246 residents are foreign born (40.0% Latin America ).
This city:
49.4%Massachusetts:
17.6%
Marital status for residents in Chelsea Marital status - White (Caucasian) population 15 years and over
Males 49.5% Never married34.1% Now married3.3% Separated5.1% Widowed8.1% DivorcedFemales 44.9% Never married32.0% Now married2.5% Separated9.5% Widowed11.1% DivorcedWomen who gave birth in the past 12 months Now married:
84.6% (60)Unmarried:
15.4% (11)
Women who did not give birth in the past 12 months Now married:
32.2% (1,069)Unmarried:
67.8% (2,254)
Marital status - Black or African American population 15 years and over
Males 49.0% Never married34.9% Now married1.9% Separated0.0% Widowed14.3% DivorcedFemales 45.5% Never married25.6% Now married1.3% Separated11.2% Widowed16.4% DivorcedWomen who gave birth in the past 12 months Now married:
100.0% (19)Unmarried:
0.0% (0)
Women who did not give birth in the past 12 months Now married:
15.8% (79)Unmarried:
84.2% (423)
Marital status - American Indian / Alaska Native population 15 years and over
Males 39.8% Never married47.3% Now married0.0% Separated0.0% Widowed12.9% DivorcedFemales 51.6% Never married37.1% Now married0.0% Separated0.0% Widowed11.3% DivorcedWomen who did not give birth in the past 12 months Now married:
52.3% (27)Unmarried:
47.7% (25)
Marital status - Asian population 15 years and over
Males 42.7% Never married54.6% Now married0.7% Separated0.0% Widowed2.0% DivorcedFemales 33.4% Never married53.8% Now married0.0% Separated7.1% Widowed5.8% DivorcedWomen who gave birth in the past 12 months Now married:
100.0% (42)Unmarried:
0.0% (0)
Women who did not give birth in the past 12 months Now married:
48.0% (147)Unmarried:
52.0% (160)
Marital status - Other race population 15 years and over
Males 48.7% Never married41.0% Now married0.9% Separated1.4% Widowed8.0% DivorcedFemales 46.0% Never married40.3% Now married3.5% Separated2.6% Widowed7.6% DivorcedWomen who gave birth in the past 12 months Now married:
0.0% (0)Unmarried:
100.0% (63)
Women who did not give birth in the past 12 months Now married:
41.8% (568)Unmarried:
58.2% (792)
Marital status - Two or more races population 15 years and over
Males 51.8% Never married36.7% Now married3.5% Separated3.2% Widowed5.0% DivorcedFemales 40.4% Never married29.9% Now married11.2% Separated7.5% Widowed11.0% DivorcedWomen who gave birth in the past 12 months Now married:
34.8% (81)Unmarried:
65.2% (151)
Women who did not give birth in the past 12 months Now married:
35.2% (1,691)Unmarried:
64.8% (3,113)
Marital status - White alone, not Hispanic / Latino population 15 years and over
Males 50.6% Never married27.2% Now married3.6% Separated7.6% Widowed11.0% DivorcedFemales 44.9% Never married25.2% Now married2.7% Separated14.3% Widowed12.9% DivorcedWomen who gave birth in the past 12 months Now married:
76.5% (38)Unmarried:
23.5% (12)
Women who did not give birth in the past 12 months Now married:
24.3% (462)Unmarried:
75.7% (1,441)
Marital status - Hispanic or Latino population 15 years and over
Males 48.7% Never married40.4% Now married2.7% Separated2.6% Widowed5.7% DivorcedFemales 42.5% Never married35.1% Now married7.6% Separated5.1% Widowed9.7% DivorcedWomen who gave birth in the past 12 months Now married:
33.9% (94)Unmarried:
66.1% (182)
Women who did not give birth in the past 12 months Now married:
37.1% (2,530)Unmarried:
62.9% (4,287)
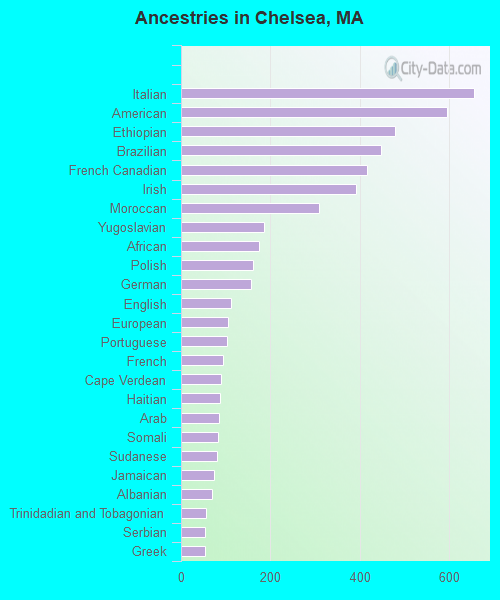
Ancestries in Chelsea
657 2.4% Italian596 2.2% American480 1.7% Ethiopian449 1.6% Brazilian416 1.5% French Canadian392 1.4% Irish309 1.1% Moroccan185 0.7% Yugoslavian175 0.6% African161 0.6% Polish156 0.6% German113 0.4% English105 0.4% European102 0.4% Portuguese93 0.3% French90 0.3% Cape Verdean88 0.3% Haitian86 0.3% Arab83 0.3% Somali81 0.3% Sudanese74 0.3% Jamaican69 0.3% Albanian57 0.2% Trinidadian and Tobagonian54 0.2% Serbian54 0.2% Greek42 0.2% British41 0.1% Canadian36 0.1% Lebanese34 0.1% Iraqi26 0.09% Ukrainian24 0.09% Turkish22 0.08% West Indian18 0.07% Iranian17 0.06% Scottish13 0.05% Eastern European13 0.05% Afghan13 0.05% Bulgarian12 0.04% Norwegian12 0.04% Nigerian12 0.04% Syrian11 0.04% Swiss8 0.03% Russian7 0.03% Scotch-Irish7 0.03% Ugandan5 0.02% Swedish2 0.01% Armenian2 0.01% Kenyan2 0.01% Liberian
Geographical mobility in Chelsea Same house 1 year ago 9,865 81.7% White (Caucasian)1,943 85.8% Black or African American375 89.4% American Indian / Alaska Native859 79.2% Asian4,356 80.6% Other race18,264 86.1% Two or more races6,081 80.1% White alone, not Hispanic / Latino22,499 86.3% Hispanic or LatinoMoved within same county 915 7.6% White / Caucasian88 3.9% Black or African American36 8.5% American Indian / Alaska Native121 11.1% Asian415 7.7% Other race1,158 5.5% Two or more races611 8.0% White alone, not Hispanic / Latino1,157 4.4% Hispanic or LatinoMoved within same state 388 3.2% White / Caucasian152 6.7% Black or African American25 6.0% American Indian / Alaska Native46 4.3% Asian573 10.6% Other race534 2.5% Two or more races283 3.7% White alone, not Hispanic / Latino1,118 4.3% Hispanic or LatinoMoved from different state 558 4.6% White / Caucasian19 0.8% Black or African American35 3.3% Asian121 2.2% Other race179 0.8% Two or more races524 6.9% White alone, not Hispanic / Latino271 1.0% Hispanic or LatinoMoved from abroad 190 1.6% White56 2.5% Black or African American6 0.6% Asian16 0.3% Other race758 3.6% Two or more races68 0.9% White alone, not Hispanic / Latino1,033 4.0% Hispanic or Latino
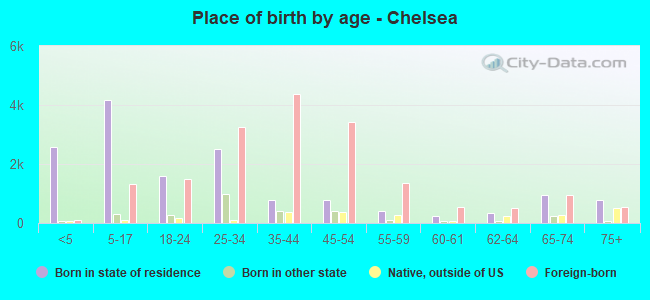
Children Nativity (place of birth) in Chelsea
Children under 6 years - Living with two parents Both parents native 53 85.7% Native9 14.3% Foreign-bornBoth parents foreign-born 1,441 94.1% Native91 5.9% Foreign-bornOne native, one foreign-born parent 107 100.0% NativeChildren under 6 years - Living with one parent Native parent 575 100.0% NativeForeign-born parent 559 84.0% Native106 16.0% Foreign-bornChildren 6 to 17 years - Living with two parents Both parents native 281 100.0% NativeBoth parents foreign-born 1,421 68.6% Native649 31.4% Foreign-bornOne native, one foreign-born parent 120 100.0% NativeChildren 6 to 17 years - Living with one parent Native parent 352 100.0% NativeForeign-born parent 1,845 59.0% Native1,283 41.0% Foreign-born
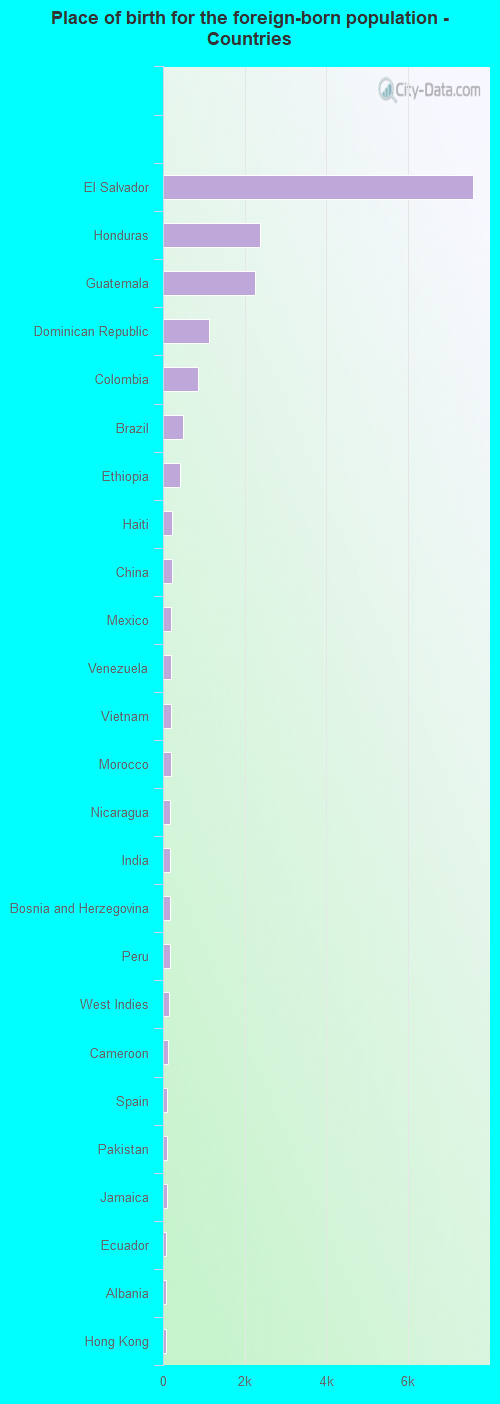
Place of birth for residents in Chelsea 16,399 Americas16,390 Latin America12,945 Central America1,805 South America1,639 Caribbean1,202 Africa976 Asia658 Europe638 Eastern Africa350 Eastern Asia340 Eastern Europe295 China295 South Central Asia253 Northern Africa250 South Eastern Asia238 Southern Europe112 Middle Africa98 Western Africa80 Western Asia41 Western Europe38 Northern Europe11 Southern Africa9 Northern America8 Oceania8 Australia and New Zealand Subregion7,604 El Salvador2,372 Honduras2,250 Guatemala1,132 Dominican Republic853 Colombia501 Brazil408 Ethiopia223 Haiti216 China208 Mexico208 Venezuela204 Vietnam188 Morocco176 Nicaragua174 India166 Bosnia and Herzegovina161 Peru155 West Indies112 Cameroon108 Spain95 Pakistan91 Jamaica81 Ecuador80 Albania79 Hong Kong64 Algeria58 Cabo Verde50 Portugal50 Italy42 Somalia40 Eritrea38 Azores Islands37 Panama32 Costa Rica30 Japan28 Greece27 Poland24 Korea24 Ukraine23 Iraq22 Turkey22 Philippines21 Syria20 Germany20 Ivory Coast20 United Kingdom14 Nigeria13 Bulgaria13 Lithuania13 Thailand12 England12 France12 Iran12 Lebanon11 South Africa10 Cambodia9 Canada8 Switzerland8 Australia8 Serbia7 Uzbekistan6 Scotland6 Afghanistan5 Croatia5 Liberia2 Kenya2 Russia
Grandparents responsible for own grandchildren in Chelsea
Grandparents (30 to 59 years) White / Caucasian 46 31.4% Responsible for grandchildren101 68.6% Not responsible for grandchildrenAmerican Indian / Alaska Native 12 100.0% Not responsible for grandchildrenOther race 23 22.3% Responsible for grandchildren79 77.7% Not responsible for grandchildrenTwo or more races 57 7.8% Responsible for grandchildren671 92.2% Not responsible for grandchildrenWhite alone, not Hispanic / Latino 19 100.0% Not responsible for grandchildrenHispanic or Latino 71 6.5% Responsible for grandchildren1,027 93.5% Not responsible for grandchildrenGrandparents (60 years and over) White / Caucasian 44 100.0% Not responsible for grandchildrenOther race 60 100.0% Not responsible for grandchildrenTwo or more races 32 8.4% Responsible for grandchildren352 91.6% Not responsible for grandchildrenWhite alone, not Hispanic / Latino 9 100.0% Not responsible for grandchildrenHispanic or Latino 24 5.7% Responsible for grandchildren405 94.3% Not responsible for grandchildren