Races in Chenango, New York (NY) Detailed Stats
Ancestries, Foreign-born residents, place of birth
1.8% of Chenango, NY residents are foreign-born , which is 1105.7% less than the foreign-born rate of 22.0% across the entire state of New York.
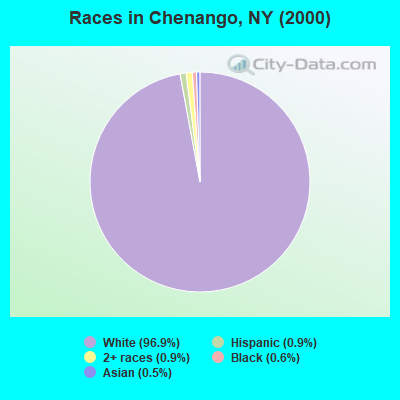
Race distribution in Chenango

- 11,10196.9%White alone
- 1070.9%Hispanic
- 980.9%Two or more races
- 670.6%Black alone
- 610.5%Asian alone
- 90.08%Other race alone
- 90.08%American Indian alone
- 20.02%Native Hawaiian and Other
Pacific Islander alone
2000
2022
-
- 11,760,98162.0%White alone
- 2,867,58315.1%Hispanic
- 2,812,62314.8%Black alone
- 1,035,9265.5%Asian alone
- 366,1161.9%Two or more races
- 75,4990.4%Other race alone
- 52,4990.3%American Indian alone
- 5,2300.03%Native Hawaiian and Other
Pacific Islander alone

-
- 10,408,93352.9%White alone
- 3,867,29919.7%Hispanic
- 2,633,84013.4%Black alone
- 1,776,2869.0%Asian alone
- 732,6703.7%Two or more races
- 216,1101.1%Other race alone
- 35,0820.2%American Indian alone
- 6,9310.04%Native Hawaiian and Other
Pacific Islander alone

Income and house value in Chenango
- Median household income in 2022
- $81,858White non-Hispanic householders
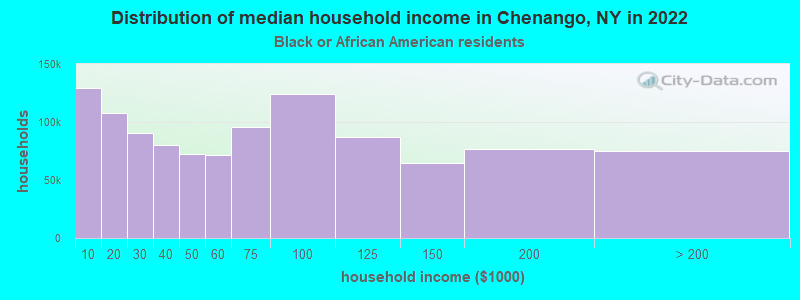
- $97,292Black householders
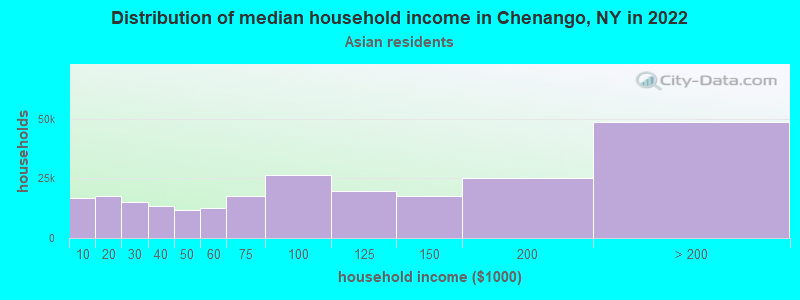
- $84,874Asian householders
- $61,073Two or more races householders
- $102,973Hispanic or Latino race householders
- Median 2022 house value
- $166,830White Non-Hispanic householders
- $150,838Black or African American householders
- $187,560Asian householders
- $173,740Hispanic or Latino householders
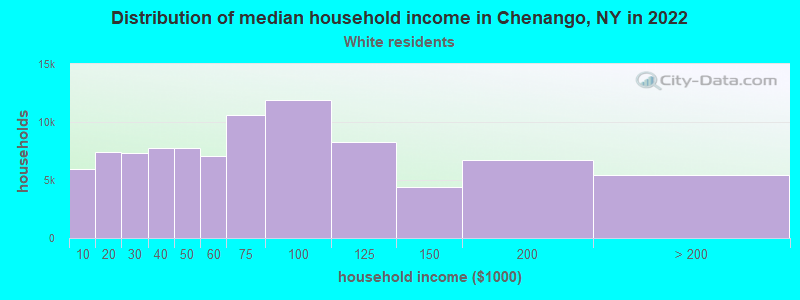
Household income for White non-Hispanic householders
Household income for Black householders
Household income for Asian householders
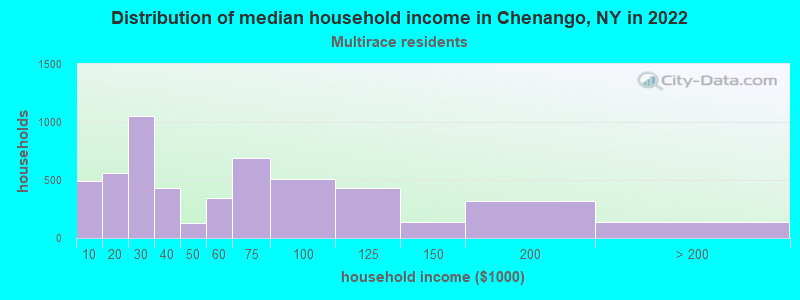
Household income for Two or more races householders
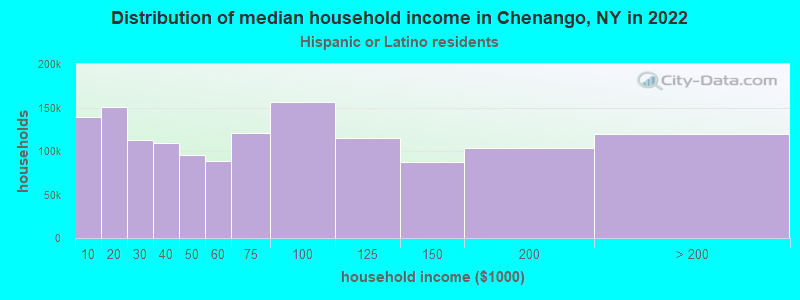
Household income for Hispanic or Latino race householders
Foreign-born residents in Chenango
209 residents are foreign born
| This city: | 1.8% |
| New York: | 20.4% |
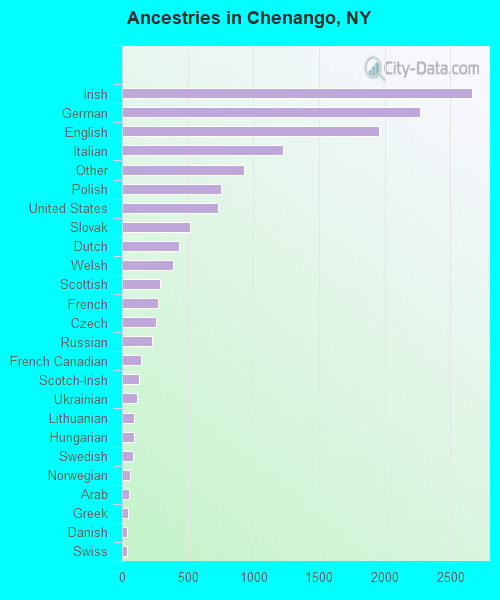
Ancestries in Chenango

- 2,66219.3%Irish
- 2,26716.4%German
- 1,95514.2%English
- 1,2238.9%Italian
- 9316.7%Other
- 7575.5%Polish
- 7305.3%United States
- 5173.7%Slovak
- 4363.2%Dutch
- 3882.8%Welsh
- 2882.1%Scottish
- 2722.0%French
- 2571.9%Czech
- 2301.7%Russian
- 1421.0%French Canadian
- 1300.9%Scotch-Irish
- 1160.8%Ukrainian
- 930.7%Lithuanian
- 900.7%Hungarian
- 840.6%Swedish
- 580.4%Norwegian
- 530.4%Arab
- 450.3%Greek
- 370.3%Danish
- 360.3%Swiss
- 80.06%Subsaharan African
- 60.04%Portuguese
Zip codes: 13901.