Races in Clayton, Missouri (MO) Detailed Stats
Data:
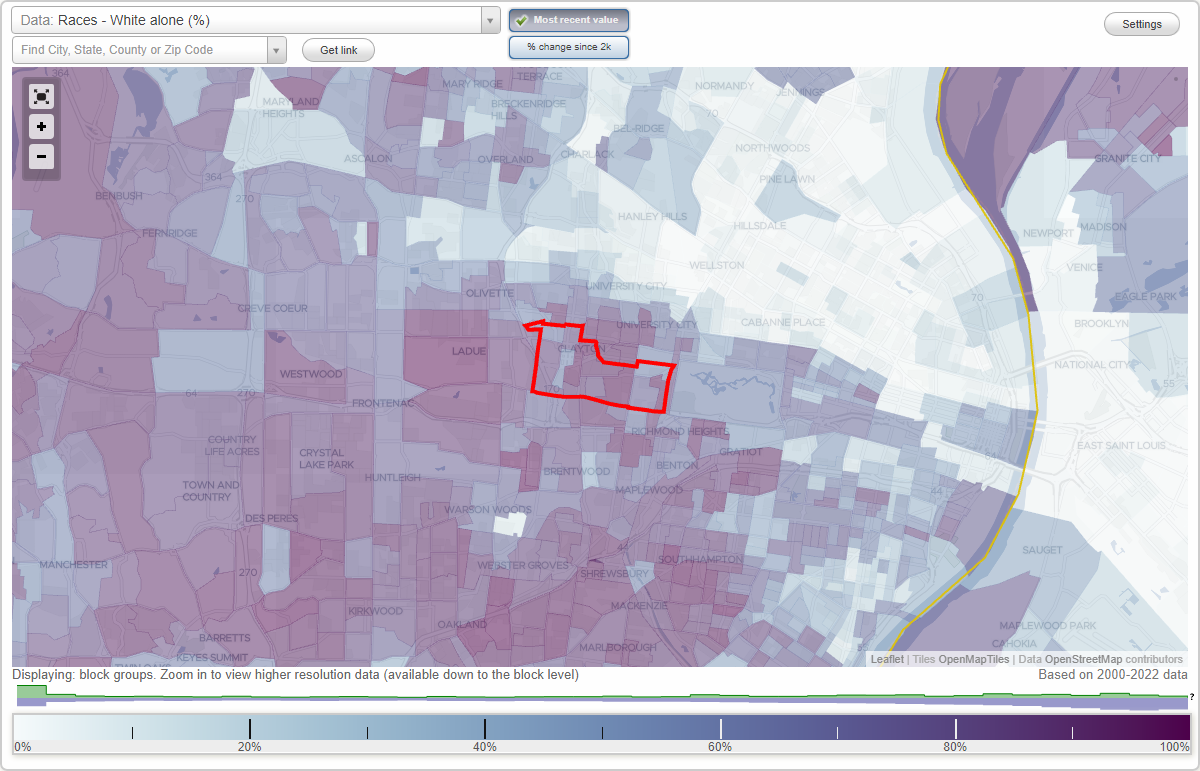
Races - White alone (%)
Races - White alone (% change since 2000)
Races - Black alone (%)
Races - Black alone (% change since 2000)
Races - American Indian alone (%)
Races - American Indian alone (% change since 2000)
Races - Asian alone (%)
Races - Asian alone (% change since 2000)
Races - Hispanic (%)
Races - Hispanic (% change since 2000)
Races - Native Hawaiian and Other Pacific Islander alone (%)
Races - Native Hawaiian and Other Pacific Islander alone (% change since 2000)
Races - Two or more races(%)
Races - Two or more races(% change since 2000)
Races - Other race alone (%)
Races - Other race alone (% change since 2000)
Racial diversity
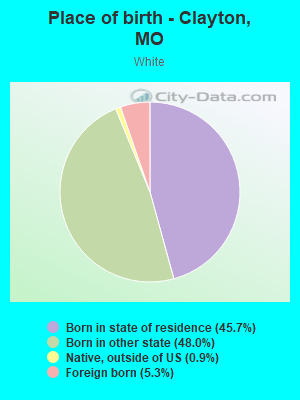
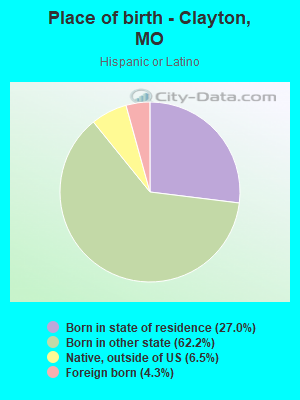
Place of birth - Born in state of residence (%)
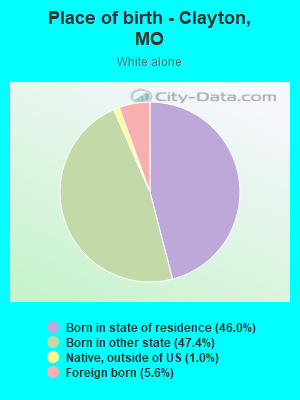
Place of birth - Born in state of residence (%) - White
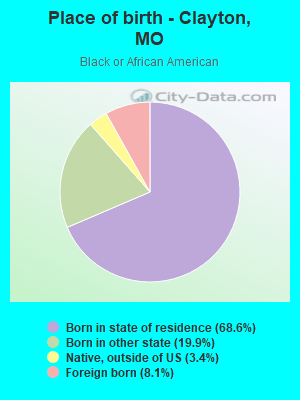
Place of birth - Born in state of residence (%) - Black or African American
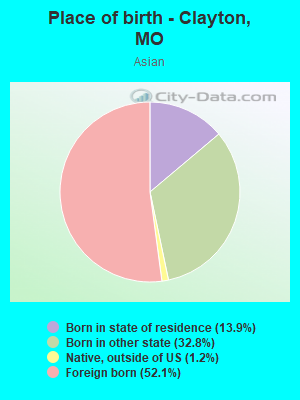
Place of birth - Born in state of residence (%) - Asian
Place of birth - Born in state of residence (%) - Hispanic or Latino
Place of birth - Born in state of residence (%) - American Indian and Alaska Native
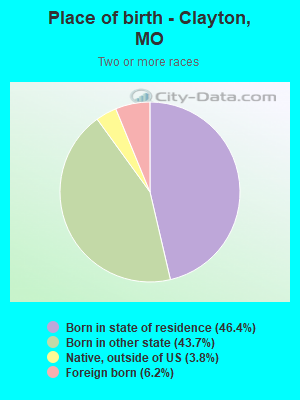
Place of birth - Born in state of residence (%) - Multirace
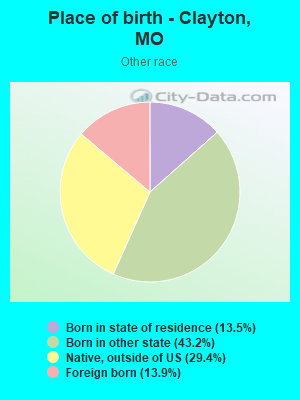
Place of birth - Born in state of residence (%) - Other Race
Place of birth - Born in other state (%)
Place of birth - Born in other state (%) - White
Place of birth - Born in other state (%) - Black or African American
Place of birth - Born in other state (%) - Asian
Place of birth - Born in other state (%) - Hispanic or Latino
Place of birth - Born in other state (%) - American Indian and Alaska Native
Place of birth - Born in other state (%) - Multirace
Place of birth - Born in other state (%) - Other Race
Place of birth - Native, outside of US (%)
Place of birth - Native, outside of US (%) - White
Place of birth - Native, outside of US (%) - Black or African American
Place of birth - Native, outside of US (%) - Asian
Place of birth - Native, outside of US (%) - Hispanic or Latino
Place of birth - Native, outside of US (%) - American Indian and Alaska Native
Place of birth - Native, outside of US (%) - Multirace
Place of birth - Native, outside of US (%) - Other Race
Place of birth - Foreign born (%)
Place of birth - Foreign born (%) - White
Place of birth - Foreign born (%) - Black or African American
Place of birth - Foreign born (%) - Asian
Place of birth - Foreign born (%) - Hispanic or Latino
Place of birth - Foreign born (%) - American Indian and Alaska Native
Place of birth - Foreign born (%) - Multirace
Place of birth - Foreign born (%) - Other Race
Residents speaking English at home (%)
Residents speaking English at home - Born in the United States (%)
Residents speaking English at home - Native, born elsewhere (%)
Residents speaking English at home - Foreign born (%)
Residents speaking Spanish at home (%)
Residents speaking Spanish at home - Born in the United States (%)
Residents speaking Spanish at home - Native, born elsewhere (%)
Residents speaking Spanish at home - Foreign born (%)
Residents speaking other language at home (%)
Residents speaking other language at home - Born in the United States (%)
Residents speaking other language at home - Native, born elsewhere (%)
Residents speaking other language at home - Foreign born (%)
Marital status - Never married (%)
Marital status - Now married (%)
Marital status - Separated (%)
Marital status - Widowed (%)
Marital status - Divorced (%)
Ancestries Reported - Arab (%)
Ancestries Reported - Czech (%)
Ancestries Reported - Danish (%)
Ancestries Reported - Dutch (%)
Ancestries Reported - English (%)
Ancestries Reported - French (%)
Ancestries Reported - French Canadian (%)
Ancestries Reported - German (%)
Ancestries Reported - Greek (%)
Ancestries Reported - Hungarian (%)
Ancestries Reported - Irish (%)
Ancestries Reported - Italian (%)
Ancestries Reported - Lithuanian (%)
Ancestries Reported - Norwegian (%)
Ancestries Reported - Polish (%)
Ancestries Reported - Portuguese (%)
Ancestries Reported - Russian (%)
Ancestries Reported - Scotch-Irish (%)
Ancestries Reported - Scottish (%)
Ancestries Reported - Slovak (%)
Ancestries Reported - Subsaharan African (%)
Ancestries Reported - Swedish (%)
Ancestries Reported - Swiss (%)
Ancestries Reported - Ukrainian (%)
Ancestries Reported - United States (%)
Ancestries Reported - Welsh (%)
Ancestries Reported - West Indian (%)
Ancestries Reported - Other (%)
Geographical mobility - Same house 1 year ago (%)
Geographical mobility - Same house 1 year ago (%) - White
Geographical mobility - Same house 1 year ago (%) - Black or African American
Geographical mobility - Same house 1 year ago (%) - Asian
Geographical mobility - Same house 1 year ago (%) - Hispanic or Latino
Geographical mobility - Same house 1 year ago (%) - American Indian and Alaska Native
Geographical mobility - Same house 1 year ago (%) - Multirace
Geographical mobility - Same house 1 year ago (%) - Other Race
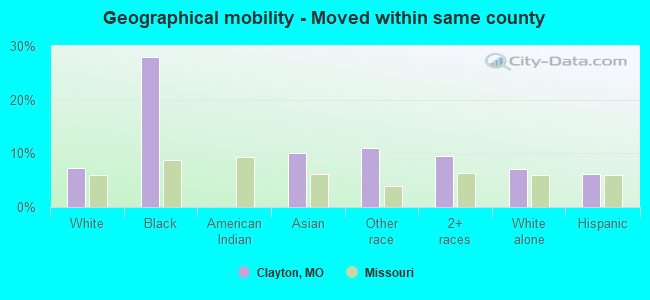
Geographical mobility - Moved within same county (%)
Geographical mobility - Moved within same county (%) - White
Geographical mobility - Moved within same county (%) - Black or African American
Geographical mobility - Moved within same county (%) - Asian
Geographical mobility - Moved within same county (%) - Hispanic or Latino
Geographical mobility - Moved within same county (%) - American Indian and Alaska Native
Geographical mobility - Moved within same county (%) - Multirace
Geographical mobility - Moved within same county (%) - Other Race
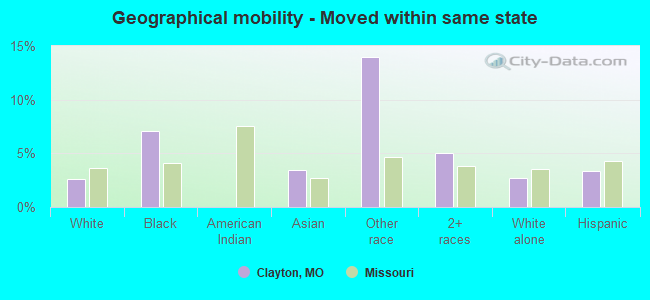
Geographical mobility - Moved from different county within same state (%)
Geographical mobility - Moved from different county within same state (%) - White
Geographical mobility - Moved from different county within same state (%) - Black or African American
Geographical mobility - Moved from different county within same state (%) - Asian
Geographical mobility - Moved from different county within same state (%) - Hispanic or Latino
Geographical mobility - Moved from different county within same state (%) - American Indian and Alaska Native
Geographical mobility - Moved from different county within same state (%) - Multirace
Geographical mobility - Moved from different county within same state (%) - Other Race
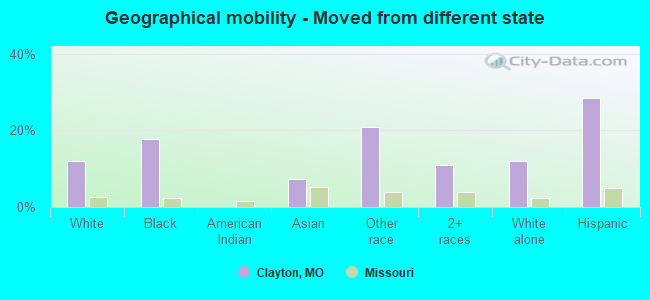
Geographical mobility - Moved from different state (%)
Geographical mobility - Moved from different state (%) - White
Geographical mobility - Moved from different state (%) - Black or African American
Geographical mobility - Moved from different state (%) - Asian
Geographical mobility - Moved from different state (%) - Hispanic or Latino
Geographical mobility - Moved from different state (%) - American Indian and Alaska Native
Geographical mobility - Moved from different state (%) - Multirace
Geographical mobility - Moved from different state (%) - Other Race
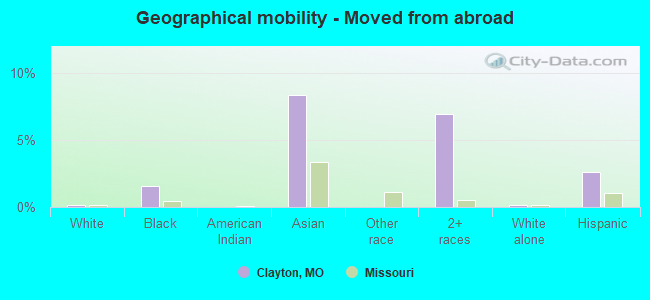
Geographical mobility - Moved from abroad (%)
Geographical mobility - Moved from abroad (%) - White
Geographical mobility - Moved from abroad (%) - Black or African American
Geographical mobility - Moved from abroad (%) - Asian
Geographical mobility - Moved from abroad (%) - Hispanic or Latino
Geographical mobility - Moved from abroad (%) - American Indian and Alaska Native
Geographical mobility - Moved from abroad (%) - Multirace
Geographical mobility - Moved from abroad (%) - Other Race
Place of birth for the foreign-born population - Ireland (%)
Place of birth for the foreign-born population - Denmark (%)
Place of birth for the foreign-born population - Norway (%)
Place of birth for the foreign-born population - Sweden (%)
Place of birth for the foreign-born population - United Kingdom (%)
Place of birth for the foreign-born population - England (%)
Place of birth for the foreign-born population - Scotland (%)
Place of birth for the foreign-born population - Other Northern Europe (%)
Place of birth for the foreign-born population - Austria (%)
Place of birth for the foreign-born population - Belgium (%)
Place of birth for the foreign-born population - France (%)
Place of birth for the foreign-born population - Germany (%)
Place of birth for the foreign-born population - Netherlands (%)
Place of birth for the foreign-born population - Switzerland (%)
Place of birth for the foreign-born population - Other Western Europe (%)
Place of birth for the foreign-born population - Greece (%)
Place of birth for the foreign-born population - Italy (%)
Place of birth for the foreign-born population - Portugal (%)
Place of birth for the foreign-born population - Spain (%)
Place of birth for the foreign-born population - Other Southern Europe (%)
Place of birth for the foreign-born population - Albania (%)
Place of birth for the foreign-born population - Belarus (%)
Place of birth for the foreign-born population - Bosnia and Herzegovina (%)
Place of birth for the foreign-born population - Bulgaria (%)
Place of birth for the foreign-born population - Croatia (%)
Place of birth for the foreign-born population - Czechoslovakia (%)
Place of birth for the foreign-born population - Hungary (%)
Place of birth for the foreign-born population - Latvia (%)
Place of birth for the foreign-born population - Lithuania (%)
Place of birth for the foreign-born population - North Macedonia (Macedonia) (%)
Place of birth for the foreign-born population - Moldova (%)
Place of birth for the foreign-born population - Poland (%)
Place of birth for the foreign-born population - Romania (%)
Place of birth for the foreign-born population - Russia (%)
Place of birth for the foreign-born population - Serbia (%)
Place of birth for the foreign-born population - Ukraine (%)
Place of birth for the foreign-born population - Other Eastern Europe (%)
Place of birth for the foreign-born population - China (%)
Place of birth for the foreign-born population - Hong Kong (%)
Place of birth for the foreign-born population - Taiwan (%)
Place of birth for the foreign-born population - Japan (%)
Place of birth for the foreign-born population - Korea (%)
Place of birth for the foreign-born population - Other Eastern Asia (%)
Place of birth for the foreign-born population - Afghanistan (%)
Place of birth for the foreign-born population - Bangladesh (%)
Place of birth for the foreign-born population - India (%)
Place of birth for the foreign-born population - Iran (%)
Place of birth for the foreign-born population - Kazakhstan (%)
Place of birth for the foreign-born population - Nepal (%)
Place of birth for the foreign-born population - Pakistan (%)
Place of birth for the foreign-born population - Sri Lanka (%)
Place of birth for the foreign-born population - Uzbekistan (%)
Place of birth for the foreign-born population - Other South Central Asia (%)
Place of birth for the foreign-born population - Burma (%)
Place of birth for the foreign-born population - Cambodia (%)
Place of birth for the foreign-born population - Indonesia (%)
Place of birth for the foreign-born population - Laos (%)
Place of birth for the foreign-born population - Malaysia (%)
Place of birth for the foreign-born population - Philippines (%)
Place of birth for the foreign-born population - Singapore (%)
Place of birth for the foreign-born population - Thailand (%)
Place of birth for the foreign-born population - Vietnam (%)
Place of birth for the foreign-born population - Other South Eastern Asia (%)
Place of birth for the foreign-born population - Armenia (%)
Place of birth for the foreign-born population - Iraq (%)
Place of birth for the foreign-born population - Israel (%)
Place of birth for the foreign-born population - Jordan (%)
Place of birth for the foreign-born population - Kuwait (%)
Place of birth for the foreign-born population - Lebanon (%)
Place of birth for the foreign-born population - Saudi Arabia (%)
Place of birth for the foreign-born population - Syria (%)
Place of birth for the foreign-born population - Turkey (%)
Place of birth for the foreign-born population - Yemen (%)
Place of birth for the foreign-born population - Other Western Asia (%)
Place of birth for the foreign-born population - Eritrea (%)
Place of birth for the foreign-born population - Ethiopia (%)
Place of birth for the foreign-born population - Kenya (%)
Place of birth for the foreign-born population - Somalia (%)
Place of birth for the foreign-born population - Uganda (%)
Place of birth for the foreign-born population - Zimbabwe (%)
Place of birth for the foreign-born population - Other Eastern Africa (%)
Place of birth for the foreign-born population - Cameroon (%)
Place of birth for the foreign-born population - Congo (%)
Place of birth for the foreign-born population - Democratic Republic of Congo (Zaire) (%)
Place of birth for the foreign-born population - Other Middle Africa (%)
Place of birth for the foreign-born population - Egypt (%)
Place of birth for the foreign-born population - Morocco (%)
Place of birth for the foreign-born population - Sudan (%)
Place of birth for the foreign-born population - Other Northern Africa (%)
Place of birth for the foreign-born population - South Africa (%)
Place of birth for the foreign-born population - Other Southern Africa (%)
Place of birth for the foreign-born population - Cabo Verde (%)
Place of birth for the foreign-born population - Ghana (%)
Place of birth for the foreign-born population - Liberia (%)
Place of birth for the foreign-born population - Nigeria (%)
Place of birth for the foreign-born population - Senegal (%)
Place of birth for the foreign-born population - Sierra Leone (%)
Place of birth for the foreign-born population - Other Western Africa (%)
Place of birth for the foreign-born population - Australia (%)
Place of birth for the foreign-born population - New Zealand (%)
Place of birth for the foreign-born population - Fiji (%)
Place of birth for the foreign-born population - Micronesia (%)
Place of birth for the foreign-born population - Bahamas (%)
Place of birth for the foreign-born population - Barbados (%)
Place of birth for the foreign-born population - Cuba (%)
Place of birth for the foreign-born population - Dominica (%)
Place of birth for the foreign-born population - Dominican Republic (%)
Place of birth for the foreign-born population - Grenada (%)
Place of birth for the foreign-born population - Haiti (%)
Place of birth for the foreign-born population - Jamaica (%)
Place of birth for the foreign-born population - St. Vincent and the Grenadines (%)
Place of birth for the foreign-born population - Trinidad and Tobago (%)
Place of birth for the foreign-born population - West Indies (%)
Place of birth for the foreign-born population - Other Caribbean (%)
Place of birth for the foreign-born population - Belize (%)
Place of birth for the foreign-born population - Costa Rica (%)
Place of birth for the foreign-born population - El Salvador (%)
Place of birth for the foreign-born population - Guatemala (%)
Place of birth for the foreign-born population - Honduras (%)
Place of birth for the foreign-born population - Mexico (%)
Place of birth for the foreign-born population - Nicaragua (%)
Place of birth for the foreign-born population - Panama (%)
Place of birth for the foreign-born population - Other Central America (%)
Place of birth for the foreign-born population - Argentina (%)
Place of birth for the foreign-born population - Bolivia (%)
Place of birth for the foreign-born population - Brazil (%)
Place of birth for the foreign-born population - Chile (%)
Place of birth for the foreign-born population - Colombia (%)
Place of birth for the foreign-born population - Ecuador (%)
Place of birth for the foreign-born population - Guyana (%)
Place of birth for the foreign-born population - Peru (%)
Place of birth for the foreign-born population - Uruguay (%)
Place of birth for the foreign-born population - Venezuela (%)
Place of birth for the foreign-born population - Other South America (%)
Place of birth for the foreign-born population - Canada (%)
Place of birth for the foreign-born population - Other Northern America (%)
Place of birth for the foreign-born population - Other (%)
Latest news about races in Clayton, MO collected exclusively by city-data.com from local newspapers, TV, and radio stations
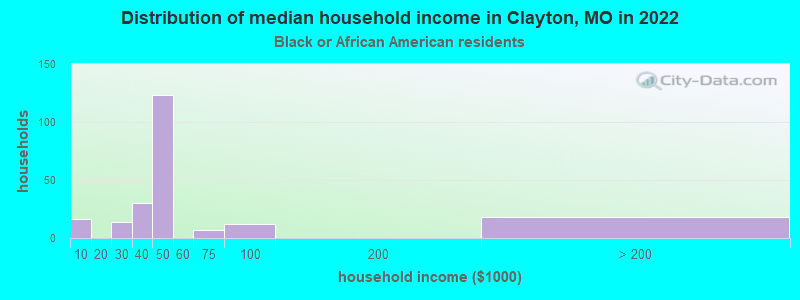
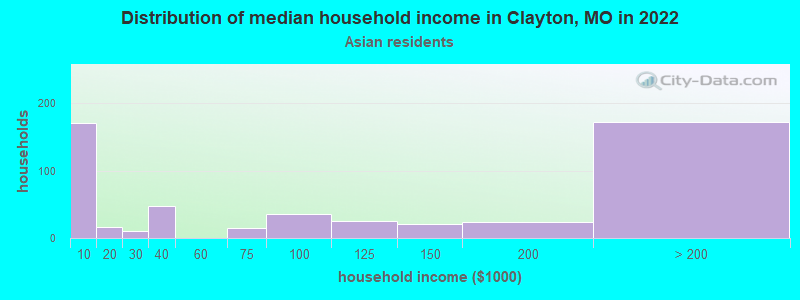
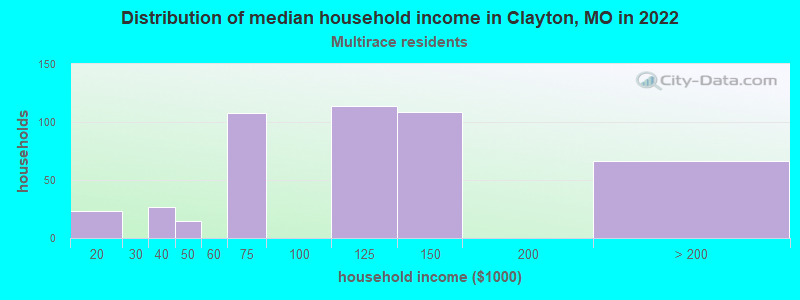
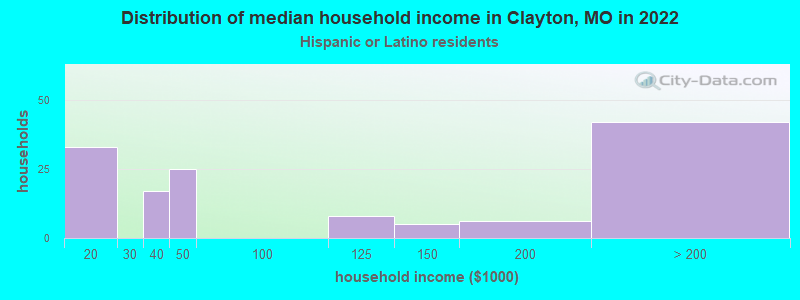
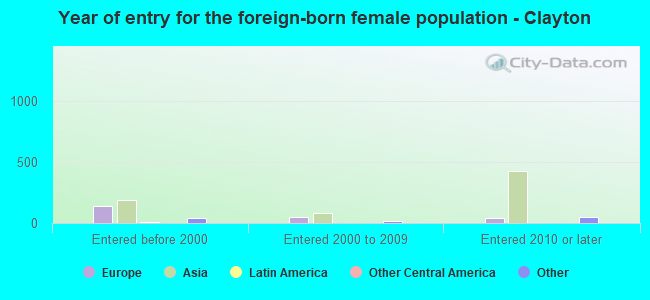
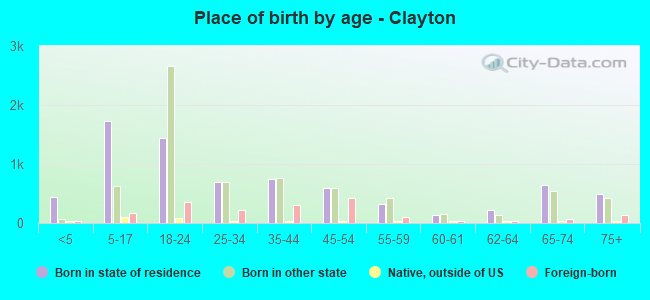
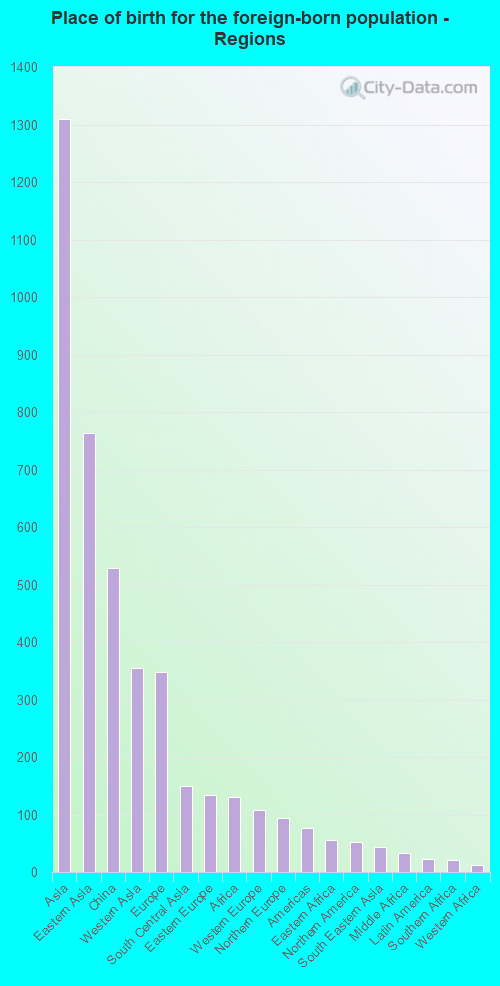
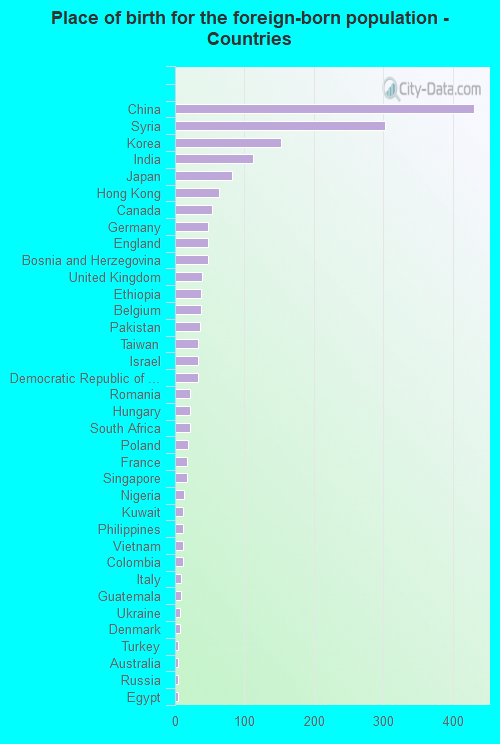
According to 2022 data, the most numerous races in Clayton, MO are White alone (11,781 residents), Black alone (1,426 residents), and Two or more races (1,449 residents). 85.3% of Clayton residents speak English at home. 11.0% of Clayton, MO residents are foreign-born (7.8% born in Asia, 2.1% born in Europe), which is 63.5% greater than the foreign-born rate of 4.0% across the entire state of Missouri.
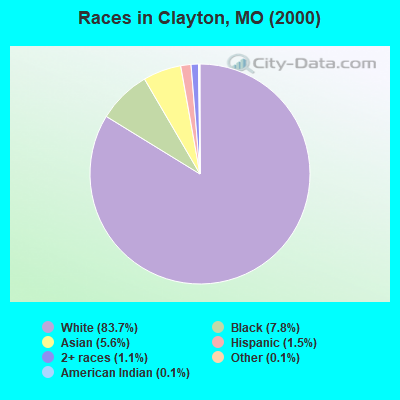
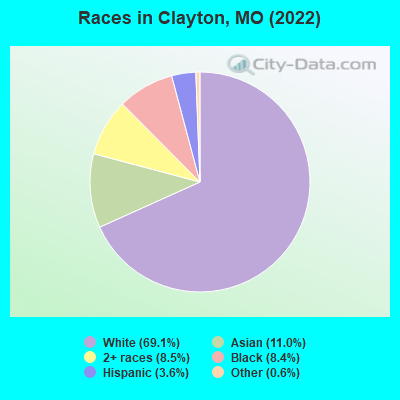
Race distribution in Clayton
2000 2022
4,686,474 83.8% White alone 625,667 11.2% Black alone 118,592 2.1% Hispanic 71,905 1.3% Two or more races 61,041 1.1% Asian alone 23,302 0.4% American Indian alone 5,291 0.09% Other race alone 2,939 0.05% Native Hawaiian and Other
4,733,411 76.6% White alone 656,739 10.6% Black alone 316,300 5.1% Two or more races 291,763 4.7% Hispanic 132,436 2.1% Asian alone 27,467 0.4% Other race alone 12,313 0.2% American Indian alone 7,528 0.1% Native Hawaiian and Other
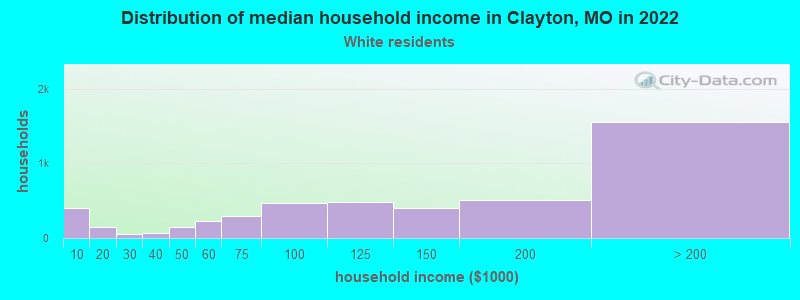
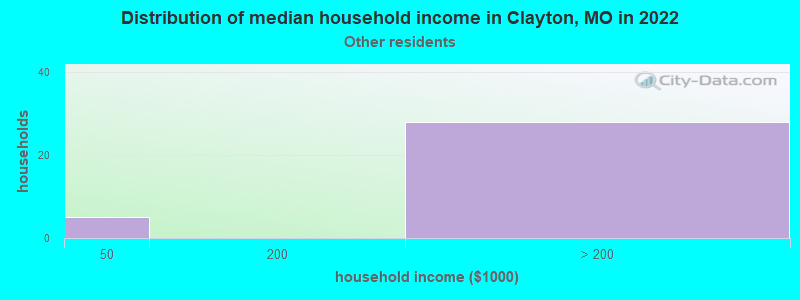
Income and house value in Clayton Median household income in 2022 $133,960 White non-Hispanic householders$45,903 Black householders$99,973 Asian householders$112,892 Two or more races householdersMedian 2022 house value $936,851 White Non-Hispanic householders$768,091 Black or African American householders$142,645 American Indian or Alaska Native householders $963,186 Asian householders$310,967 Hispanic or Latino householders
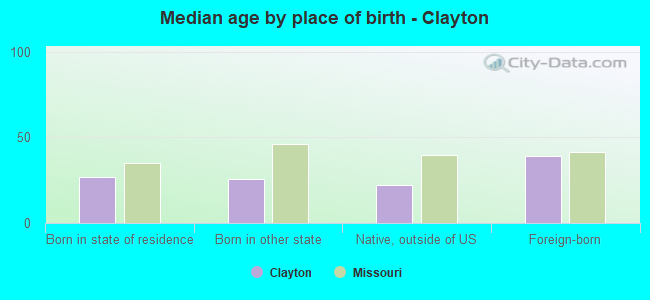
Median age by race in Clayton
32.9 Median age for White residents32.6 34.3 23.4 Median age for Black or African American residents23.9 23.2 15.8 Median age for American Indian / Alaska Native residents-644,003,776.5 -505,494,505.0 22.0 Median age for Asian residents20.9 24.6 -710,303,029.6 Median age for Native Hawaiian / Pacific Islander residents-1,449,781,657.9 -752,136,751.4 18.3 Median age for Other race residents31.4 18.1 19.5 Median age for Two or more races residents20.4 18.5 34.6 Median age for White alone residents33.8 35.5 19.7 Median age for Hispanic or Latino residents19.1 19.9
Owner/renter occupied households by race in Clayton
House owners and renters - White residents 2,754 58.6% Owner occupied1,942 41.4% Renter occupiedHouse owners and renters - Black or African American residents 18 7.9% Owner occupied214 92.1% Renter occupiedHouse owners and renters - Asian residents 240 50.3% Owner occupied237 49.7% Renter occupiedHouse owners and renters - Other race residents 25 100.0% Renter occupiedHouse owners and renters - Two or more races residents 144 32.5% Owner occupied299 67.5% Renter occupiedHouse owners and renters - White alone residents 2,739 58.7% Owner occupied1,929 41.3% Renter occupiedHouse owners and renters - Hispanic or Latino residents 51 43.4% Owner occupied67 56.6% Renter occupied
Language usage in Clayton
English speakers - Total 85.3% of residents of Clayton speak English at home.
1.6% of residents speak Spanish at home 168 63.9% Speak English very well95 36.1% Speak English less than very well13.2% of residents speak other language at home 1,548 71.0% Speak English very well631 29.0% Speak English less than very well
English speakers - Born in the United States 91.3% of residents of Clayton speak English at home.
2.3% of residents speak Spanish at home 113 67.7% Speak English very well54 32.3% Speak English less than very well7.1% of residents speak other language at home 496 96.9% Speak English very well16 3.1% Speak English less than very well
English speakers - Native, born elsewhere 65.2% of residents of Clayton speak English at home.
12.4% of residents speak Spanish at home 11 30.6% Speak English very well25 69.4% Speak English less than very well32.8% of residents speak other language at home 95 100.0% Speak English very well
English speakers - Foreign-born 24.3% of residents of Clayton speak English at home.
74.4% of residents speak other language at home 831 59.3% Speak English very well570 40.7% Speak English less than very well
White (Caucasian) - Speak only English Native:
96.9% (10,597)Foreign-born:
20.5% (131)
White (Caucasian) - Speak another language Native:
3.1% (338)Foreign-born:
79.9% (509)
Black or African American - Speak only English Native:
94.5% (1,257)Foreign-born:
83.4% (95)
Black or African American - Speak another language Native:
7.9% (106)Foreign-born:
29.0% (33)
Asian - Speak only English Native:
60.9% (617)Foreign-born:
19.4% (188)
Asian - Speak another language Native:
40.4% (409)Foreign-born:
81.5% (790)
Other race - Speak only English Native:
100.0% (131)Foreign-born:
100.0% (22)
Two or more races - Speak only English Native:
87.3% (1,398)Foreign-born:
25.4% (27)
Two or more races - Speak another language Native:
13.7% (219)Foreign-born:
63.0% (68)
White alone - Speak only English Native:
97.3% (10,423)Foreign-born:
20.4% (134)
White alone - Speak another language Native:
2.8% (295)Foreign-born:
80.2% (526)
Hispanic or Latino - Speak only English Native:
76.7% (399)Foreign-born:
85.0% (21)
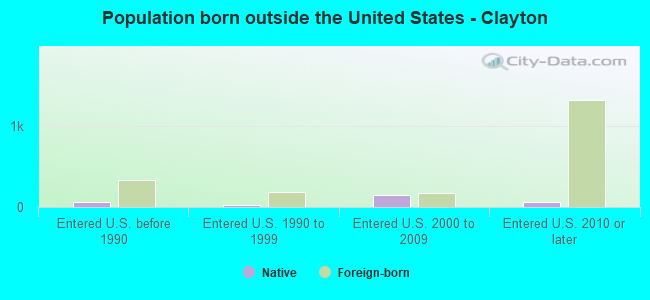
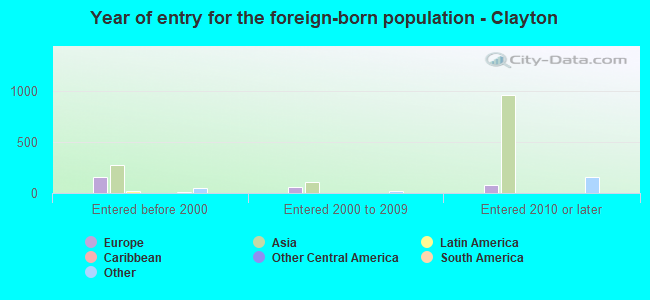
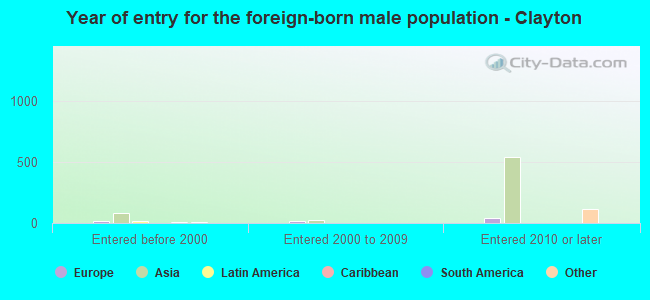
Foreign-born residents in Clayton 1,870 residents are foreign born (7.8% Asia , 2.1% Europe ).
This city:
11.0%Missouri:
4.2%
Marital status for residents in Clayton Marital status - White (Caucasian) population 15 years and over
Males 46.4% Never married48.0% Now married0.0% Separated1.6% Widowed4.0% DivorcedFemales 41.6% Never married40.3% Now married0.8% Separated7.0% Widowed10.3% DivorcedWomen who gave birth in the past 12 months Now married:
100.0% (74)Unmarried:
0.0% (0)
Women who did not give birth in the past 12 months Now married:
27.1% (839)Unmarried:
72.9% (2,256)
Marital status - Black or African American population 15 years and over
Males 88.2% Never married10.7% Now married0.5% Separated0.0% Widowed0.6% DivorcedFemales 84.2% Never married8.6% Now married1.7% Separated0.0% Widowed5.6% DivorcedWomen who did not give birth in the past 12 months Now married:
8.1% (37)Unmarried:
91.9% (426)
Marital status - American Indian / Alaska Native population 15 years and over
Males 100.0% Never married0.0% Now married0.0% Separated0.0% Widowed0.0% DivorcedFemales 100.0% Never married0.0% Now married0.0% Separated0.0% Widowed0.0% DivorcedWomen who did not give birth in the past 12 months Now married:
0.0% (0)Unmarried:
100.0% (6)
Marital status - Asian population 15 years and over
Males 73.9% Never married20.1% Now married0.0% Separated0.0% Widowed6.0% DivorcedFemales 58.2% Never married35.0% Now married0.0% Separated1.5% Widowed5.3% DivorcedWomen who gave birth in the past 12 months Now married:
100.0% (26)Unmarried:
0.0% (0)
Women who did not give birth in the past 12 months Now married:
26.1% (228)Unmarried:
73.9% (643)
Marital status - Other race population 15 years and over
Males 48.7% Never married51.3% Now married0.0% Separated0.0% Widowed0.0% DivorcedFemales 52.4% Never married36.9% Now married0.0% Separated0.0% Widowed10.7% DivorcedWomen who did not give birth in the past 12 months Now married:
36.9% (33)Unmarried:
63.1% (57)
Marital status - Two or more races population 15 years and over
Males 64.2% Never married35.8% Now married0.0% Separated0.0% Widowed0.0% DivorcedFemales 78.4% Never married12.4% Now married0.0% Separated4.3% Widowed4.9% DivorcedWomen who did not give birth in the past 12 months Now married:
12.2% (91)Unmarried:
87.8% (651)
Marital status - White alone, not Hispanic / Latino population 15 years and over
Males 45.3% Never married49.0% Now married0.0% Separated1.6% Widowed4.2% DivorcedFemales 40.6% Never married40.8% Now married0.9% Separated7.2% Widowed10.5% DivorcedWomen who gave birth in the past 12 months Now married:
100.0% (75)Unmarried:
0.0% (0)
Women who did not give birth in the past 12 months Now married:
27.6% (829)Unmarried:
72.4% (2,177)
Marital status - Hispanic or Latino population 15 years and over
Males 75.9% Never married24.1% Now married0.0% Separated0.0% Widowed0.0% DivorcedFemales 75.6% Never married19.9% Now married0.0% Separated0.0% Widowed4.5% DivorcedWomen who did not give birth in the past 12 months Now married:
16.1% (33)Unmarried:
83.9% (173)
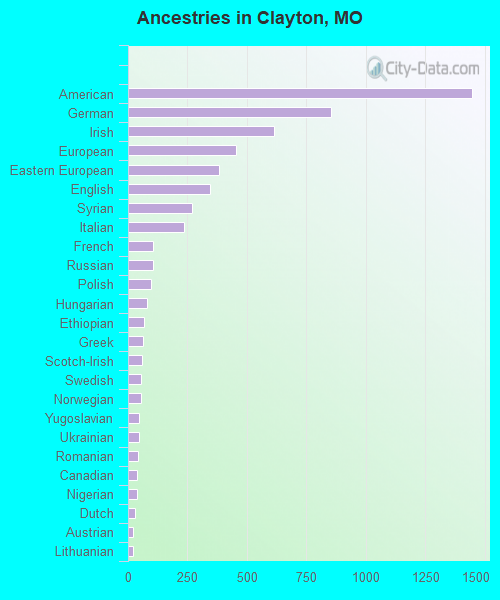
Ancestries in Clayton
1,445 15.6% American853 9.2% German612 6.6% Irish455 4.9% European382 4.1% Eastern European344 3.7% English271 2.9% Syrian236 2.6% Italian107 1.2% French106 1.1% Russian97 1.0% Polish78 0.8% Hungarian67 0.7% Ethiopian61 0.7% Greek57 0.6% Scotch-Irish55 0.6% Swedish55 0.6% Norwegian48 0.5% Yugoslavian46 0.5% Ukrainian43 0.5% Romanian39 0.4% Canadian37 0.4% Nigerian30 0.3% Dutch22 0.2% Austrian21 0.2% Lithuanian19 0.2% Scottish17 0.2% Jamaican16 0.2% Slovene14 0.2% Czech12 0.1% Northern European12 0.1% French Canadian11 0.1% Lebanese10 0.1% Slovak10 0.1% Sudanese10 0.1% British9 0.10% Slavic8 0.09% Macedonian3 0.03% Croatian3 0.03% Albanian2 0.02% Egyptian2 0.02% Scandinavian
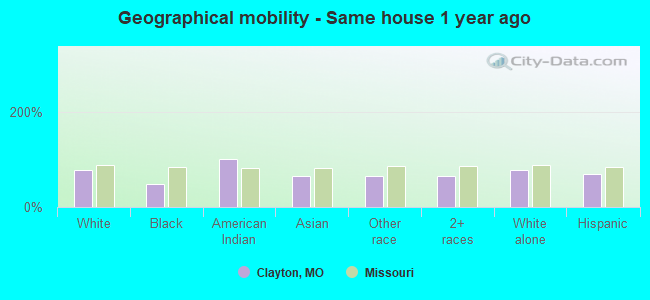
Geographical mobility in Clayton Same house 1 year ago 9,321 78.1% White (Caucasian)709 49.4% Black or African American10 100.0% American Indian / Alaska Native1,199 63.6% Asian98 64.0% Other race1,152 65.6% Two or more races9,145 78.1% White alone, not Hispanic / Latino422 69.3% Hispanic or LatinoMoved within same county 862 7.2% White / Caucasian400 27.9% Black or African American188 10.0% Asian17 10.9% Other race167 9.5% Two or more races838 7.2% White alone, not Hispanic / Latino38 6.2% Hispanic or LatinoMoved within same state 316 2.6% White / Caucasian101 7.1% Black or African American65 3.5% Asian21 14.0% Other race89 5.0% Two or more races312 2.7% White alone, not Hispanic / Latino21 3.4% Hispanic or LatinoMoved from different state 1,439 12.1% White / Caucasian256 17.8% Black or African American138 7.3% Asian32 20.9% Other race191 10.8% Two or more races1,399 11.9% White alone, not Hispanic / Latino174 28.5% Hispanic or LatinoMoved from abroad 16 0.1% White22 1.6% Black or African American158 8.4% Asian121 6.9% Two or more races17 0.1% White alone, not Hispanic / Latino16 2.6% Hispanic or Latino
Children Nativity (place of birth) in Clayton
Children under 6 years - Living with two parents Both parents native 471 99.1% Native4 0.9% Foreign-bornBoth parents foreign-born 38 80.2% Native9 19.8% Foreign-bornOne native, one foreign-born parent 30 100.0% NativeChildren under 6 years - Living with one parent Native parent 153 100.0% NativeForeign-born parent 27 100.0% NativeChildren 6 to 17 years - Living with two parents Both parents native 1,170 100.0% NativeBoth parents foreign-born 62 33.1% Native125 66.9% Foreign-bornOne native, one foreign-born parent 130 65.3% Native69 34.7% Foreign-bornChildren 6 to 17 years - Living with one parent Native parent 496 100.0% NativeForeign-born parent 226 48.6% Native239 51.4% Foreign-born