Races in Clive, Iowa (IA) Detailed Stats
Data:
Races - White alone (%)
Races - White alone (% change since 2000)
Races - Black alone (%)
Races - Black alone (% change since 2000)
Races - American Indian alone (%)
Races - American Indian alone (% change since 2000)
Races - Asian alone (%)
Races - Asian alone (% change since 2000)
Races - Hispanic (%)
Races - Hispanic (% change since 2000)
Races - Native Hawaiian and Other Pacific Islander alone (%)
Races - Native Hawaiian and Other Pacific Islander alone (% change since 2000)
Races - Two or more races(%)
Races - Two or more races(% change since 2000)
Races - Other race alone (%)
Races - Other race alone (% change since 2000)
Racial diversity
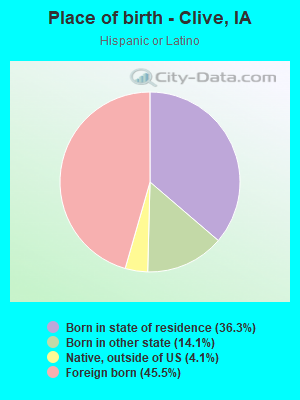
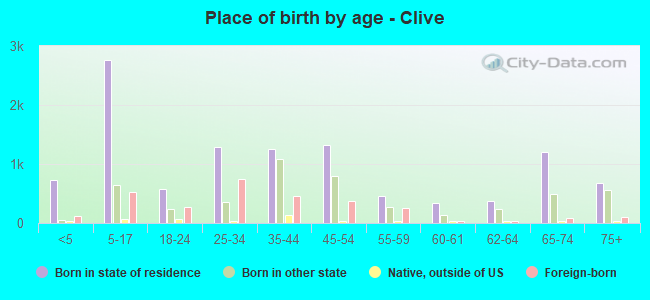
Place of birth - Born in state of residence (%)
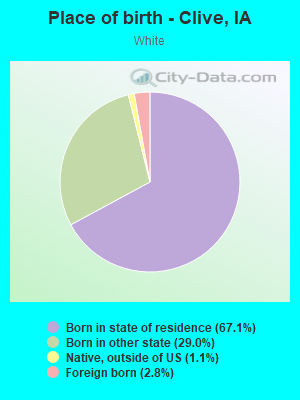
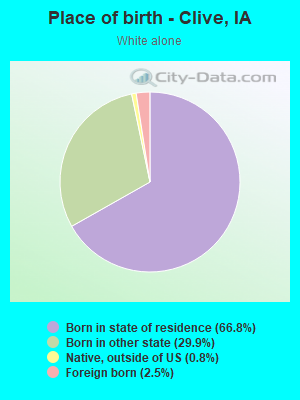
Place of birth - Born in state of residence (%) - White
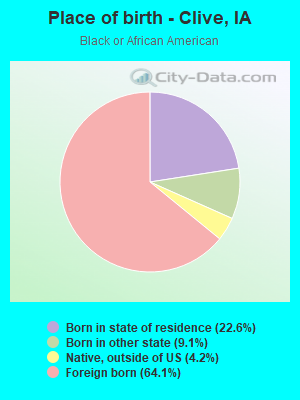
Place of birth - Born in state of residence (%) - Black or African American
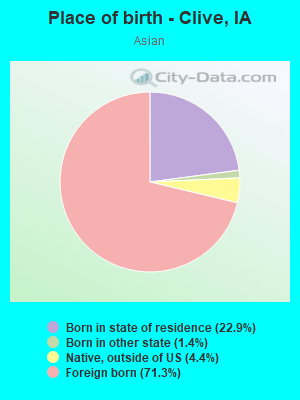
Place of birth - Born in state of residence (%) - Asian
Place of birth - Born in state of residence (%) - Hispanic or Latino
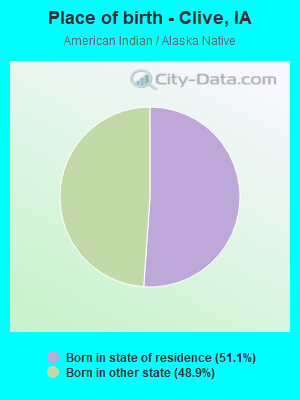
Place of birth - Born in state of residence (%) - American Indian and Alaska Native
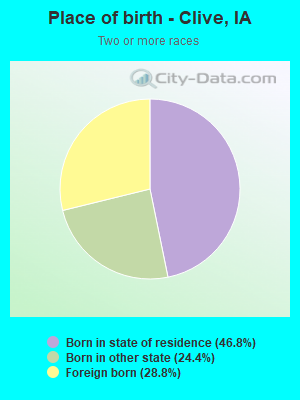
Place of birth - Born in state of residence (%) - Multirace
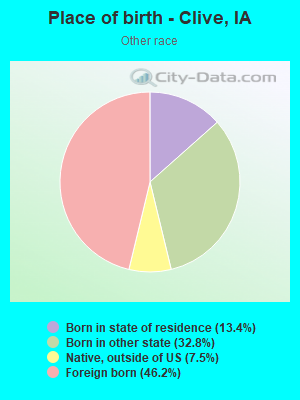
Place of birth - Born in state of residence (%) - Other Race
Place of birth - Born in other state (%)
Place of birth - Born in other state (%) - White
Place of birth - Born in other state (%) - Black or African American
Place of birth - Born in other state (%) - Asian
Place of birth - Born in other state (%) - Hispanic or Latino
Place of birth - Born in other state (%) - American Indian and Alaska Native
Place of birth - Born in other state (%) - Multirace
Place of birth - Born in other state (%) - Other Race
Place of birth - Native, outside of US (%)
Place of birth - Native, outside of US (%) - White
Place of birth - Native, outside of US (%) - Black or African American
Place of birth - Native, outside of US (%) - Asian
Place of birth - Native, outside of US (%) - Hispanic or Latino
Place of birth - Native, outside of US (%) - American Indian and Alaska Native
Place of birth - Native, outside of US (%) - Multirace
Place of birth - Native, outside of US (%) - Other Race
Place of birth - Foreign born (%)
Place of birth - Foreign born (%) - White
Place of birth - Foreign born (%) - Black or African American
Place of birth - Foreign born (%) - Asian
Place of birth - Foreign born (%) - Hispanic or Latino
Place of birth - Foreign born (%) - American Indian and Alaska Native
Place of birth - Foreign born (%) - Multirace
Place of birth - Foreign born (%) - Other Race
Residents speaking English at home (%)
Residents speaking English at home - Born in the United States (%)
Residents speaking English at home - Native, born elsewhere (%)
Residents speaking English at home - Foreign born (%)
Residents speaking Spanish at home (%)
Residents speaking Spanish at home - Born in the United States (%)
Residents speaking Spanish at home - Native, born elsewhere (%)
Residents speaking Spanish at home - Foreign born (%)
Residents speaking other language at home (%)
Residents speaking other language at home - Born in the United States (%)
Residents speaking other language at home - Native, born elsewhere (%)
Residents speaking other language at home - Foreign born (%)
Marital status - Never married (%)
Marital status - Now married (%)
Marital status - Separated (%)
Marital status - Widowed (%)
Marital status - Divorced (%)
Ancestries Reported - Arab (%)
Ancestries Reported - Czech (%)
Ancestries Reported - Danish (%)
Ancestries Reported - Dutch (%)
Ancestries Reported - English (%)
Ancestries Reported - French (%)
Ancestries Reported - French Canadian (%)
Ancestries Reported - German (%)
Ancestries Reported - Greek (%)
Ancestries Reported - Hungarian (%)
Ancestries Reported - Irish (%)
Ancestries Reported - Italian (%)
Ancestries Reported - Lithuanian (%)
Ancestries Reported - Norwegian (%)
Ancestries Reported - Polish (%)
Ancestries Reported - Portuguese (%)
Ancestries Reported - Russian (%)
Ancestries Reported - Scotch-Irish (%)
Ancestries Reported - Scottish (%)
Ancestries Reported - Slovak (%)
Ancestries Reported - Subsaharan African (%)
Ancestries Reported - Swedish (%)
Ancestries Reported - Swiss (%)
Ancestries Reported - Ukrainian (%)
Ancestries Reported - United States (%)
Ancestries Reported - Welsh (%)
Ancestries Reported - West Indian (%)
Ancestries Reported - Other (%)
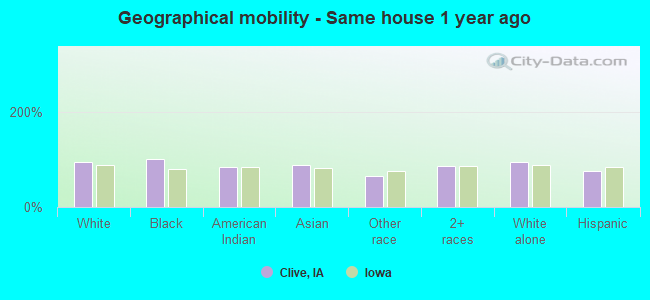
Geographical mobility - Same house 1 year ago (%)
Geographical mobility - Same house 1 year ago (%) - White
Geographical mobility - Same house 1 year ago (%) - Black or African American
Geographical mobility - Same house 1 year ago (%) - Asian
Geographical mobility - Same house 1 year ago (%) - Hispanic or Latino
Geographical mobility - Same house 1 year ago (%) - American Indian and Alaska Native
Geographical mobility - Same house 1 year ago (%) - Multirace
Geographical mobility - Same house 1 year ago (%) - Other Race
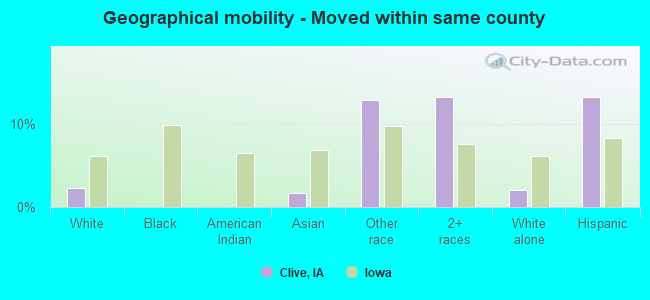
Geographical mobility - Moved within same county (%)
Geographical mobility - Moved within same county (%) - White
Geographical mobility - Moved within same county (%) - Black or African American
Geographical mobility - Moved within same county (%) - Asian
Geographical mobility - Moved within same county (%) - Hispanic or Latino
Geographical mobility - Moved within same county (%) - American Indian and Alaska Native
Geographical mobility - Moved within same county (%) - Multirace
Geographical mobility - Moved within same county (%) - Other Race
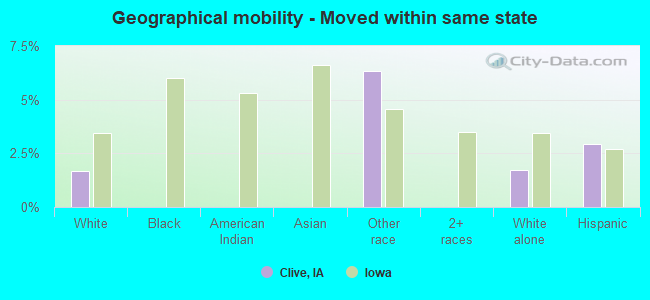
Geographical mobility - Moved from different county within same state (%)
Geographical mobility - Moved from different county within same state (%) - White
Geographical mobility - Moved from different county within same state (%) - Black or African American
Geographical mobility - Moved from different county within same state (%) - Asian
Geographical mobility - Moved from different county within same state (%) - Hispanic or Latino
Geographical mobility - Moved from different county within same state (%) - American Indian and Alaska Native
Geographical mobility - Moved from different county within same state (%) - Multirace
Geographical mobility - Moved from different county within same state (%) - Other Race
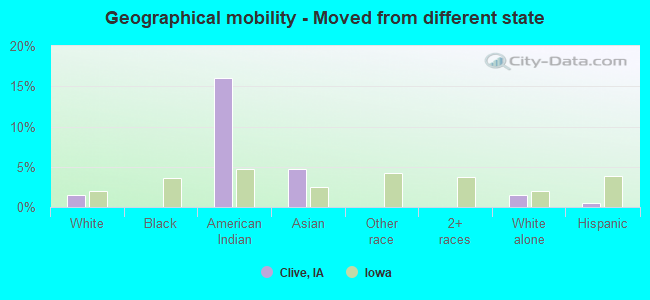
Geographical mobility - Moved from different state (%)
Geographical mobility - Moved from different state (%) - White
Geographical mobility - Moved from different state (%) - Black or African American
Geographical mobility - Moved from different state (%) - Asian
Geographical mobility - Moved from different state (%) - Hispanic or Latino
Geographical mobility - Moved from different state (%) - American Indian and Alaska Native
Geographical mobility - Moved from different state (%) - Multirace
Geographical mobility - Moved from different state (%) - Other Race
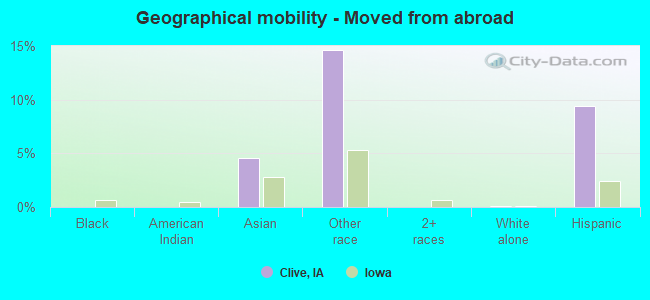
Geographical mobility - Moved from abroad (%)
Geographical mobility - Moved from abroad (%) - White
Geographical mobility - Moved from abroad (%) - Black or African American
Geographical mobility - Moved from abroad (%) - Asian
Geographical mobility - Moved from abroad (%) - Hispanic or Latino
Geographical mobility - Moved from abroad (%) - American Indian and Alaska Native
Geographical mobility - Moved from abroad (%) - Multirace
Geographical mobility - Moved from abroad (%) - Other Race
Place of birth for the foreign-born population - Ireland (%)
Place of birth for the foreign-born population - Denmark (%)
Place of birth for the foreign-born population - Norway (%)
Place of birth for the foreign-born population - Sweden (%)
Place of birth for the foreign-born population - United Kingdom (%)
Place of birth for the foreign-born population - England (%)
Place of birth for the foreign-born population - Scotland (%)
Place of birth for the foreign-born population - Other Northern Europe (%)
Place of birth for the foreign-born population - Austria (%)
Place of birth for the foreign-born population - Belgium (%)
Place of birth for the foreign-born population - France (%)
Place of birth for the foreign-born population - Germany (%)
Place of birth for the foreign-born population - Netherlands (%)
Place of birth for the foreign-born population - Switzerland (%)
Place of birth for the foreign-born population - Other Western Europe (%)
Place of birth for the foreign-born population - Greece (%)
Place of birth for the foreign-born population - Italy (%)
Place of birth for the foreign-born population - Portugal (%)
Place of birth for the foreign-born population - Spain (%)
Place of birth for the foreign-born population - Other Southern Europe (%)
Place of birth for the foreign-born population - Albania (%)
Place of birth for the foreign-born population - Belarus (%)
Place of birth for the foreign-born population - Bosnia and Herzegovina (%)
Place of birth for the foreign-born population - Bulgaria (%)
Place of birth for the foreign-born population - Croatia (%)
Place of birth for the foreign-born population - Czechoslovakia (%)
Place of birth for the foreign-born population - Hungary (%)
Place of birth for the foreign-born population - Latvia (%)
Place of birth for the foreign-born population - Lithuania (%)
Place of birth for the foreign-born population - North Macedonia (Macedonia) (%)
Place of birth for the foreign-born population - Moldova (%)
Place of birth for the foreign-born population - Poland (%)
Place of birth for the foreign-born population - Romania (%)
Place of birth for the foreign-born population - Russia (%)
Place of birth for the foreign-born population - Serbia (%)
Place of birth for the foreign-born population - Ukraine (%)
Place of birth for the foreign-born population - Other Eastern Europe (%)
Place of birth for the foreign-born population - China (%)
Place of birth for the foreign-born population - Hong Kong (%)
Place of birth for the foreign-born population - Taiwan (%)
Place of birth for the foreign-born population - Japan (%)
Place of birth for the foreign-born population - Korea (%)
Place of birth for the foreign-born population - Other Eastern Asia (%)
Place of birth for the foreign-born population - Afghanistan (%)
Place of birth for the foreign-born population - Bangladesh (%)
Place of birth for the foreign-born population - India (%)
Place of birth for the foreign-born population - Iran (%)
Place of birth for the foreign-born population - Kazakhstan (%)
Place of birth for the foreign-born population - Nepal (%)
Place of birth for the foreign-born population - Pakistan (%)
Place of birth for the foreign-born population - Sri Lanka (%)
Place of birth for the foreign-born population - Uzbekistan (%)
Place of birth for the foreign-born population - Other South Central Asia (%)
Place of birth for the foreign-born population - Burma (%)
Place of birth for the foreign-born population - Cambodia (%)
Place of birth for the foreign-born population - Indonesia (%)
Place of birth for the foreign-born population - Laos (%)
Place of birth for the foreign-born population - Malaysia (%)
Place of birth for the foreign-born population - Philippines (%)
Place of birth for the foreign-born population - Singapore (%)
Place of birth for the foreign-born population - Thailand (%)
Place of birth for the foreign-born population - Vietnam (%)
Place of birth for the foreign-born population - Other South Eastern Asia (%)
Place of birth for the foreign-born population - Armenia (%)
Place of birth for the foreign-born population - Iraq (%)
Place of birth for the foreign-born population - Israel (%)
Place of birth for the foreign-born population - Jordan (%)
Place of birth for the foreign-born population - Kuwait (%)
Place of birth for the foreign-born population - Lebanon (%)
Place of birth for the foreign-born population - Saudi Arabia (%)
Place of birth for the foreign-born population - Syria (%)
Place of birth for the foreign-born population - Turkey (%)
Place of birth for the foreign-born population - Yemen (%)
Place of birth for the foreign-born population - Other Western Asia (%)
Place of birth for the foreign-born population - Eritrea (%)
Place of birth for the foreign-born population - Ethiopia (%)
Place of birth for the foreign-born population - Kenya (%)
Place of birth for the foreign-born population - Somalia (%)
Place of birth for the foreign-born population - Uganda (%)
Place of birth for the foreign-born population - Zimbabwe (%)
Place of birth for the foreign-born population - Other Eastern Africa (%)
Place of birth for the foreign-born population - Cameroon (%)
Place of birth for the foreign-born population - Congo (%)
Place of birth for the foreign-born population - Democratic Republic of Congo (Zaire) (%)
Place of birth for the foreign-born population - Other Middle Africa (%)
Place of birth for the foreign-born population - Egypt (%)
Place of birth for the foreign-born population - Morocco (%)
Place of birth for the foreign-born population - Sudan (%)
Place of birth for the foreign-born population - Other Northern Africa (%)
Place of birth for the foreign-born population - South Africa (%)
Place of birth for the foreign-born population - Other Southern Africa (%)
Place of birth for the foreign-born population - Cabo Verde (%)
Place of birth for the foreign-born population - Ghana (%)
Place of birth for the foreign-born population - Liberia (%)
Place of birth for the foreign-born population - Nigeria (%)
Place of birth for the foreign-born population - Senegal (%)
Place of birth for the foreign-born population - Sierra Leone (%)
Place of birth for the foreign-born population - Other Western Africa (%)
Place of birth for the foreign-born population - Australia (%)
Place of birth for the foreign-born population - New Zealand (%)
Place of birth for the foreign-born population - Fiji (%)
Place of birth for the foreign-born population - Micronesia (%)
Place of birth for the foreign-born population - Bahamas (%)
Place of birth for the foreign-born population - Barbados (%)
Place of birth for the foreign-born population - Cuba (%)
Place of birth for the foreign-born population - Dominica (%)
Place of birth for the foreign-born population - Dominican Republic (%)
Place of birth for the foreign-born population - Grenada (%)
Place of birth for the foreign-born population - Haiti (%)
Place of birth for the foreign-born population - Jamaica (%)
Place of birth for the foreign-born population - St. Vincent and the Grenadines (%)
Place of birth for the foreign-born population - Trinidad and Tobago (%)
Place of birth for the foreign-born population - West Indies (%)
Place of birth for the foreign-born population - Other Caribbean (%)
Place of birth for the foreign-born population - Belize (%)
Place of birth for the foreign-born population - Costa Rica (%)
Place of birth for the foreign-born population - El Salvador (%)
Place of birth for the foreign-born population - Guatemala (%)
Place of birth for the foreign-born population - Honduras (%)
Place of birth for the foreign-born population - Mexico (%)
Place of birth for the foreign-born population - Nicaragua (%)
Place of birth for the foreign-born population - Panama (%)
Place of birth for the foreign-born population - Other Central America (%)
Place of birth for the foreign-born population - Argentina (%)
Place of birth for the foreign-born population - Bolivia (%)
Place of birth for the foreign-born population - Brazil (%)
Place of birth for the foreign-born population - Chile (%)
Place of birth for the foreign-born population - Colombia (%)
Place of birth for the foreign-born population - Ecuador (%)
Place of birth for the foreign-born population - Guyana (%)
Place of birth for the foreign-born population - Peru (%)
Place of birth for the foreign-born population - Uruguay (%)
Place of birth for the foreign-born population - Venezuela (%)
Place of birth for the foreign-born population - Other South America (%)
Place of birth for the foreign-born population - Canada (%)
Place of birth for the foreign-born population - Other Northern America (%)
Place of birth for the foreign-born population - Other (%)
Latest news about races in Clive, IA collected exclusively by city-data.com from local newspapers, TV, and radio stations
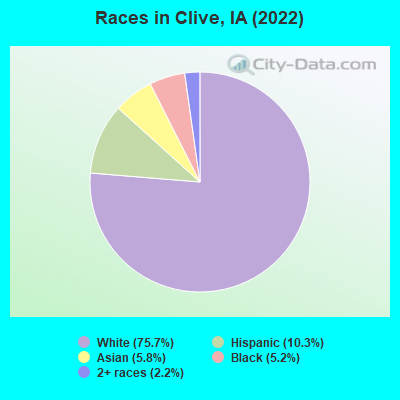
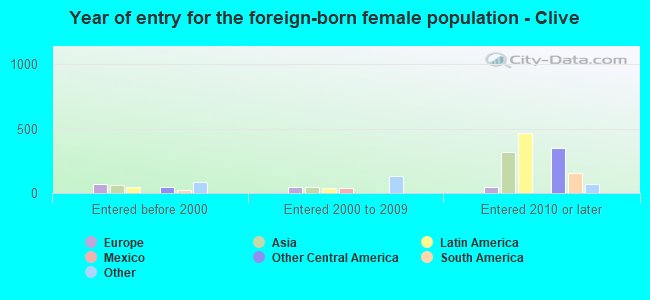
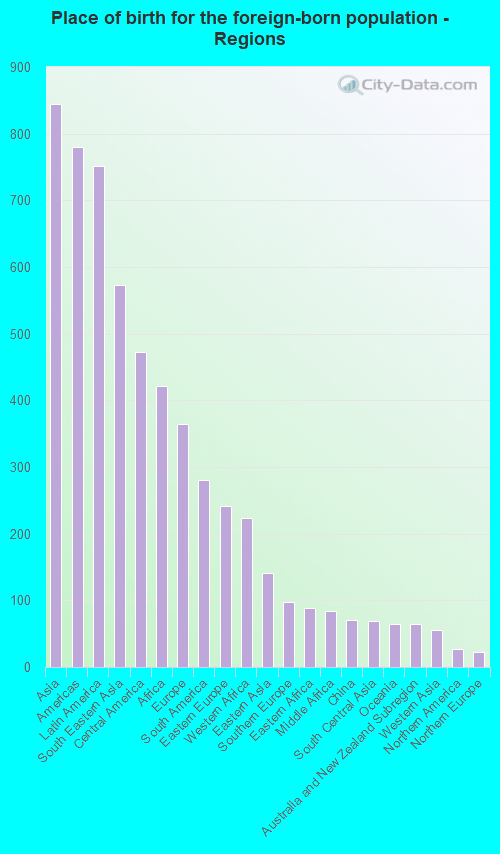
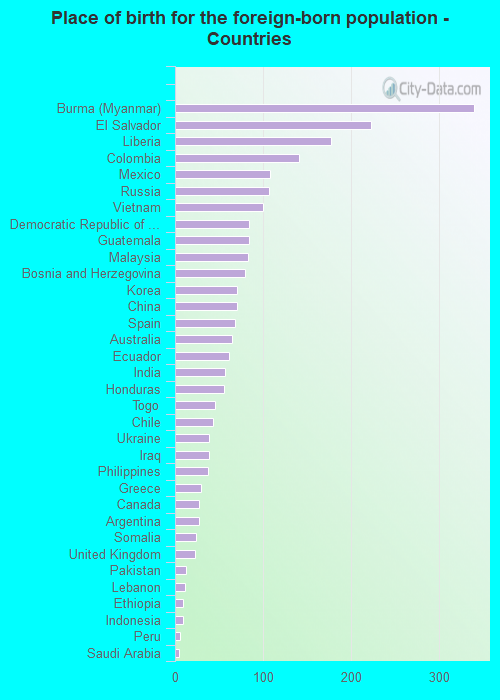
According to 2022 data, the most numerous races in Clive, IA are White alone (14,286 residents), Hispanic (1,943 residents), and Black alone (979 residents). 81.4% of Clive residents speak English at home. 13.1% of Clive, IA residents are foreign-born (4.5% born in Asia, 4.0% born in Latin America, 2.2% born in Africa, 1.9% born in Europe), which is 61.9% greater than the foreign-born rate of 5.0% across the entire state of Iowa.
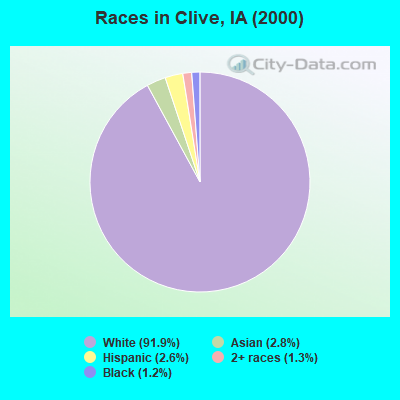
Race distribution in Clive
2000 2022
2,710,344 92.6% White alone 82,473 2.8% Hispanic 60,744 2.1% Black alone 36,345 1.2% Asian alone 25,472 0.9% Two or more races 7,955 0.3% American Indian alone 2,103 0.07% Other race alone 888 0.03% Native Hawaiian and Other
2,650,110 82.8% White alone 218,024 6.8% Hispanic 119,004 3.7% Black alone 115,286 3.6% Two or more races 74,892 2.3% Asian alone 9,260 0.3% Other race alone 8,595 0.3% Native Hawaiian and Other 5,346 0.2% American Indian alone
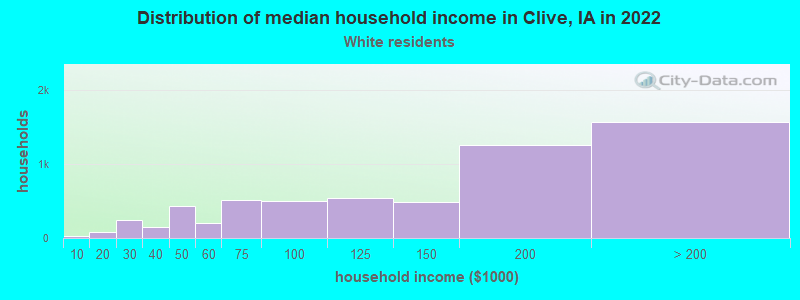
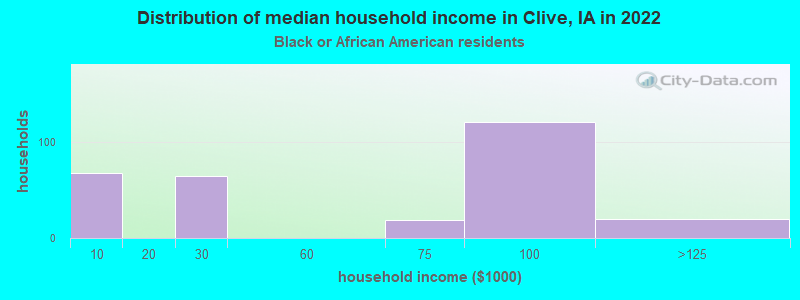
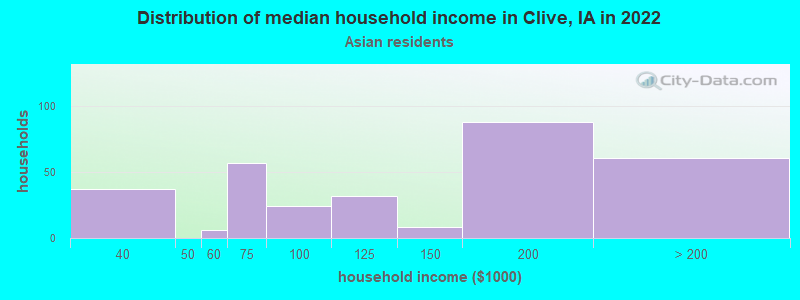
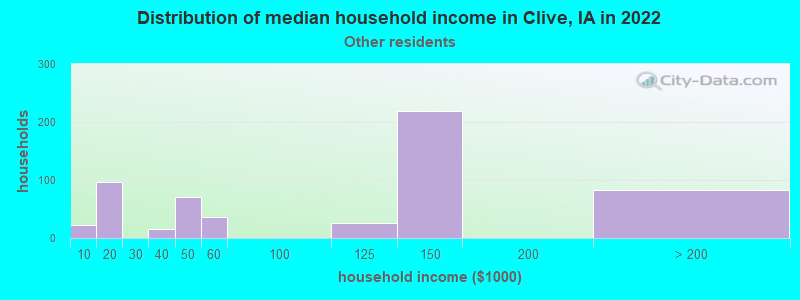
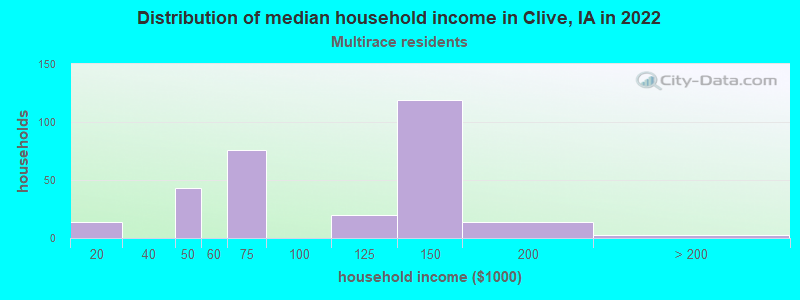
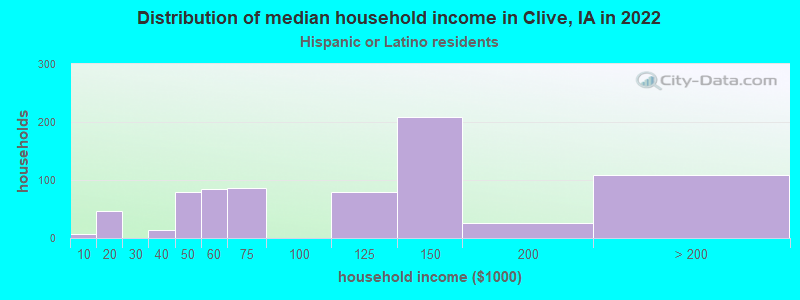
Income and house value in Clive Median household income in 2022 $133,107 White non-Hispanic householders$68,341 Black householders$112,089 Asian householders$122,110 Some other race householders$117,640 Two or more races householders$119,175 Hispanic or Latino race householdersMedian 2022 house value $397,775 White Non-Hispanic householders$549,716 Black or African American householders$412,287 American Indian or Alaska Native householders $413,826 Asian householders$120,937 Native Hawaiian and other Pacific Islander householders$164,915 Some other race householders$190,641 Two or more races householders
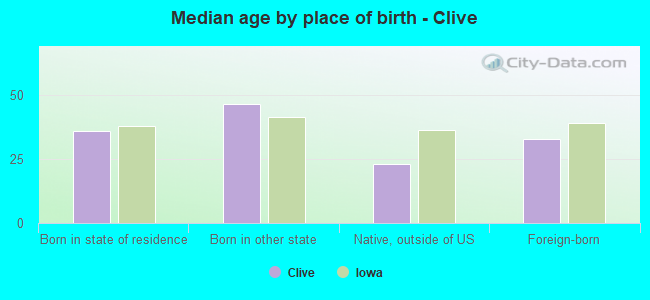
Median age by race in Clive
42.8 Median age for White residents40.8 45.3 27.2 Median age for Black or African American residents32.5 17.8 33.4 Median age for American Indian / Alaska Native residents31.3 13.8 27.0 Median age for Asian residents35.4 25.2 -580,729,166.1 Median age for Native Hawaiian / Pacific Islander residents-776,978,416.5 -504,347,825.6 30.3 Median age for Other race residents28.2 30.4 15.6 Median age for Two or more races residents15.1 12.9 42.8 Median age for White alone residents41.0 45.6 29.4 Median age for Hispanic or Latino residents27.6 29.9
Owner/renter occupied households by race in Clive
House owners and renters - White residents 4,972 84.1% Owner occupied938 15.9% Renter occupiedHouse owners and renters - Black or African American residents 85 28.5% Owner occupied213 71.5% Renter occupiedHouse owners and renters - American Indian / Alaska Native residents 5 100.0% Owner occupiedHouse owners and renters - Asian residents 161 60.5% Owner occupied105 39.5% Renter occupiedHouse owners and renters - Other race residents 81 16.7% Owner occupied404 83.3% Renter occupiedHouse owners and renters - Two or more races residents 164 44.6% Owner occupied203 55.4% Renter occupiedHouse owners and renters - White alone residents 4,949 85.4% Owner occupied844 14.6% Renter occupiedHouse owners and renters - Hispanic or Latino residents 159 26.4% Owner occupied443 73.6% Renter occupied
Language usage in Clive
English speakers - Total 81.4% of residents of Clive speak English at home.
7.8% of residents speak Spanish at home 825 58.5% Speak English very well585 41.5% Speak English less than very well11.0% of residents speak other language at home 1,063 53.7% Speak English very well915 46.3% Speak English less than very well
English speakers - Born in the United States 91.6% of residents of Clive speak English at home.
2.6% of residents speak Spanish at home 118 95.9% Speak English very well5 4.1% Speak English less than very well4.9% of residents speak other language at home 235 100.0% Speak English very well
English speakers - Native, born elsewhere 56.4% of residents of Clive speak English at home.
28.9% of residents speak Spanish at home 88 100.0% Speak English very well11.1% of residents speak other language at home 34 100.0% Speak English very well
English speakers - Foreign-born 18.7% of residents of Clive speak English at home.
31.0% of residents speak Spanish at home 331 39.3% Speak English very well512 60.7% Speak English less than very well50.1% of residents speak other language at home 481 35.3% Speak English very well880 64.7% Speak English less than very well
White (Caucasian) - Speak only English Native:
96.1% (12,935)Foreign-born:
43.0% (173)
White (Caucasian) - Speak another language Native:
2.9% (397)Foreign-born:
64.5% (260)
Black or African American - Speak only English Native:
80.1% (257)Foreign-born:
20.1% (143)
Black or African American - Speak another language Native:
23.7% (76)Foreign-born:
76.2% (541)
Asian - Speak only English Native:
76.9% (188)Foreign-born:
8.9% (71)
Asian - Speak another language Native:
24.8% (61)Foreign-born:
90.5% (717)
Other race - Speak only English Native:
53.6% (296)Foreign-born:
18.0% (72)
Other race - Speak another language Native:
45.4% (250)Foreign-born:
75.8% (303)
Two or more races - Speak another language Native:
40.6% (351)Foreign-born:
100.0% (398)
White alone - Speak only English Native:
95.3% (12,875)Foreign-born:
36.4% (127)
White alone - Speak another language Native:
4.3% (578)Foreign-born:
65.6% (229)
Hispanic or Latino - Speak only English Native:
52.1% (475)Foreign-born:
16.9% (141)
Hispanic or Latino - Speak another language Native:
47.4% (432)Foreign-born:
80.7% (672)
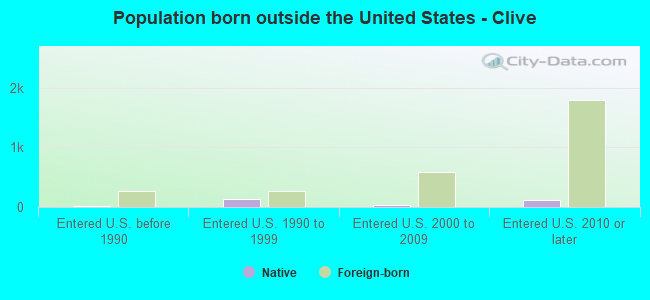
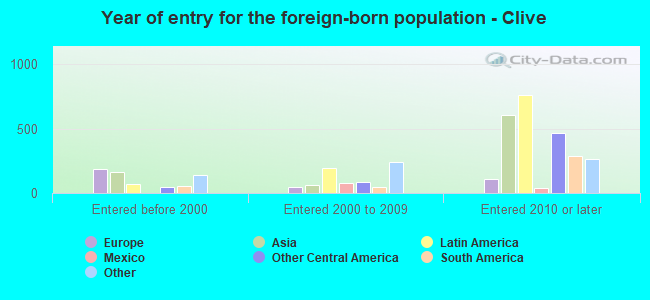
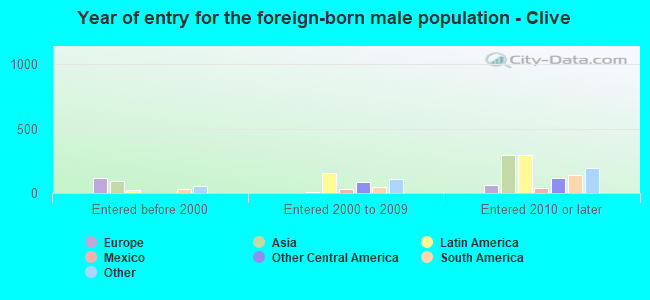
Foreign-born residents in Clive 2,476 residents are foreign born (4.5% Asia , 4.0% Latin America , 2.2% Africa , 1.9% Europe ).
Marital status for residents in Clive Marital status - White (Caucasian) population 15 years and over
Males 22.5% Never married66.7% Now married1.4% Separated1.5% Widowed8.0% DivorcedFemales 20.3% Never married64.0% Now married0.1% Separated7.2% Widowed8.4% DivorcedWomen who gave birth in the past 12 months Now married:
100.0% (35)Unmarried:
0.0% (0)
Women who did not give birth in the past 12 months Now married:
57.1% (1,602)Unmarried:
42.9% (1,206)
Marital status - Black or African American population 15 years and over
Males 52.0% Never married29.9% Now married0.0% Separated2.6% Widowed15.5% DivorcedFemales 59.4% Never married40.6% Now married0.0% Separated0.0% Widowed0.0% DivorcedWomen who did not give birth in the past 12 months Now married:
41.1% (118)Unmarried:
58.9% (169)
Marital status - American Indian / Alaska Native population 15 years and over
Males 0.0% Never married66.7% Now married0.0% Separated0.0% Widowed33.3% DivorcedFemales 0.0% Never married60.0% Now married0.0% Separated0.0% Widowed40.0% DivorcedWomen who did not give birth in the past 12 months Now married:
100.0% (3)Unmarried:
0.0% (0)
Marital status - Asian population 15 years and over
Males 31.0% Never married60.5% Now married4.2% Separated0.0% Widowed4.2% DivorcedFemales 31.7% Never married52.0% Now married0.0% Separated0.0% Widowed16.3% DivorcedWomen who did not give birth in the past 12 months Now married:
47.2% (177)Unmarried:
52.8% (198)
Marital status - Other race population 15 years and over
Males 45.5% Never married49.5% Now married0.0% Separated0.0% Widowed5.1% DivorcedFemales 16.7% Never married74.0% Now married9.3% Separated0.0% Widowed0.0% DivorcedWomen who gave birth in the past 12 months Now married:
100.0% (38)Unmarried:
0.0% (0)
Women who did not give birth in the past 12 months Now married:
80.9% (307)Unmarried:
19.1% (73)
Marital status - Two or more races population 15 years and over
Males 27.2% Never married72.8% Now married0.0% Separated0.0% Widowed0.0% DivorcedFemales 22.4% Never married72.0% Now married0.0% Separated5.6% Widowed0.0% DivorcedWomen who did not give birth in the past 12 months Now married:
75.4% (230)Unmarried:
24.6% (75)
Marital status - White alone, not Hispanic / Latino population 15 years and over
Males 23.0% Never married66.6% Now married1.4% Separated1.5% Widowed7.4% DivorcedFemales 20.6% Never married64.3% Now married0.1% Separated7.3% Widowed7.7% DivorcedWomen who gave birth in the past 12 months Now married:
100.0% (30)Unmarried:
0.0% (0)
Women who did not give birth in the past 12 months Now married:
57.3% (1,596)Unmarried:
42.7% (1,187)
Marital status - Hispanic or Latino population 15 years and over
Males 27.7% Never married60.9% Now married0.0% Separated0.0% Widowed11.3% DivorcedFemales 16.5% Never married68.5% Now married4.9% Separated1.6% Widowed8.5% DivorcedWomen who gave birth in the past 12 months Now married:
100.0% (38)Unmarried:
0.0% (0)
Women who did not give birth in the past 12 months Now married:
73.1% (397)Unmarried:
26.9% (146)
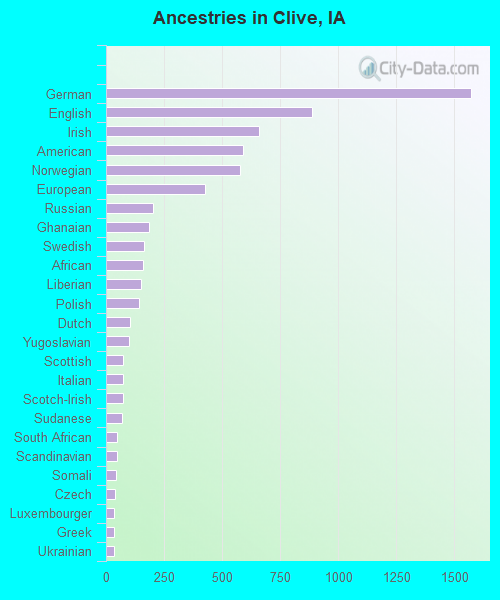
Ancestries in Clive
1,571 17.8% German889 10.1% English661 7.5% Irish592 6.7% American575 6.5% Norwegian426 4.8% European202 2.3% Russian186 2.1% Ghanaian163 1.8% Swedish161 1.8% African151 1.7% Liberian144 1.6% Polish105 1.2% Dutch99 1.1% Yugoslavian73 0.8% Scottish72 0.8% Italian72 0.8% Scotch-Irish69 0.8% Sudanese48 0.5% South African47 0.5% Scandinavian41 0.5% Somali39 0.4% Czech34 0.4% Luxembourger33 0.4% Greek33 0.4% Ukrainian26 0.3% Danish23 0.3% British13 0.1% Armenian13 0.1% French Canadian13 0.1% Eastern European13 0.1% Latvian12 0.1% Romanian11 0.1% French9 0.1% Ethiopian8 0.09% Hungarian7 0.08% Lebanese7 0.08% Belgian7 0.08% Welsh5 0.06% Canadian4 0.05% Arab
Geographical mobility in Clive Same house 1 year ago 13,723 95.3% White (Caucasian)1,038 100.0% Black or African American20 84.1% American Indian / Alaska Native974 88.6% Asian647 63.7% Other race1,113 84.6% Two or more races13,586 95.3% White alone, not Hispanic / Latino1,477 76.4% Hispanic or LatinoMoved within same county 334 2.3% White / Caucasian18 1.7% Asian132 13.0% Other race175 13.3% Two or more races299 2.1% White alone, not Hispanic / Latino257 13.3% Hispanic or LatinoMoved within same state 242 1.7% White / Caucasian64 6.3% Other race248 1.7% White alone, not Hispanic / Latino57 2.9% Hispanic or LatinoMoved from different state 217 1.5% White / Caucasian4 16.0% American Indian / Alaska Native52 4.8% Asian216 1.5% White alone, not Hispanic / Latino10 0.5% Hispanic or LatinoMoved from abroad 10 0.1% White50 4.5% Asian149 14.7% Other race10 0.1% White alone, not Hispanic / Latino181 9.4% Hispanic or Latino
Children Nativity (place of birth) in Clive
Children under 6 years - Living with two parents Both parents native 743 100.0% NativeBoth parents foreign-born 104 79.8% Native26 20.2% Foreign-bornOne native, one foreign-born parent 13 100.0% NativeChildren under 6 years - Living with one parent Native parent 29 100.0% NativeForeign-born parent 149 83.5% Native29 16.5% Foreign-bornChildren 6 to 17 years - Living with two parents Both parents native 2,542 100.0% NativeBoth parents foreign-born 182 34.1% Native353 65.9% Foreign-bornOne native, one foreign-born parent 192 100.0% NativeChildren 6 to 17 years - Living with one parent Native parent 168 100.0% NativeForeign-born parent 279 60.1% Native185 39.9% Foreign-born
Grandparents responsible for own grandchildren in Clive
Grandparents (30 to 59 years) White / Caucasian 10 63.1% Responsible for grandchildren6 36.9% Not responsible for grandchildrenWhite alone, not Hispanic / Latino 10 60.1% Responsible for grandchildren6 39.9% Not responsible for grandchildrenGrandparents (60 years and over) White / Caucasian 6 43.1% Responsible for grandchildren8 56.9% Not responsible for grandchildrenWhite alone, not Hispanic / Latino 6 40.5% Responsible for grandchildren9 59.5% Not responsible for grandchildren