Races in College Station, Texas (TX) Detailed Stats
Data:
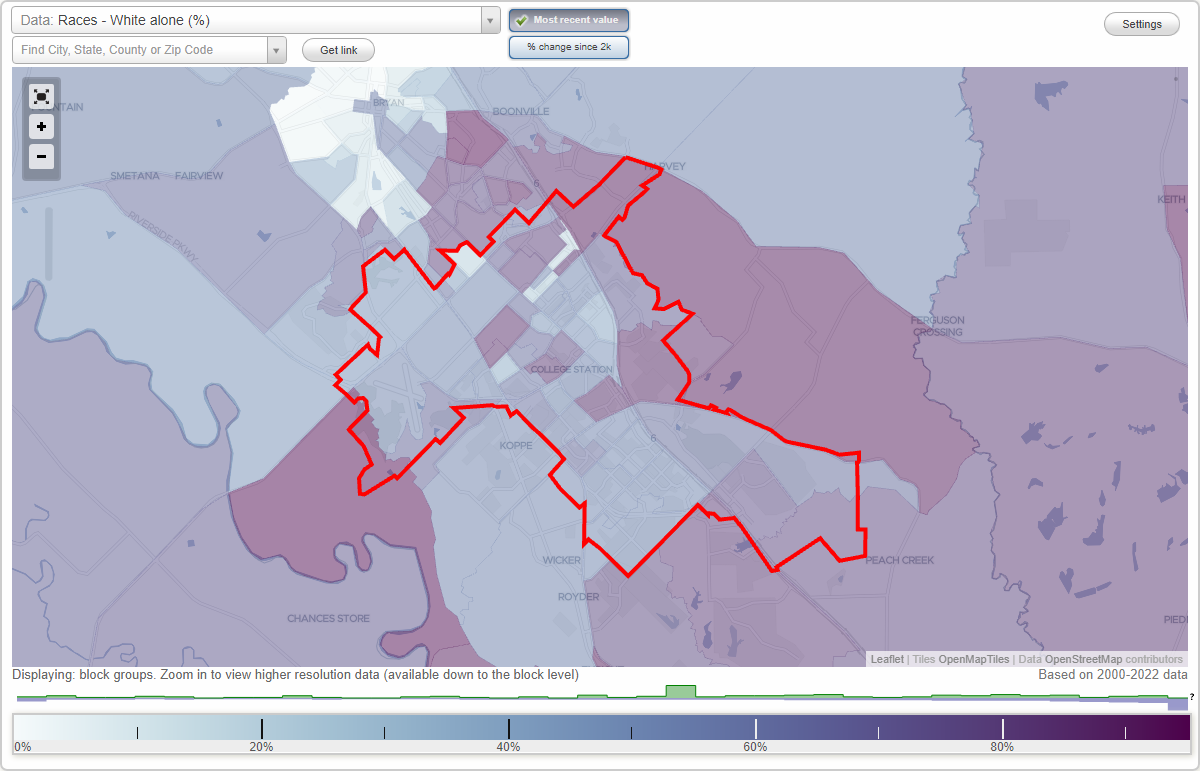
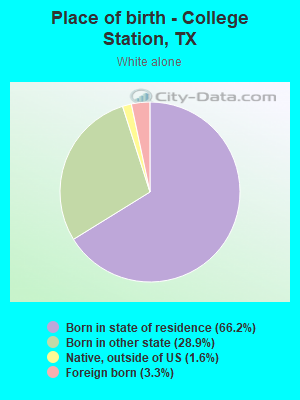
Races - White alone (%)
Races - White alone (% change since 2000)
Races - Black alone (%)
Races - Black alone (% change since 2000)
Races - American Indian alone (%)
Races - American Indian alone (% change since 2000)
Races - Asian alone (%)
Races - Asian alone (% change since 2000)
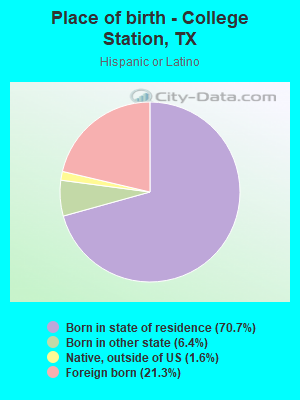
Races - Hispanic (%)
Races - Hispanic (% change since 2000)
Races - Native Hawaiian and Other Pacific Islander alone (%)
Races - Native Hawaiian and Other Pacific Islander alone (% change since 2000)
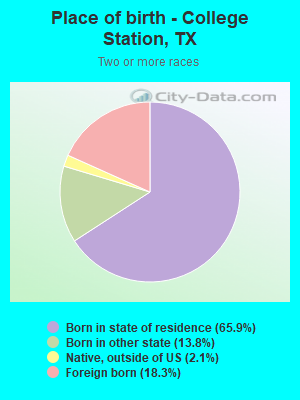
Races - Two or more races(%)
Races - Two or more races(% change since 2000)
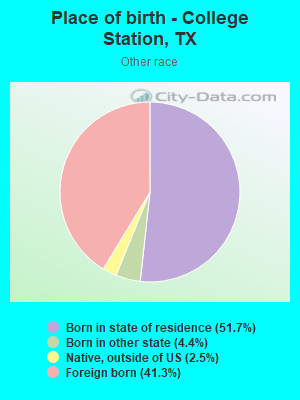
Races - Other race alone (%)
Races - Other race alone (% change since 2000)
Racial diversity
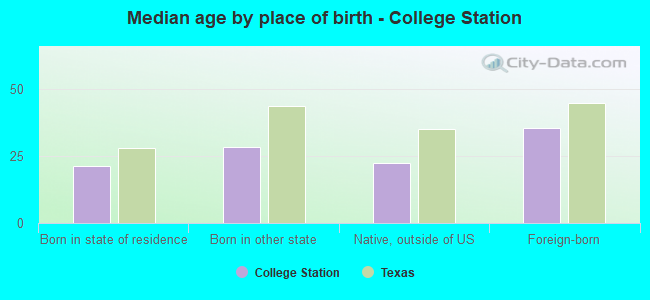
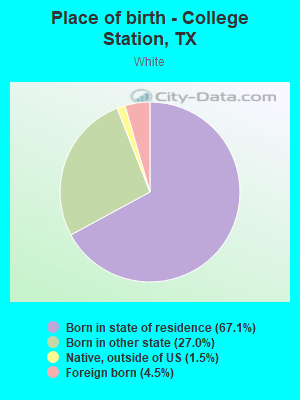
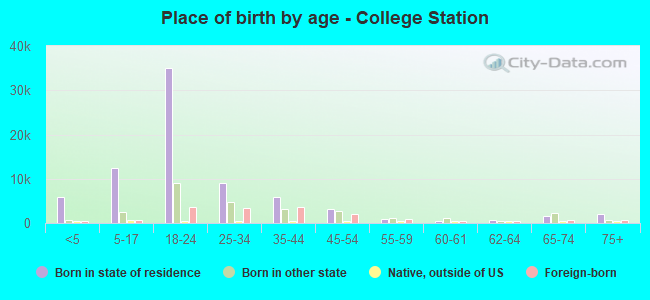
Place of birth - Born in state of residence (%)
Place of birth - Born in state of residence (%) - White
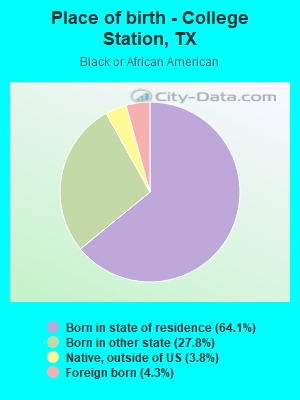
Place of birth - Born in state of residence (%) - Black or African American
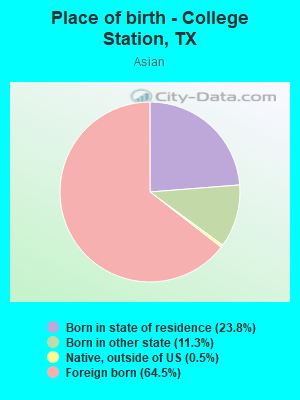
Place of birth - Born in state of residence (%) - Asian
Place of birth - Born in state of residence (%) - Hispanic or Latino
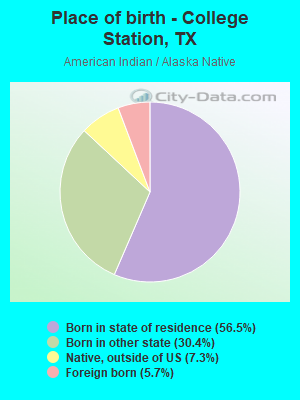
Place of birth - Born in state of residence (%) - American Indian and Alaska Native
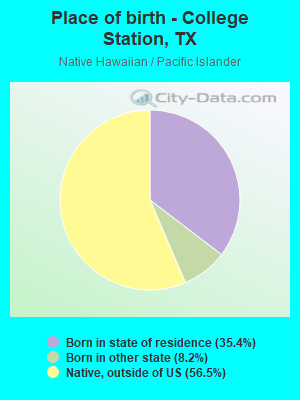
Place of birth - Born in state of residence (%) - Multirace
Place of birth - Born in state of residence (%) - Other Race
Place of birth - Born in other state (%)
Place of birth - Born in other state (%) - White
Place of birth - Born in other state (%) - Black or African American
Place of birth - Born in other state (%) - Asian
Place of birth - Born in other state (%) - Hispanic or Latino
Place of birth - Born in other state (%) - American Indian and Alaska Native
Place of birth - Born in other state (%) - Multirace
Place of birth - Born in other state (%) - Other Race
Place of birth - Native, outside of US (%)
Place of birth - Native, outside of US (%) - White
Place of birth - Native, outside of US (%) - Black or African American
Place of birth - Native, outside of US (%) - Asian
Place of birth - Native, outside of US (%) - Hispanic or Latino
Place of birth - Native, outside of US (%) - American Indian and Alaska Native
Place of birth - Native, outside of US (%) - Multirace
Place of birth - Native, outside of US (%) - Other Race
Place of birth - Foreign born (%)
Place of birth - Foreign born (%) - White
Place of birth - Foreign born (%) - Black or African American
Place of birth - Foreign born (%) - Asian
Place of birth - Foreign born (%) - Hispanic or Latino
Place of birth - Foreign born (%) - American Indian and Alaska Native
Place of birth - Foreign born (%) - Multirace
Place of birth - Foreign born (%) - Other Race
Residents speaking English at home (%)
Residents speaking English at home - Born in the United States (%)
Residents speaking English at home - Native, born elsewhere (%)
Residents speaking English at home - Foreign born (%)
Residents speaking Spanish at home (%)
Residents speaking Spanish at home - Born in the United States (%)
Residents speaking Spanish at home - Native, born elsewhere (%)
Residents speaking Spanish at home - Foreign born (%)
Residents speaking other language at home (%)
Residents speaking other language at home - Born in the United States (%)
Residents speaking other language at home - Native, born elsewhere (%)
Residents speaking other language at home - Foreign born (%)
Marital status - Never married (%)
Marital status - Now married (%)
Marital status - Separated (%)
Marital status - Widowed (%)
Marital status - Divorced (%)
Ancestries Reported - Arab (%)
Ancestries Reported - Czech (%)
Ancestries Reported - Danish (%)
Ancestries Reported - Dutch (%)
Ancestries Reported - English (%)
Ancestries Reported - French (%)
Ancestries Reported - French Canadian (%)
Ancestries Reported - German (%)
Ancestries Reported - Greek (%)
Ancestries Reported - Hungarian (%)
Ancestries Reported - Irish (%)
Ancestries Reported - Italian (%)
Ancestries Reported - Lithuanian (%)
Ancestries Reported - Norwegian (%)
Ancestries Reported - Polish (%)
Ancestries Reported - Portuguese (%)
Ancestries Reported - Russian (%)
Ancestries Reported - Scotch-Irish (%)
Ancestries Reported - Scottish (%)
Ancestries Reported - Slovak (%)
Ancestries Reported - Subsaharan African (%)
Ancestries Reported - Swedish (%)
Ancestries Reported - Swiss (%)
Ancestries Reported - Ukrainian (%)
Ancestries Reported - United States (%)
Ancestries Reported - Welsh (%)
Ancestries Reported - West Indian (%)
Ancestries Reported - Other (%)
Geographical mobility - Same house 1 year ago (%)
Geographical mobility - Same house 1 year ago (%) - White
Geographical mobility - Same house 1 year ago (%) - Black or African American
Geographical mobility - Same house 1 year ago (%) - Asian
Geographical mobility - Same house 1 year ago (%) - Hispanic or Latino
Geographical mobility - Same house 1 year ago (%) - American Indian and Alaska Native
Geographical mobility - Same house 1 year ago (%) - Multirace
Geographical mobility - Same house 1 year ago (%) - Other Race
Geographical mobility - Moved within same county (%)
Geographical mobility - Moved within same county (%) - White
Geographical mobility - Moved within same county (%) - Black or African American
Geographical mobility - Moved within same county (%) - Asian
Geographical mobility - Moved within same county (%) - Hispanic or Latino
Geographical mobility - Moved within same county (%) - American Indian and Alaska Native
Geographical mobility - Moved within same county (%) - Multirace
Geographical mobility - Moved within same county (%) - Other Race
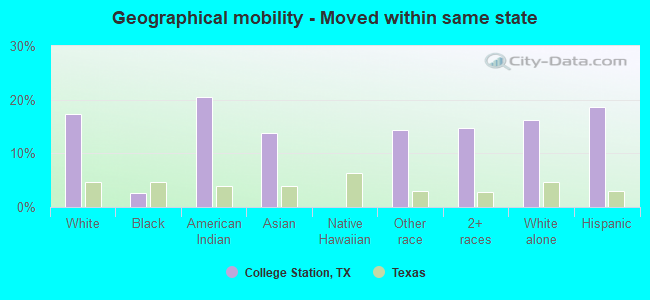
Geographical mobility - Moved from different county within same state (%)
Geographical mobility - Moved from different county within same state (%) - White
Geographical mobility - Moved from different county within same state (%) - Black or African American
Geographical mobility - Moved from different county within same state (%) - Asian
Geographical mobility - Moved from different county within same state (%) - Hispanic or Latino
Geographical mobility - Moved from different county within same state (%) - American Indian and Alaska Native
Geographical mobility - Moved from different county within same state (%) - Multirace
Geographical mobility - Moved from different county within same state (%) - Other Race
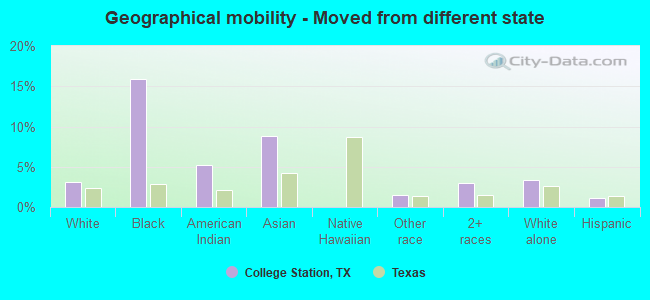
Geographical mobility - Moved from different state (%)
Geographical mobility - Moved from different state (%) - White
Geographical mobility - Moved from different state (%) - Black or African American
Geographical mobility - Moved from different state (%) - Asian
Geographical mobility - Moved from different state (%) - Hispanic or Latino
Geographical mobility - Moved from different state (%) - American Indian and Alaska Native
Geographical mobility - Moved from different state (%) - Multirace
Geographical mobility - Moved from different state (%) - Other Race
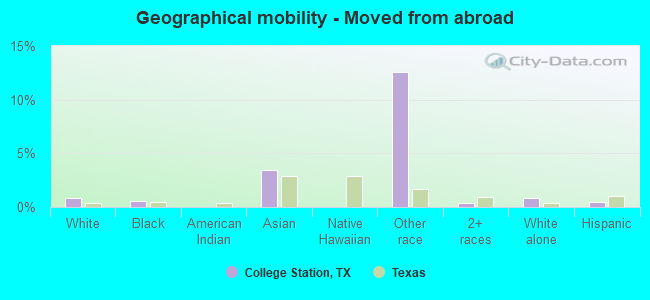
Geographical mobility - Moved from abroad (%)
Geographical mobility - Moved from abroad (%) - White
Geographical mobility - Moved from abroad (%) - Black or African American
Geographical mobility - Moved from abroad (%) - Asian
Geographical mobility - Moved from abroad (%) - Hispanic or Latino
Geographical mobility - Moved from abroad (%) - American Indian and Alaska Native
Geographical mobility - Moved from abroad (%) - Multirace
Geographical mobility - Moved from abroad (%) - Other Race
Place of birth for the foreign-born population - Ireland (%)
Place of birth for the foreign-born population - Denmark (%)
Place of birth for the foreign-born population - Norway (%)
Place of birth for the foreign-born population - Sweden (%)
Place of birth for the foreign-born population - United Kingdom (%)
Place of birth for the foreign-born population - England (%)
Place of birth for the foreign-born population - Scotland (%)
Place of birth for the foreign-born population - Other Northern Europe (%)
Place of birth for the foreign-born population - Austria (%)
Place of birth for the foreign-born population - Belgium (%)
Place of birth for the foreign-born population - France (%)
Place of birth for the foreign-born population - Germany (%)
Place of birth for the foreign-born population - Netherlands (%)
Place of birth for the foreign-born population - Switzerland (%)
Place of birth for the foreign-born population - Other Western Europe (%)
Place of birth for the foreign-born population - Greece (%)
Place of birth for the foreign-born population - Italy (%)
Place of birth for the foreign-born population - Portugal (%)
Place of birth for the foreign-born population - Spain (%)
Place of birth for the foreign-born population - Other Southern Europe (%)
Place of birth for the foreign-born population - Albania (%)
Place of birth for the foreign-born population - Belarus (%)
Place of birth for the foreign-born population - Bosnia and Herzegovina (%)
Place of birth for the foreign-born population - Bulgaria (%)
Place of birth for the foreign-born population - Croatia (%)
Place of birth for the foreign-born population - Czechoslovakia (%)
Place of birth for the foreign-born population - Hungary (%)
Place of birth for the foreign-born population - Latvia (%)
Place of birth for the foreign-born population - Lithuania (%)
Place of birth for the foreign-born population - North Macedonia (Macedonia) (%)
Place of birth for the foreign-born population - Moldova (%)
Place of birth for the foreign-born population - Poland (%)
Place of birth for the foreign-born population - Romania (%)
Place of birth for the foreign-born population - Russia (%)
Place of birth for the foreign-born population - Serbia (%)
Place of birth for the foreign-born population - Ukraine (%)
Place of birth for the foreign-born population - Other Eastern Europe (%)
Place of birth for the foreign-born population - China (%)
Place of birth for the foreign-born population - Hong Kong (%)
Place of birth for the foreign-born population - Taiwan (%)
Place of birth for the foreign-born population - Japan (%)
Place of birth for the foreign-born population - Korea (%)
Place of birth for the foreign-born population - Other Eastern Asia (%)
Place of birth for the foreign-born population - Afghanistan (%)
Place of birth for the foreign-born population - Bangladesh (%)
Place of birth for the foreign-born population - India (%)
Place of birth for the foreign-born population - Iran (%)
Place of birth for the foreign-born population - Kazakhstan (%)
Place of birth for the foreign-born population - Nepal (%)
Place of birth for the foreign-born population - Pakistan (%)
Place of birth for the foreign-born population - Sri Lanka (%)
Place of birth for the foreign-born population - Uzbekistan (%)
Place of birth for the foreign-born population - Other South Central Asia (%)
Place of birth for the foreign-born population - Burma (%)
Place of birth for the foreign-born population - Cambodia (%)
Place of birth for the foreign-born population - Indonesia (%)
Place of birth for the foreign-born population - Laos (%)
Place of birth for the foreign-born population - Malaysia (%)
Place of birth for the foreign-born population - Philippines (%)
Place of birth for the foreign-born population - Singapore (%)
Place of birth for the foreign-born population - Thailand (%)
Place of birth for the foreign-born population - Vietnam (%)
Place of birth for the foreign-born population - Other South Eastern Asia (%)
Place of birth for the foreign-born population - Armenia (%)
Place of birth for the foreign-born population - Iraq (%)
Place of birth for the foreign-born population - Israel (%)
Place of birth for the foreign-born population - Jordan (%)
Place of birth for the foreign-born population - Kuwait (%)
Place of birth for the foreign-born population - Lebanon (%)
Place of birth for the foreign-born population - Saudi Arabia (%)
Place of birth for the foreign-born population - Syria (%)
Place of birth for the foreign-born population - Turkey (%)
Place of birth for the foreign-born population - Yemen (%)
Place of birth for the foreign-born population - Other Western Asia (%)
Place of birth for the foreign-born population - Eritrea (%)
Place of birth for the foreign-born population - Ethiopia (%)
Place of birth for the foreign-born population - Kenya (%)
Place of birth for the foreign-born population - Somalia (%)
Place of birth for the foreign-born population - Uganda (%)
Place of birth for the foreign-born population - Zimbabwe (%)
Place of birth for the foreign-born population - Other Eastern Africa (%)
Place of birth for the foreign-born population - Cameroon (%)
Place of birth for the foreign-born population - Congo (%)
Place of birth for the foreign-born population - Democratic Republic of Congo (Zaire) (%)
Place of birth for the foreign-born population - Other Middle Africa (%)
Place of birth for the foreign-born population - Egypt (%)
Place of birth for the foreign-born population - Morocco (%)
Place of birth for the foreign-born population - Sudan (%)
Place of birth for the foreign-born population - Other Northern Africa (%)
Place of birth for the foreign-born population - South Africa (%)
Place of birth for the foreign-born population - Other Southern Africa (%)
Place of birth for the foreign-born population - Cabo Verde (%)
Place of birth for the foreign-born population - Ghana (%)
Place of birth for the foreign-born population - Liberia (%)
Place of birth for the foreign-born population - Nigeria (%)
Place of birth for the foreign-born population - Senegal (%)
Place of birth for the foreign-born population - Sierra Leone (%)
Place of birth for the foreign-born population - Other Western Africa (%)
Place of birth for the foreign-born population - Australia (%)
Place of birth for the foreign-born population - New Zealand (%)
Place of birth for the foreign-born population - Fiji (%)
Place of birth for the foreign-born population - Micronesia (%)
Place of birth for the foreign-born population - Bahamas (%)
Place of birth for the foreign-born population - Barbados (%)
Place of birth for the foreign-born population - Cuba (%)
Place of birth for the foreign-born population - Dominica (%)
Place of birth for the foreign-born population - Dominican Republic (%)
Place of birth for the foreign-born population - Grenada (%)
Place of birth for the foreign-born population - Haiti (%)
Place of birth for the foreign-born population - Jamaica (%)
Place of birth for the foreign-born population - St. Vincent and the Grenadines (%)
Place of birth for the foreign-born population - Trinidad and Tobago (%)
Place of birth for the foreign-born population - West Indies (%)
Place of birth for the foreign-born population - Other Caribbean (%)
Place of birth for the foreign-born population - Belize (%)
Place of birth for the foreign-born population - Costa Rica (%)
Place of birth for the foreign-born population - El Salvador (%)
Place of birth for the foreign-born population - Guatemala (%)
Place of birth for the foreign-born population - Honduras (%)
Place of birth for the foreign-born population - Mexico (%)
Place of birth for the foreign-born population - Nicaragua (%)
Place of birth for the foreign-born population - Panama (%)
Place of birth for the foreign-born population - Other Central America (%)
Place of birth for the foreign-born population - Argentina (%)
Place of birth for the foreign-born population - Bolivia (%)
Place of birth for the foreign-born population - Brazil (%)
Place of birth for the foreign-born population - Chile (%)
Place of birth for the foreign-born population - Colombia (%)
Place of birth for the foreign-born population - Ecuador (%)
Place of birth for the foreign-born population - Guyana (%)
Place of birth for the foreign-born population - Peru (%)
Place of birth for the foreign-born population - Uruguay (%)
Place of birth for the foreign-born population - Venezuela (%)
Place of birth for the foreign-born population - Other South America (%)
Place of birth for the foreign-born population - Canada (%)
Place of birth for the foreign-born population - Other Northern America (%)
Place of birth for the foreign-born population - Other (%)
According to 2022 data, the most numerous races in College Station, TX are Hispanic (22,402 residents), White alone (72,438 residents), and Black alone (10,824 residents). 78.3% of College Station residents speak English at home. 12.3% of College Station, TX residents are foreign-born (7.4% born in Asia, 3.2% born in Latin America), which is 38.6% less than the foreign-born rate of 17.0% across the entire state of Texas.
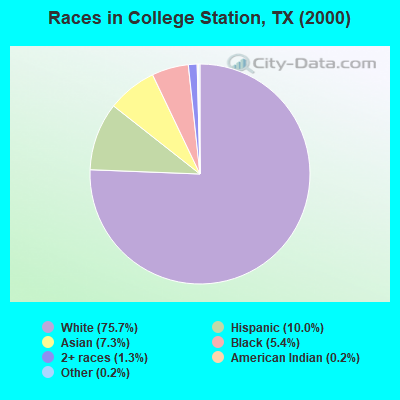
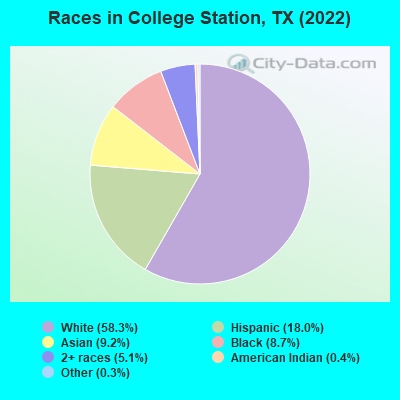
Race distribution in College Station
2000 2022
10,933,313 52.4% White alone 6,669,666 32.0% Hispanic 2,364,255 11.3% Black alone 554,445 2.7% Asian alone 230,567 1.1% Two or more races 68,859 0.3% American Indian alone 19,958 0.10% Other race alone 10,757 0.05% Native Hawaiian and Other
12,070,642 40.2% Hispanic 11,683,430 38.9% White alone 3,508,706 11.7% Black alone 1,608,173 5.4% Asian alone 956,560 3.2% Two or more races 125,763 0.4% Other race alone 47,023 0.2% American Indian alone 29,275 0.10% Native Hawaiian and Other
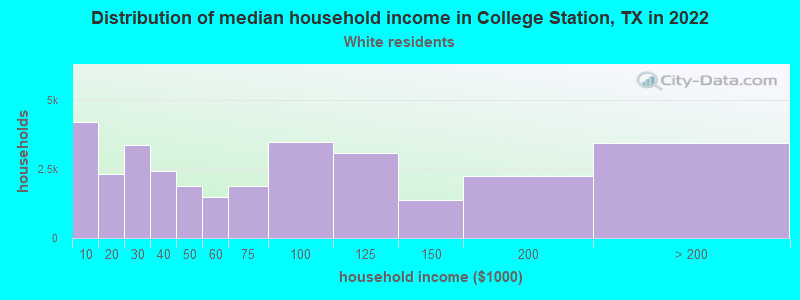
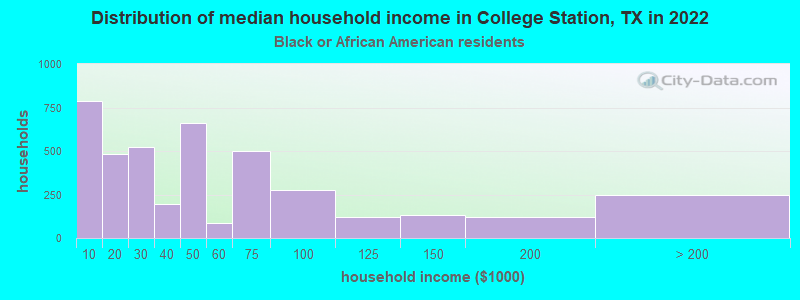
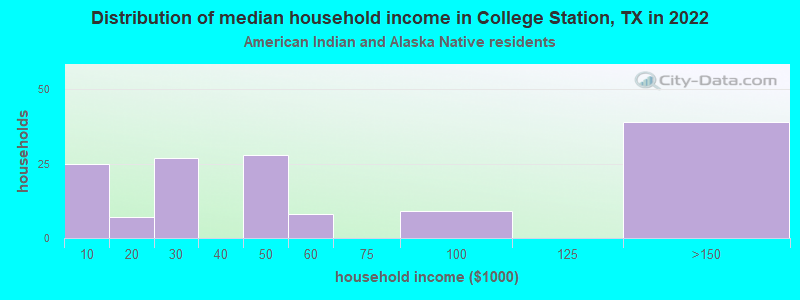
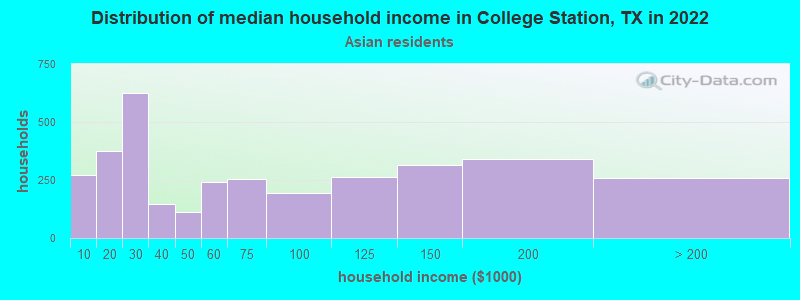
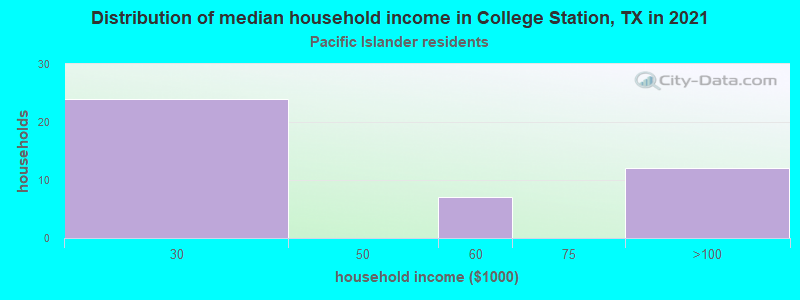
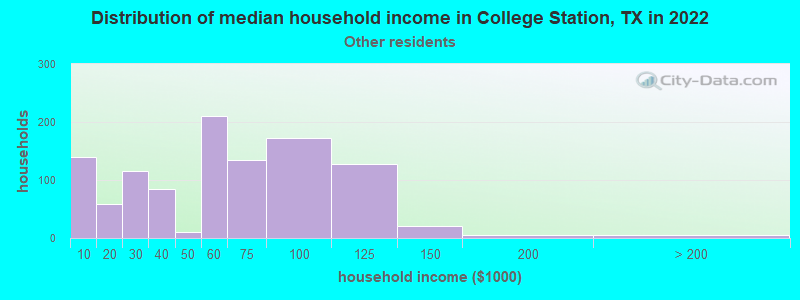
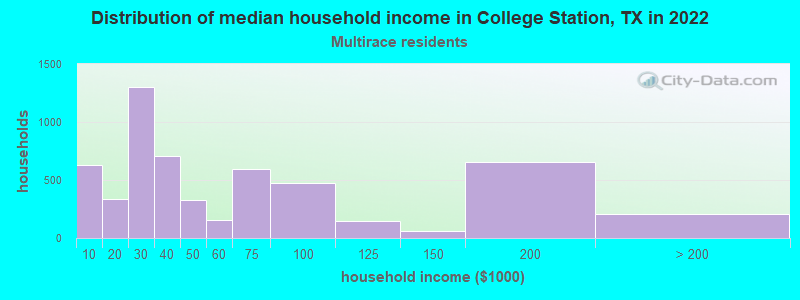
Income and house value in College Station Median household income in 2022 $58,193 White non-Hispanic householders$33,786 Black householders$9,491 American Indian and Alaska Native householders$53,411 Asian householders$71,939 Some other race householders$40,387 Two or more races householders$46,631 Hispanic or Latino race householdersMedian 2022 house value $347,447 White Non-Hispanic householders$197,887 Black or African American householders$315,705 American Indian or Alaska Native householders $427,803 Asian householders$241,640 Some other race householders$305,696 Two or more races householders$258,798 Hispanic or Latino householders
Median age by race in College Station
22.8 Median age for White residents22.6 23.1 23.6 Median age for Black or African American residents22.9 24.3 22.8 Median age for American Indian / Alaska Native residents22.7 23.2 24.6 Median age for Asian residents25.1 24.3 4.2 Median age for Native Hawaiian / Pacific Islander residents-666,666,666.0 4.2 27.3 Median age for Other race residents31.3 25.2 21.6 Median age for Two or more races residents22.2 21.0 23.0 Median age for White alone residents22.8 23.3 21.5 Median age for Hispanic or Latino residents22.2 21.1
Owner/renter occupied households by race in College Station
House owners and renters - White residents 11,966 38.5% Owner occupied19,080 61.5% Renter occupiedHouse owners and renters - Black or African American residents 206 4.9% Owner occupied3,966 95.1% Renter occupiedHouse owners and renters - American Indian / Alaska Native residents 18 12.4% Owner occupied128 87.6% Renter occupiedHouse owners and renters - Asian residents 1,278 41.5% Owner occupied1,805 58.5% Renter occupiedHouse owners and renters - Native Hawaiian / Pacific Islander residents 11 11.9% Owner occupied80 88.1% Renter occupiedHouse owners and renters - Other race residents 443 34.1% Owner occupied857 65.9% Renter occupiedHouse owners and renters - Two or more races residents 1,192 21.4% Owner occupied4,373 78.6% Renter occupiedHouse owners and renters - White alone residents 11,424 39.9% Owner occupied17,211 60.1% Renter occupiedHouse owners and renters - Hispanic or Latino residents 1,612 23.1% Owner occupied5,372 76.9% Renter occupied
Language usage in College Station
English speakers - Total 78.3% of residents of College Station speak English at home.
10.5% of residents speak Spanish at home 9,440 76.8% Speak English very well2,846 23.2% Speak English less than very well11.3% of residents speak other language at home 10,063 76.0% Speak English very well3,179 24.0% Speak English less than very well
English speakers - Born in the United States 90.4% of residents of College Station speak English at home.
3.9% of residents speak Spanish at home 1,076 100.0% Speak English very well5.8% of residents speak other language at home 1,475 91.3% Speak English very well140 8.7% Speak English less than very well
English speakers - Native, born elsewhere 80.0% of residents of College Station speak English at home.
8.8% of residents speak Spanish at home 102 56.0% Speak English very well80 44.0% Speak English less than very well11.3% of residents speak other language at home 234 100.0% Speak English very well
English speakers - Foreign-born 11.4% of residents of College Station speak English at home.
29.1% of residents speak Spanish at home 2,696 57.6% Speak English very well1,985 42.4% Speak English less than very well59.4% of residents speak other language at home 6,670 69.9% Speak English very well2,873 30.1% Speak English less than very well
White (Caucasian) - Speak only English Native:
94.9% (68,405)Foreign-born:
16.2% (568)
White (Caucasian) - Speak another language Native:
5.1% (3,711)Foreign-born:
83.8% (2,934)
Black or African American - Speak only English Native:
97.1% (7,468)Foreign-born:
38.2% (202)
Black or African American - Speak another language Native:
3.0% (230)Foreign-born:
63.4% (335)
American Indian / Alaska Native - Speak another language Native:
58.4% (269)Foreign-born:
98.9% (29)
Asian - Speak only English Native:
51.0% (1,860)Foreign-born:
8.0% (591)
Asian - Speak another language Native:
49.0% (1,786)Foreign-born:
92.0% (6,795)
Other race - Speak another language Native:
61.3% (1,142)Foreign-born:
100.0% (1,310)
Two or more races - Speak only English Native:
70.0% (9,225)Foreign-born:
12.8% (423)
Two or more races - Speak another language Native:
30.0% (3,945)Foreign-born:
87.2% (2,887)
White alone - Speak only English Native:
97.4% (65,694)Foreign-born:
20.7% (499)
White alone - Speak another language Native:
2.6% (1,765)Foreign-born:
79.3% (1,906)
Hispanic or Latino - Speak only English Native:
58.5% (9,163)Foreign-born:
4.1% (194)
Hispanic or Latino - Speak another language Native:
41.5% (6,502)Foreign-born:
95.9% (4,580)
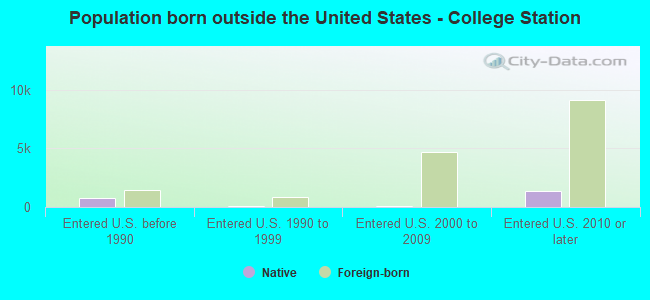
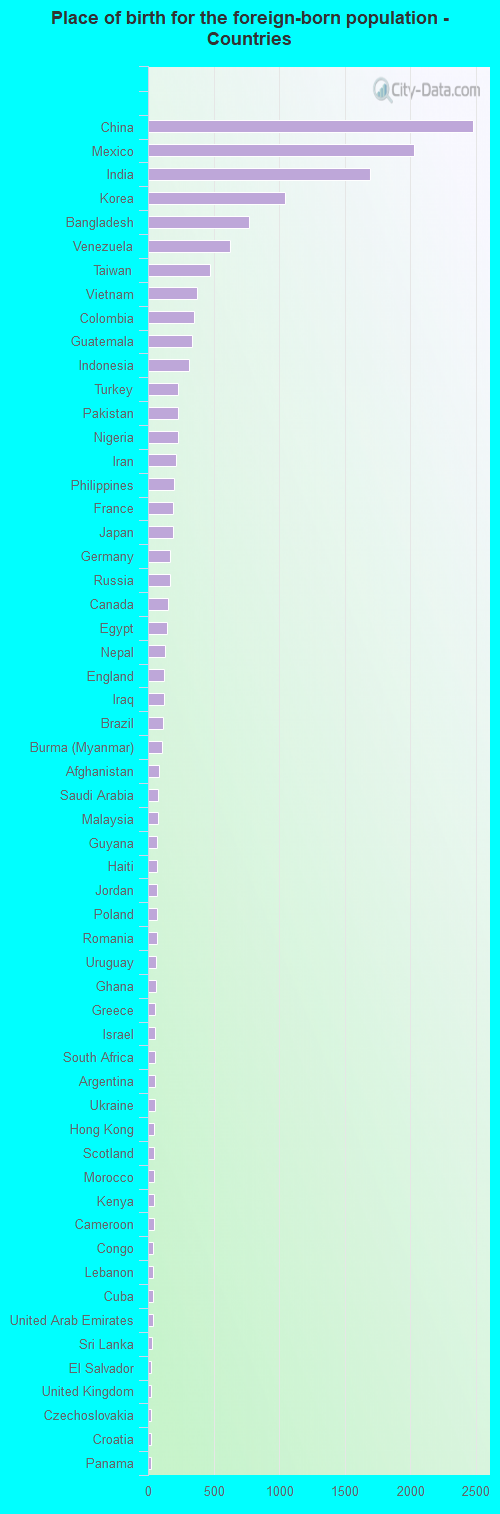
Foreign-born residents in College Station 15,241 residents are foreign born (7.4% Asia , 3.2% Latin America ).
This city:
12.3%Texas:
17.1%
Marital status for residents in College Station Marital status - White (Caucasian) population 15 years and over
Males 66.5% Never married27.3% Now married0.3% Separated0.4% Widowed5.5% DivorcedFemales 57.3% Never married30.4% Now married2.1% Separated4.0% Widowed6.1% DivorcedWomen who gave birth in the past 12 months Now married:
74.7% (349)Unmarried:
25.3% (118)
Women who did not give birth in the past 12 months Now married:
24.1% (6,039)Unmarried:
75.9% (19,005)
Marital status - Black or African American population 15 years and over
Males 63.0% Never married31.8% Now married0.6% Separated0.5% Widowed4.1% DivorcedFemales 62.2% Never married20.0% Now married2.4% Separated5.2% Widowed10.3% DivorcedWomen who gave birth in the past 12 months Now married:
29.9% (104)Unmarried:
70.1% (244)
Women who did not give birth in the past 12 months Now married:
22.3% (768)Unmarried:
77.7% (2,677)
Marital status - American Indian / Alaska Native population 15 years and over
Males 64.9% Never married19.1% Now married0.0% Separated0.0% Widowed16.0% DivorcedFemales 56.0% Never married29.3% Now married0.0% Separated14.7% Widowed0.0% DivorcedWomen who did not give birth in the past 12 months Now married:
19.5% (37)Unmarried:
80.5% (153)
Marital status - Asian population 15 years and over
Males 57.7% Never married39.5% Now married0.2% Separated0.4% Widowed2.2% DivorcedFemales 51.7% Never married44.3% Now married0.0% Separated1.6% Widowed2.4% DivorcedWomen who gave birth in the past 12 months Now married:
100.0% (35)Unmarried:
0.0% (0)
Women who did not give birth in the past 12 months Now married:
43.3% (1,714)Unmarried:
56.7% (2,242)
Marital status - Native Hawaiian / Pacific Islander population 15 years and over
Males 0.0% Never married100.0% Now married0.0% Separated0.0% Widowed0.0% DivorcedFemales 0.0% Never married36.6% Now married0.0% Separated63.4% Widowed0.0% DivorcedWomen who did not give birth in the past 12 months Now married:
100.0% (25)Unmarried:
0.0% (0)
Marital status - Other race population 15 years and over
Males 70.4% Never married22.8% Now married3.1% Separated0.0% Widowed3.7% DivorcedFemales 45.8% Never married47.0% Now married0.0% Separated1.4% Widowed5.7% DivorcedWomen who did not give birth in the past 12 months Now married:
43.0% (496)Unmarried:
57.0% (656)
Marital status - Two or more races population 15 years and over
Males 69.6% Never married25.9% Now married3.1% Separated0.9% Widowed0.4% DivorcedFemales 67.3% Never married22.1% Now married1.2% Separated0.8% Widowed8.6% DivorcedWomen who gave birth in the past 12 months Now married:
25.7% (153)Unmarried:
74.3% (442)
Women who did not give birth in the past 12 months Now married:
17.9% (980)Unmarried:
82.1% (4,485)
Marital status - White alone, not Hispanic / Latino population 15 years and over
Males 65.1% Never married28.4% Now married0.3% Separated0.5% Widowed5.7% DivorcedFemales 56.2% Never married31.1% Now married2.3% Separated3.8% Widowed6.5% DivorcedWomen who gave birth in the past 12 months Now married:
71.4% (294)Unmarried:
28.6% (118)
Women who did not give birth in the past 12 months Now married:
24.1% (5,419)Unmarried:
75.9% (17,046)
Marital status - Hispanic or Latino population 15 years and over
Males 71.8% Never married24.3% Now married2.4% Separated0.0% Widowed1.5% DivorcedFemales 66.7% Never married23.6% Now married0.5% Separated0.9% Widowed8.3% DivorcedWomen who gave birth in the past 12 months Now married:
11.1% (55)Unmarried:
88.9% (442)
Women who did not give birth in the past 12 months Now married:
19.1% (1,471)Unmarried:
80.9% (6,238)
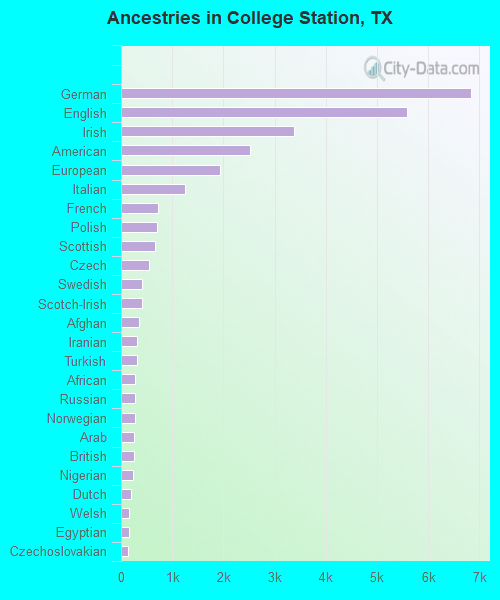
Ancestries in College Station
6,849 11.3% German5,586 9.2% English3,375 5.6% Irish2,512 4.2% American1,942 3.2% European1,256 2.1% Italian719 1.2% French702 1.2% Polish655 1.1% Scottish541 0.9% Czech410 0.7% Swedish404 0.7% Scotch-Irish350 0.6% Afghan319 0.5% Iranian309 0.5% Turkish272 0.5% African267 0.4% Russian265 0.4% Norwegian260 0.4% Arab249 0.4% British236 0.4% Nigerian198 0.3% Dutch166 0.3% Welsh149 0.2% Egyptian138 0.2% Czechoslovakian134 0.2% French Canadian130 0.2% Palestinian118 0.2% Lebanese101 0.2% Greek97 0.2% Portuguese82 0.1% Ukrainian80 0.1% Haitian75 0.1% Scandinavian75 0.1% Danish72 0.1% Eastern European65 0.1% Hungarian64 0.1% Finnish61 0.1% Northern European61 0.1% German Russian54 0.09% Canadian51 0.08% Romanian45 0.07% Jordanian44 0.07% Kenyan38 0.06% Croatian37 0.06% Ghanaian32 0.05% Israeli29 0.05% Somali25 0.04% Brazilian23 0.04% Slovene23 0.04% Jamaican19 0.03% Serbian18 0.03% Lithuanian18 0.03% Ethiopian16 0.03% Yugoslavian15 0.02% Belgian15 0.02% Austrian14 0.02% Guyanese11 0.02% Cajun9 0.01% Slavic7 0.01% Swiss7 0.01% Iraqi
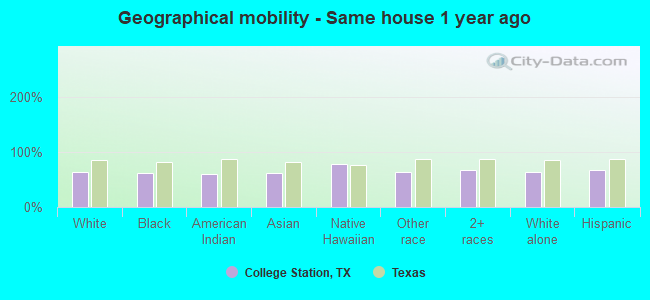
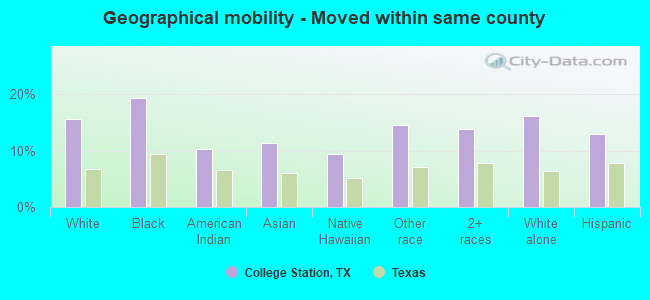
Geographical mobility in College Station Same house 1 year ago 49,203 63.1% White (Caucasian)7,065 61.4% Black or African American329 60.6% American Indian / Alaska Native7,154 62.7% Asian123 77.6% Native Hawaiian / Pacific Islander3,029 64.0% Other race11,592 68.1% Two or more races45,730 63.3% White alone, not Hispanic / Latino14,306 66.9% Hispanic or LatinoMoved within same county 12,193 15.6% White / Caucasian2,228 19.4% Black or African American56 10.3% American Indian / Alaska Native1,285 11.3% Asian15 9.3% Native Hawaiian / Pacific Islander689 14.6% Other race2,347 13.8% Two or more races11,691 16.2% White alone, not Hispanic / Latino2,754 12.9% Hispanic or LatinoMoved within same state 13,542 17.4% White / Caucasian310 2.7% Black or African American111 20.5% American Indian / Alaska Native1,564 13.7% Asian676 14.3% Other race2,505 14.7% Two or more races11,763 16.3% White alone, not Hispanic / Latino3,980 18.6% Hispanic or LatinoMoved from different state 2,408 3.1% White / Caucasian1,835 16.0% Black or African American28 5.3% American Indian / Alaska Native1,009 8.8% Asian68 1.4% Other race511 3.0% Two or more races2,408 3.3% White alone, not Hispanic / Latino243 1.1% Hispanic or LatinoMoved from abroad 637 0.8% White64 0.6% Black or African American393 3.4% Asian594 12.6% Other race69 0.4% Two or more races637 0.9% White alone, not Hispanic / Latino100 0.5% Hispanic or Latino
Children Nativity (place of birth) in College Station
Children under 6 years - Living with two parents Both parents native 3,678 100.0% NativeBoth parents foreign-born 821 96.7% Native28 3.3% Foreign-bornOne native, one foreign-born parent 219 100.0% NativeChildren under 6 years - Living with one parent Native parent 1,949 100.0% NativeForeign-born parent 76 44.6% Native94 55.4% Foreign-bornChildren 6 to 17 years - Living with two parents Both parents native 6,345 100.0% NativeBoth parents foreign-born 2,530 85.6% Native425 14.4% Foreign-bornOne native, one foreign-born parent 412 100.0% NativeChildren 6 to 17 years - Living with one parent Native parent 2,926 100.0% NativeForeign-born parent 351 56.2% Native274 43.8% Foreign-born
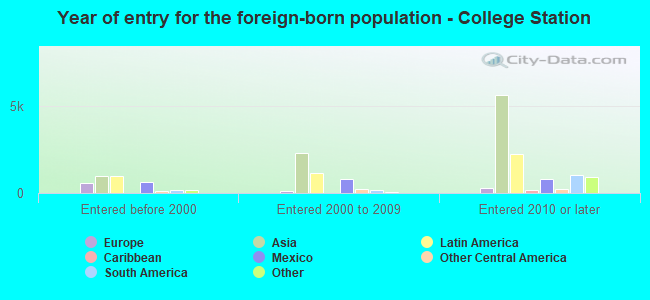
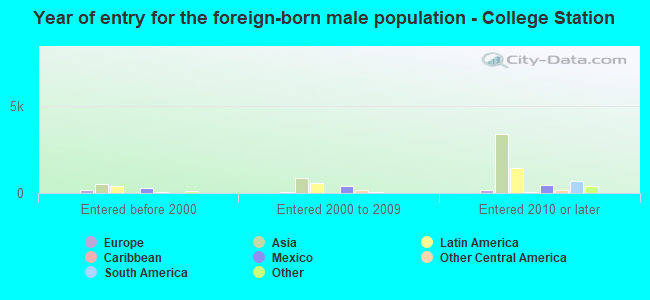
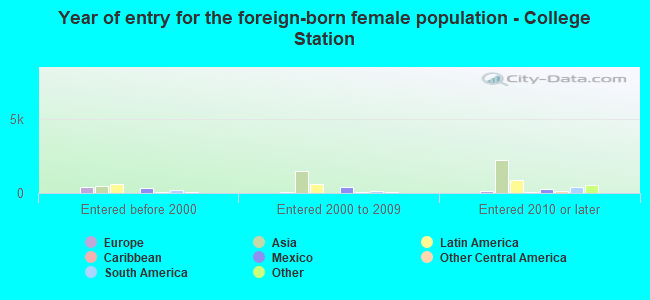
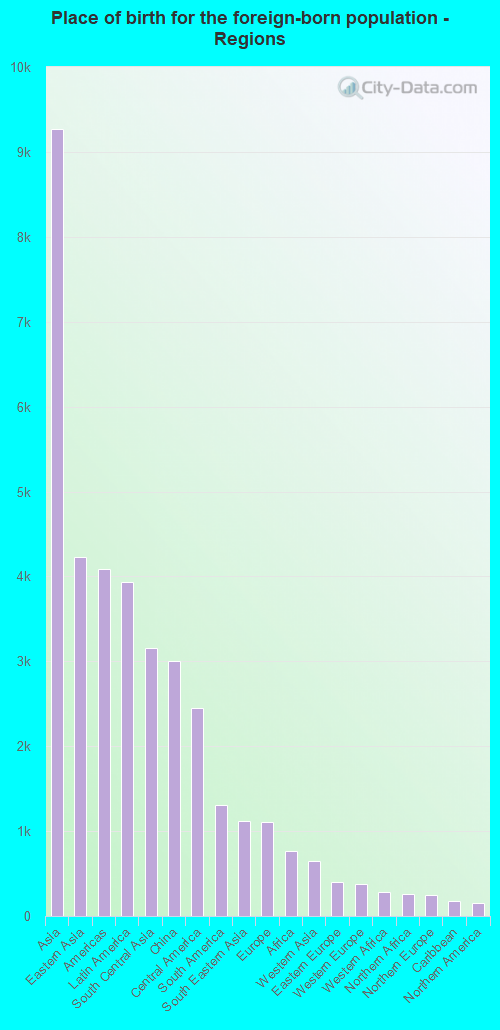
Place of birth for residents in College Station 9,264 Asia4,233 Eastern Asia4,090 Americas3,937 Latin America3,151 South Central Asia2,999 China2,446 Central America1,308 South America1,119 South Eastern Asia1,102 Europe766 Africa653 Western Asia401 Eastern Europe380 Western Europe283 Western Africa262 Northern Africa245 Northern Europe181 Caribbean153 Northern America84 Middle Africa82 Eastern Africa75 Southern Europe52 Southern Africa16 Oceania16 Australia and New Zealand Subregion2,476 China2,030 Mexico1,694 India1,043 Korea773 Bangladesh622 Venezuela472 Taiwan373 Vietnam354 Colombia334 Guatemala309 Indonesia226 Turkey226 Pakistan225 Nigeria211 Iran200 Philippines193 France190 Japan170 Germany169 Russia153 Canada147 Egypt129 Nepal121 England119 Iraq118 Brazil106 Burma (Myanmar)81 Afghanistan79 Saudi Arabia79 Malaysia72 Guyana71 Haiti70 Jordan66 Poland65 Romania60 Uruguay58 Ghana54 Greece52 Israel52 South Africa51 Argentina50 Ukraine49 Hong Kong47 Scotland46 Morocco45 Kenya43 Cameroon41 Congo37 Lebanon37 Cuba35 United Arab Emirates34 Sri Lanka26 El Salvador26 United Kingdom24 Czechoslovakia23 Croatia23 Panama21 Peru20 Singapore20 Jamaica19 Thailand17 Honduras17 Norway16 Somalia16 Australia15 Netherlands13 Costa Rica13 Zimbabwe12 Spain9 Laos8 Italy7 Bolivia
Grandparents responsible for own grandchildren in College Station
Grandparents (30 to 59 years) White / Caucasian 86 43.1% Responsible for grandchildren114 56.9% Not responsible for grandchildrenBlack or African American 40 100.0% Responsible for grandchildrenAsian 32 100.0% Responsible for grandchildrenOther race 15 100.0% Responsible for grandchildrenTwo or more races 26 100.0% Responsible for grandchildrenWhite alone, not Hispanic / Latino 113 38.7% Responsible for grandchildren179 61.3% Not responsible for grandchildrenHispanic or Latino 16 100.0% Responsible for grandchildrenGrandparents (60 years and over) White / Caucasian 177 65.1% Responsible for grandchildren95 34.9% Not responsible for grandchildrenBlack or African American 9 43.7% Responsible for grandchildren12 56.3% Not responsible for grandchildrenAsian 19 100.0% Not responsible for grandchildrenTwo or more races 20 19.1% Responsible for grandchildren83 80.9% Not responsible for grandchildrenWhite alone, not Hispanic / Latino 210 64.2% Responsible for grandchildren117 35.8% Not responsible for grandchildrenHispanic or Latino 59 100.0% Not responsible for grandchildren