Races in Cornwall, Vermont (VT) Detailed Stats
Ancestries, Foreign-born residents, place of birth

Recent posts about races in Cornwall, Vermont on our local forum with over 2,400,000 registered users:
 | Vermont Weather (3778 replies) |
| Does Vermont want another out-of-stater? (129 replies) |
| Canadian transplanting to the US... (7 replies) |
| The COST of living in Vermont (108 replies) |
| Thoughts on living in Ferrisburg? (3 replies) |
| Discouraged!... but hopeful...Today show...anyone see it? (27 replies) |
Latest news about races in Cornwall, VT collected exclusively by city-data.com from local newspapers, TV, and radio stations
3.5% of Cornwall, VT residents are foreign-born (1.9% born in Europe, 1.1% born in North America), which is 13.6% less than the foreign-born rate of 4.0% across the entire state of Vermont.
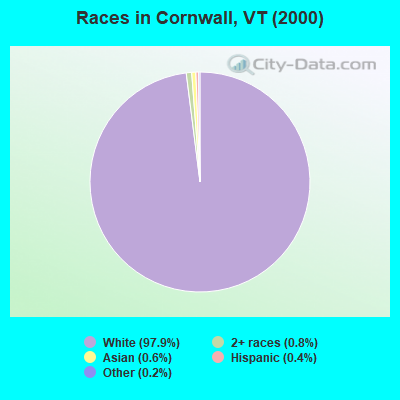
Race distribution in Cornwall

- 1,11297.9%White alone
- 90.8%Two or more races
- 70.6%Asian alone
- 50.4%Hispanic
- 20.2%Other race alone
- 10.09%Black alone
2000
2022
-
- 585,43196.2%White alone
- 6,8091.1%Two or more races
- 5,5040.9%Hispanic
- 5,1600.8%Asian alone
- 2,9210.5%Black alone
- 2,3250.4%American Indian alone
- 5570.09%Other race alone
- 1200.02%Native Hawaiian and Other
Pacific Islander alone

-
- 583,54690.2%White alone
- 27,3404.2%Two or more races
- 14,7702.3%Hispanic
- 11,5121.8%Asian alone
- 6,2641.0%Black alone
- 2,5210.4%Other race alone
- 1,0520.2%American Indian alone
- 590.01%Native Hawaiian and Other
Pacific Islander alone

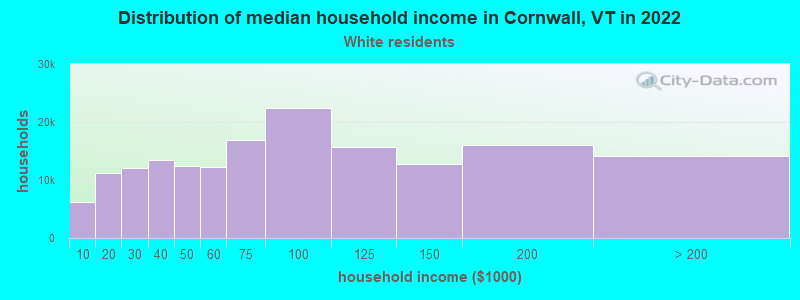
Income and house value in Cornwall
- Median household income in 2022
- $94,655White non-Hispanic householders
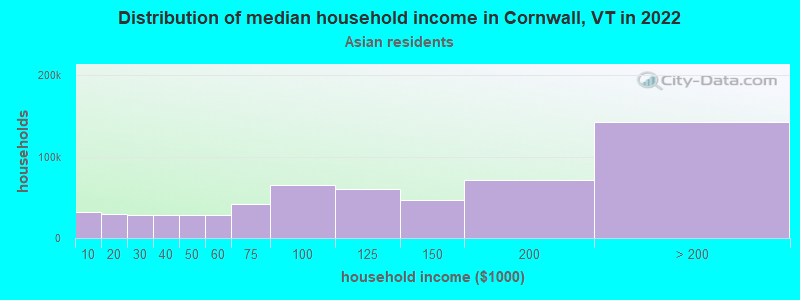
- $8,188Asian householders
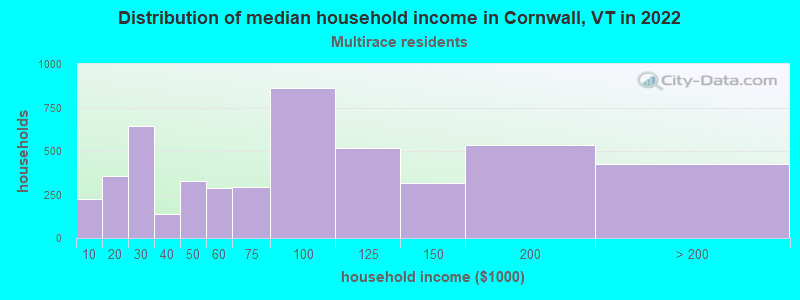
- $23,730Two or more races householders
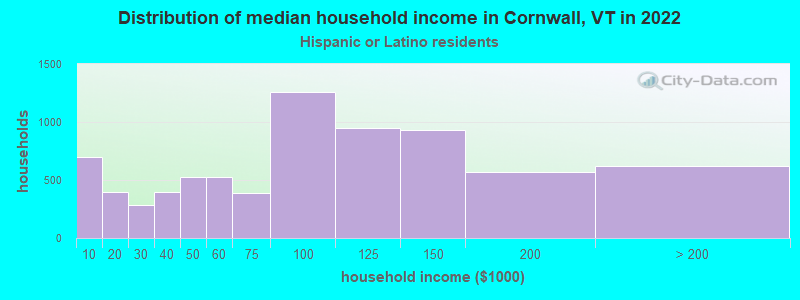
- $114,720Hispanic or Latino race householders
- Median 2022 house value
- $425,389White Non-Hispanic householders
Household income for White non-Hispanic householders
Household income for Asian householders
Household income for Two or more races householders
Household income for Hispanic or Latino race householders
Foreign-born residents in Cornwall
40 residents are foreign born (1.9% Europe, 1.1% North America).
| This city: | 3.5% |
| Vermont: | 3.8% |
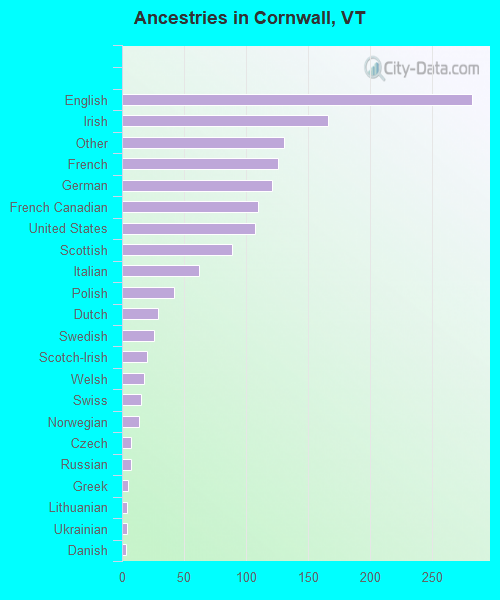
Ancestries in Cornwall

- 28220.3%English
- 16612.0%Irish
- 1319.4%Other
- 1269.1%French
- 1218.7%German
- 1107.9%French Canadian
- 1077.7%United States
- 896.4%Scottish
- 624.5%Italian
- 423.0%Polish
- 292.1%Dutch
- 261.9%Swedish
- 201.4%Scotch-Irish
- 181.3%Welsh
- 151.1%Swiss
- 141.0%Norwegian
- 70.5%Czech
- 70.5%Russian
- 50.4%Greek
- 40.3%Lithuanian
- 40.3%Ukrainian
- 30.2%Danish
- 10.07%Hungarian
Zip codes: 05753.