Races in Coronado, California (CA) Detailed Stats
Data:
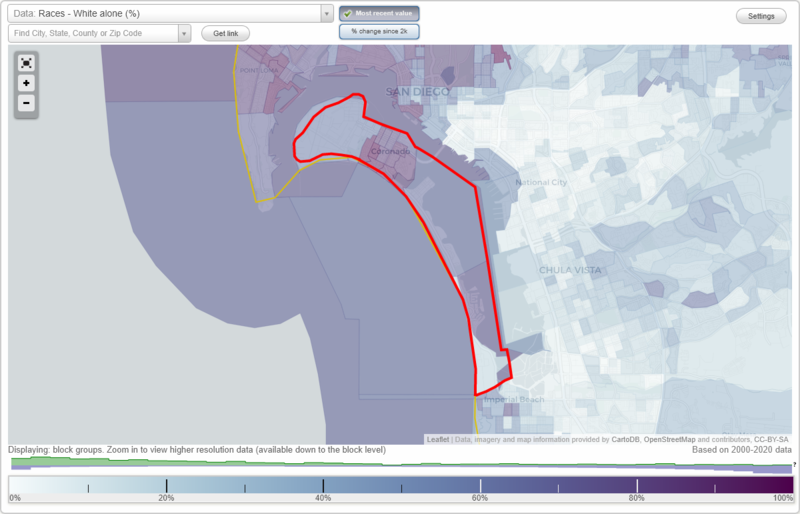
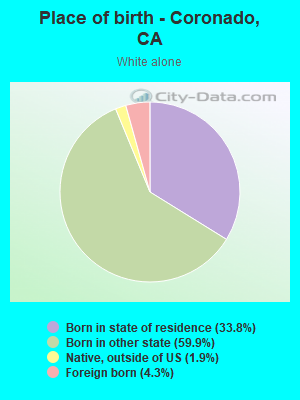
Races - White alone (%)
Races - White alone (% change since 2000)
Races - Black alone (%)
Races - Black alone (% change since 2000)
Races - American Indian alone (%)
Races - American Indian alone (% change since 2000)
Races - Asian alone (%)
Races - Asian alone (% change since 2000)
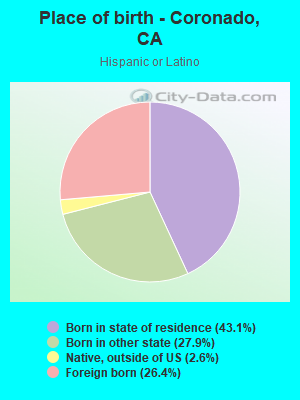
Races - Hispanic (%)
Races - Hispanic (% change since 2000)
Races - Native Hawaiian and Other Pacific Islander alone (%)
Races - Native Hawaiian and Other Pacific Islander alone (% change since 2000)
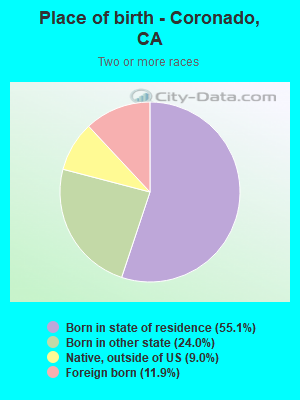
Races - Two or more races(%)
Races - Two or more races(% change since 2000)
Races - Other race alone (%)
Races - Other race alone (% change since 2000)
Racial diversity
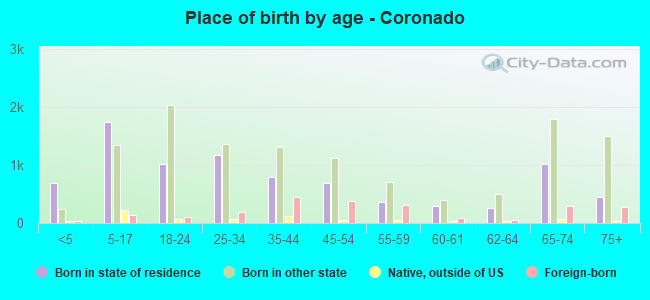
Place of birth - Born in state of residence (%)
Place of birth - Born in state of residence (%) - White
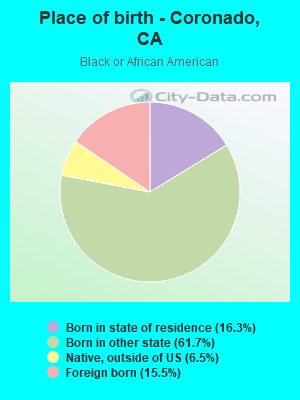
Place of birth - Born in state of residence (%) - Black or African American
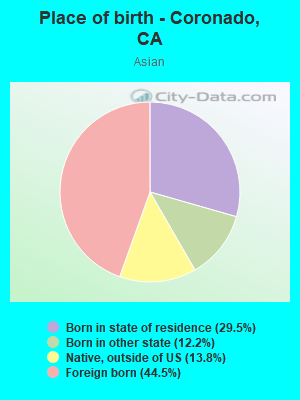
Place of birth - Born in state of residence (%) - Asian
Place of birth - Born in state of residence (%) - Hispanic or Latino
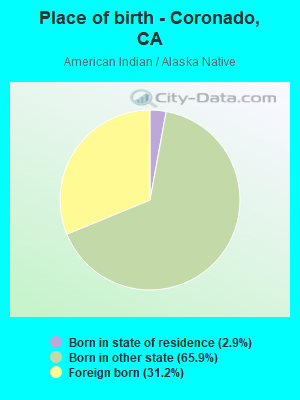
Place of birth - Born in state of residence (%) - American Indian and Alaska Native
Place of birth - Born in state of residence (%) - Multirace
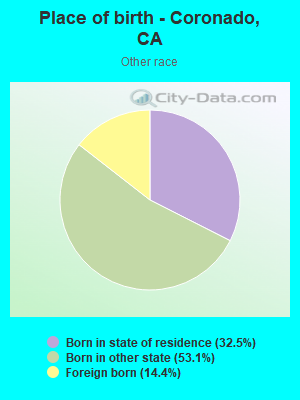
Place of birth - Born in state of residence (%) - Other Race
Place of birth - Born in other state (%)
Place of birth - Born in other state (%) - White
Place of birth - Born in other state (%) - Black or African American
Place of birth - Born in other state (%) - Asian
Place of birth - Born in other state (%) - Hispanic or Latino
Place of birth - Born in other state (%) - American Indian and Alaska Native
Place of birth - Born in other state (%) - Multirace
Place of birth - Born in other state (%) - Other Race
Place of birth - Native, outside of US (%)
Place of birth - Native, outside of US (%) - White
Place of birth - Native, outside of US (%) - Black or African American
Place of birth - Native, outside of US (%) - Asian
Place of birth - Native, outside of US (%) - Hispanic or Latino
Place of birth - Native, outside of US (%) - American Indian and Alaska Native
Place of birth - Native, outside of US (%) - Multirace
Place of birth - Native, outside of US (%) - Other Race
Place of birth - Foreign born (%)
Place of birth - Foreign born (%) - White
Place of birth - Foreign born (%) - Black or African American
Place of birth - Foreign born (%) - Asian
Place of birth - Foreign born (%) - Hispanic or Latino
Place of birth - Foreign born (%) - American Indian and Alaska Native
Place of birth - Foreign born (%) - Multirace
Place of birth - Foreign born (%) - Other Race
Residents speaking English at home (%)
Residents speaking English at home - Born in the United States (%)
Residents speaking English at home - Native, born elsewhere (%)
Residents speaking English at home - Foreign born (%)
Residents speaking Spanish at home (%)
Residents speaking Spanish at home - Born in the United States (%)
Residents speaking Spanish at home - Native, born elsewhere (%)
Residents speaking Spanish at home - Foreign born (%)
Residents speaking other language at home (%)
Residents speaking other language at home - Born in the United States (%)
Residents speaking other language at home - Native, born elsewhere (%)
Residents speaking other language at home - Foreign born (%)
Marital status - Never married (%)
Marital status - Now married (%)
Marital status - Separated (%)
Marital status - Widowed (%)
Marital status - Divorced (%)
Ancestries Reported - Arab (%)
Ancestries Reported - Czech (%)
Ancestries Reported - Danish (%)
Ancestries Reported - Dutch (%)
Ancestries Reported - English (%)
Ancestries Reported - French (%)
Ancestries Reported - French Canadian (%)
Ancestries Reported - German (%)
Ancestries Reported - Greek (%)
Ancestries Reported - Hungarian (%)
Ancestries Reported - Irish (%)
Ancestries Reported - Italian (%)
Ancestries Reported - Lithuanian (%)
Ancestries Reported - Norwegian (%)
Ancestries Reported - Polish (%)
Ancestries Reported - Portuguese (%)
Ancestries Reported - Russian (%)
Ancestries Reported - Scotch-Irish (%)
Ancestries Reported - Scottish (%)
Ancestries Reported - Slovak (%)
Ancestries Reported - Subsaharan African (%)
Ancestries Reported - Swedish (%)
Ancestries Reported - Swiss (%)
Ancestries Reported - Ukrainian (%)
Ancestries Reported - United States (%)
Ancestries Reported - Welsh (%)
Ancestries Reported - West Indian (%)
Ancestries Reported - Other (%)
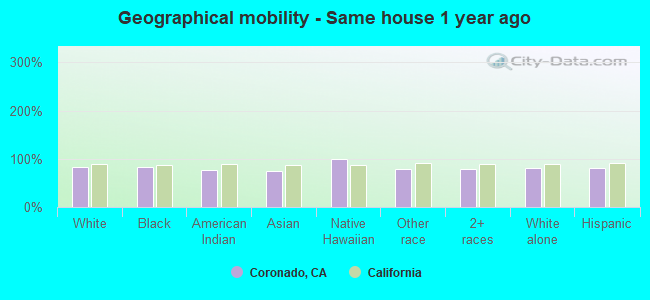
Geographical mobility - Same house 1 year ago (%)
Geographical mobility - Same house 1 year ago (%) - White
Geographical mobility - Same house 1 year ago (%) - Black or African American
Geographical mobility - Same house 1 year ago (%) - Asian
Geographical mobility - Same house 1 year ago (%) - Hispanic or Latino
Geographical mobility - Same house 1 year ago (%) - American Indian and Alaska Native
Geographical mobility - Same house 1 year ago (%) - Multirace
Geographical mobility - Same house 1 year ago (%) - Other Race
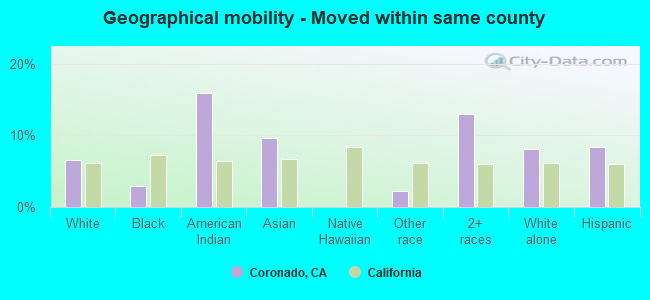
Geographical mobility - Moved within same county (%)
Geographical mobility - Moved within same county (%) - White
Geographical mobility - Moved within same county (%) - Black or African American
Geographical mobility - Moved within same county (%) - Asian
Geographical mobility - Moved within same county (%) - Hispanic or Latino
Geographical mobility - Moved within same county (%) - American Indian and Alaska Native
Geographical mobility - Moved within same county (%) - Multirace
Geographical mobility - Moved within same county (%) - Other Race
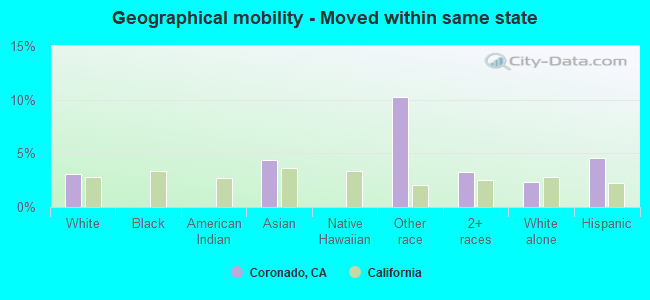
Geographical mobility - Moved from different county within same state (%)
Geographical mobility - Moved from different county within same state (%) - White
Geographical mobility - Moved from different county within same state (%) - Black or African American
Geographical mobility - Moved from different county within same state (%) - Asian
Geographical mobility - Moved from different county within same state (%) - Hispanic or Latino
Geographical mobility - Moved from different county within same state (%) - American Indian and Alaska Native
Geographical mobility - Moved from different county within same state (%) - Multirace
Geographical mobility - Moved from different county within same state (%) - Other Race
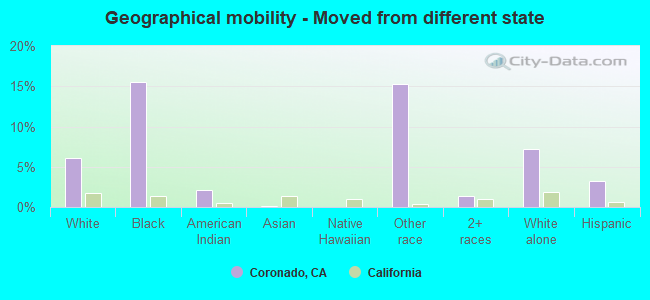
Geographical mobility - Moved from different state (%)
Geographical mobility - Moved from different state (%) - White
Geographical mobility - Moved from different state (%) - Black or African American
Geographical mobility - Moved from different state (%) - Asian
Geographical mobility - Moved from different state (%) - Hispanic or Latino
Geographical mobility - Moved from different state (%) - American Indian and Alaska Native
Geographical mobility - Moved from different state (%) - Multirace
Geographical mobility - Moved from different state (%) - Other Race
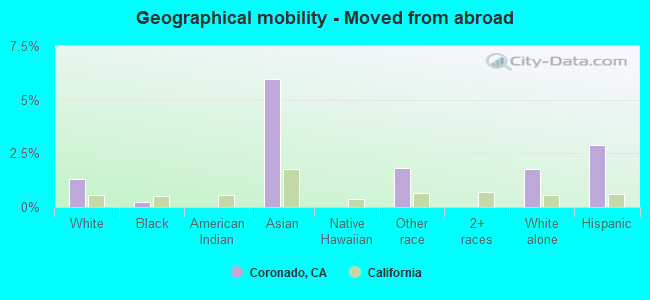
Geographical mobility - Moved from abroad (%)
Geographical mobility - Moved from abroad (%) - White
Geographical mobility - Moved from abroad (%) - Black or African American
Geographical mobility - Moved from abroad (%) - Asian
Geographical mobility - Moved from abroad (%) - Hispanic or Latino
Geographical mobility - Moved from abroad (%) - American Indian and Alaska Native
Geographical mobility - Moved from abroad (%) - Multirace
Geographical mobility - Moved from abroad (%) - Other Race
Place of birth for the foreign-born population - Ireland (%)
Place of birth for the foreign-born population - Denmark (%)
Place of birth for the foreign-born population - Norway (%)
Place of birth for the foreign-born population - Sweden (%)
Place of birth for the foreign-born population - United Kingdom (%)
Place of birth for the foreign-born population - England (%)
Place of birth for the foreign-born population - Scotland (%)
Place of birth for the foreign-born population - Other Northern Europe (%)
Place of birth for the foreign-born population - Austria (%)
Place of birth for the foreign-born population - Belgium (%)
Place of birth for the foreign-born population - France (%)
Place of birth for the foreign-born population - Germany (%)
Place of birth for the foreign-born population - Netherlands (%)
Place of birth for the foreign-born population - Switzerland (%)
Place of birth for the foreign-born population - Other Western Europe (%)
Place of birth for the foreign-born population - Greece (%)
Place of birth for the foreign-born population - Italy (%)
Place of birth for the foreign-born population - Portugal (%)
Place of birth for the foreign-born population - Spain (%)
Place of birth for the foreign-born population - Other Southern Europe (%)
Place of birth for the foreign-born population - Albania (%)
Place of birth for the foreign-born population - Belarus (%)
Place of birth for the foreign-born population - Bosnia and Herzegovina (%)
Place of birth for the foreign-born population - Bulgaria (%)
Place of birth for the foreign-born population - Croatia (%)
Place of birth for the foreign-born population - Czechoslovakia (%)
Place of birth for the foreign-born population - Hungary (%)
Place of birth for the foreign-born population - Latvia (%)
Place of birth for the foreign-born population - Lithuania (%)
Place of birth for the foreign-born population - North Macedonia (Macedonia) (%)
Place of birth for the foreign-born population - Moldova (%)
Place of birth for the foreign-born population - Poland (%)
Place of birth for the foreign-born population - Romania (%)
Place of birth for the foreign-born population - Russia (%)
Place of birth for the foreign-born population - Serbia (%)
Place of birth for the foreign-born population - Ukraine (%)
Place of birth for the foreign-born population - Other Eastern Europe (%)
Place of birth for the foreign-born population - China (%)
Place of birth for the foreign-born population - Hong Kong (%)
Place of birth for the foreign-born population - Taiwan (%)
Place of birth for the foreign-born population - Japan (%)
Place of birth for the foreign-born population - Korea (%)
Place of birth for the foreign-born population - Other Eastern Asia (%)
Place of birth for the foreign-born population - Afghanistan (%)
Place of birth for the foreign-born population - Bangladesh (%)
Place of birth for the foreign-born population - India (%)
Place of birth for the foreign-born population - Iran (%)
Place of birth for the foreign-born population - Kazakhstan (%)
Place of birth for the foreign-born population - Nepal (%)
Place of birth for the foreign-born population - Pakistan (%)
Place of birth for the foreign-born population - Sri Lanka (%)
Place of birth for the foreign-born population - Uzbekistan (%)
Place of birth for the foreign-born population - Other South Central Asia (%)
Place of birth for the foreign-born population - Burma (%)
Place of birth for the foreign-born population - Cambodia (%)
Place of birth for the foreign-born population - Indonesia (%)
Place of birth for the foreign-born population - Laos (%)
Place of birth for the foreign-born population - Malaysia (%)
Place of birth for the foreign-born population - Philippines (%)
Place of birth for the foreign-born population - Singapore (%)
Place of birth for the foreign-born population - Thailand (%)
Place of birth for the foreign-born population - Vietnam (%)
Place of birth for the foreign-born population - Other South Eastern Asia (%)
Place of birth for the foreign-born population - Armenia (%)
Place of birth for the foreign-born population - Iraq (%)
Place of birth for the foreign-born population - Israel (%)
Place of birth for the foreign-born population - Jordan (%)
Place of birth for the foreign-born population - Kuwait (%)
Place of birth for the foreign-born population - Lebanon (%)
Place of birth for the foreign-born population - Saudi Arabia (%)
Place of birth for the foreign-born population - Syria (%)
Place of birth for the foreign-born population - Turkey (%)
Place of birth for the foreign-born population - Yemen (%)
Place of birth for the foreign-born population - Other Western Asia (%)
Place of birth for the foreign-born population - Eritrea (%)
Place of birth for the foreign-born population - Ethiopia (%)
Place of birth for the foreign-born population - Kenya (%)
Place of birth for the foreign-born population - Somalia (%)
Place of birth for the foreign-born population - Uganda (%)
Place of birth for the foreign-born population - Zimbabwe (%)
Place of birth for the foreign-born population - Other Eastern Africa (%)
Place of birth for the foreign-born population - Cameroon (%)
Place of birth for the foreign-born population - Congo (%)
Place of birth for the foreign-born population - Democratic Republic of Congo (Zaire) (%)
Place of birth for the foreign-born population - Other Middle Africa (%)
Place of birth for the foreign-born population - Egypt (%)
Place of birth for the foreign-born population - Morocco (%)
Place of birth for the foreign-born population - Sudan (%)
Place of birth for the foreign-born population - Other Northern Africa (%)
Place of birth for the foreign-born population - South Africa (%)
Place of birth for the foreign-born population - Other Southern Africa (%)
Place of birth for the foreign-born population - Cabo Verde (%)
Place of birth for the foreign-born population - Ghana (%)
Place of birth for the foreign-born population - Liberia (%)
Place of birth for the foreign-born population - Nigeria (%)
Place of birth for the foreign-born population - Senegal (%)
Place of birth for the foreign-born population - Sierra Leone (%)
Place of birth for the foreign-born population - Other Western Africa (%)
Place of birth for the foreign-born population - Australia (%)
Place of birth for the foreign-born population - New Zealand (%)
Place of birth for the foreign-born population - Fiji (%)
Place of birth for the foreign-born population - Micronesia (%)
Place of birth for the foreign-born population - Bahamas (%)
Place of birth for the foreign-born population - Barbados (%)
Place of birth for the foreign-born population - Cuba (%)
Place of birth for the foreign-born population - Dominica (%)
Place of birth for the foreign-born population - Dominican Republic (%)
Place of birth for the foreign-born population - Grenada (%)
Place of birth for the foreign-born population - Haiti (%)
Place of birth for the foreign-born population - Jamaica (%)
Place of birth for the foreign-born population - St. Vincent and the Grenadines (%)
Place of birth for the foreign-born population - Trinidad and Tobago (%)
Place of birth for the foreign-born population - West Indies (%)
Place of birth for the foreign-born population - Other Caribbean (%)
Place of birth for the foreign-born population - Belize (%)
Place of birth for the foreign-born population - Costa Rica (%)
Place of birth for the foreign-born population - El Salvador (%)
Place of birth for the foreign-born population - Guatemala (%)
Place of birth for the foreign-born population - Honduras (%)
Place of birth for the foreign-born population - Mexico (%)
Place of birth for the foreign-born population - Nicaragua (%)
Place of birth for the foreign-born population - Panama (%)
Place of birth for the foreign-born population - Other Central America (%)
Place of birth for the foreign-born population - Argentina (%)
Place of birth for the foreign-born population - Bolivia (%)
Place of birth for the foreign-born population - Brazil (%)
Place of birth for the foreign-born population - Chile (%)
Place of birth for the foreign-born population - Colombia (%)
Place of birth for the foreign-born population - Ecuador (%)
Place of birth for the foreign-born population - Guyana (%)
Place of birth for the foreign-born population - Peru (%)
Place of birth for the foreign-born population - Uruguay (%)
Place of birth for the foreign-born population - Venezuela (%)
Place of birth for the foreign-born population - Other South America (%)
Place of birth for the foreign-born population - Canada (%)
Place of birth for the foreign-born population - Other Northern America (%)
Place of birth for the foreign-born population - Other (%)
Latest news about races in Coronado, CA collected exclusively by city-data.com from local newspapers, TV, and radio stations
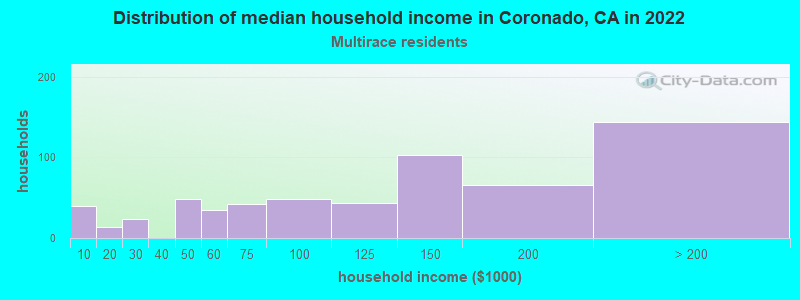
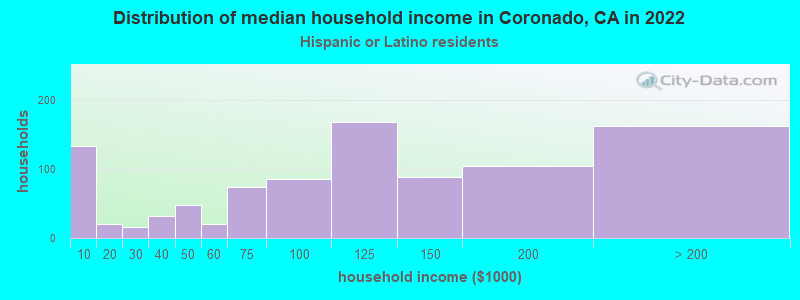
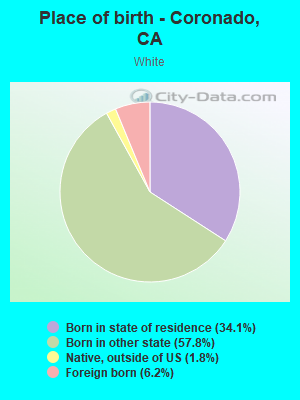
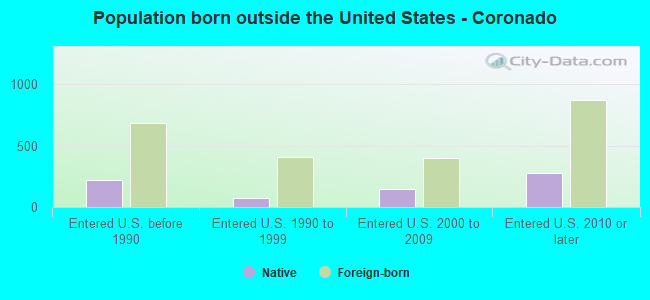
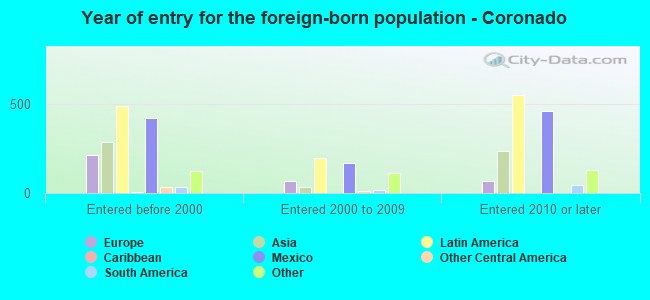
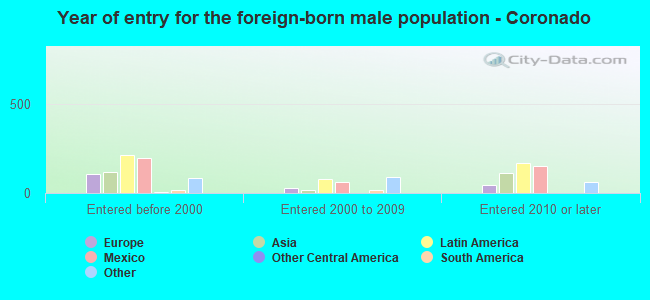
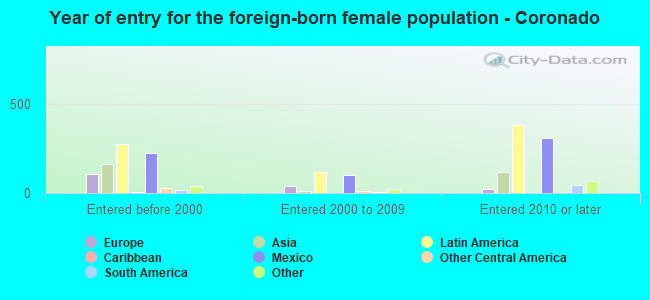
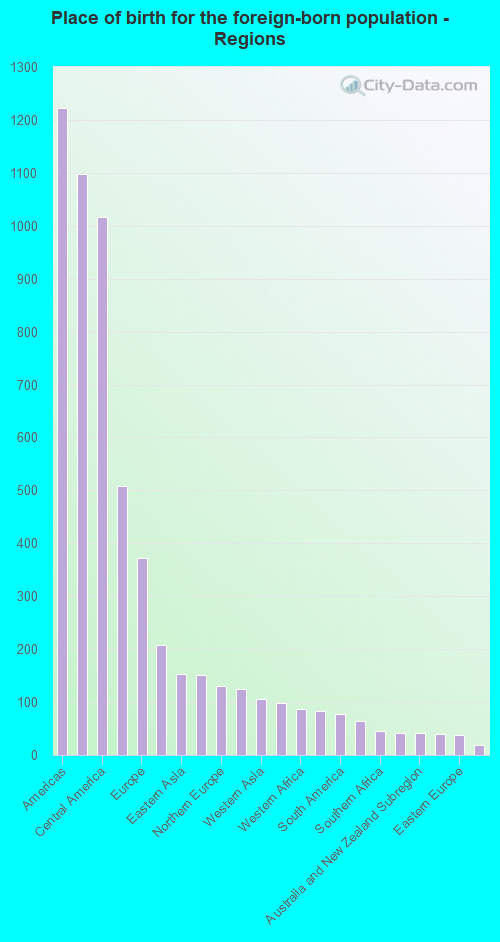
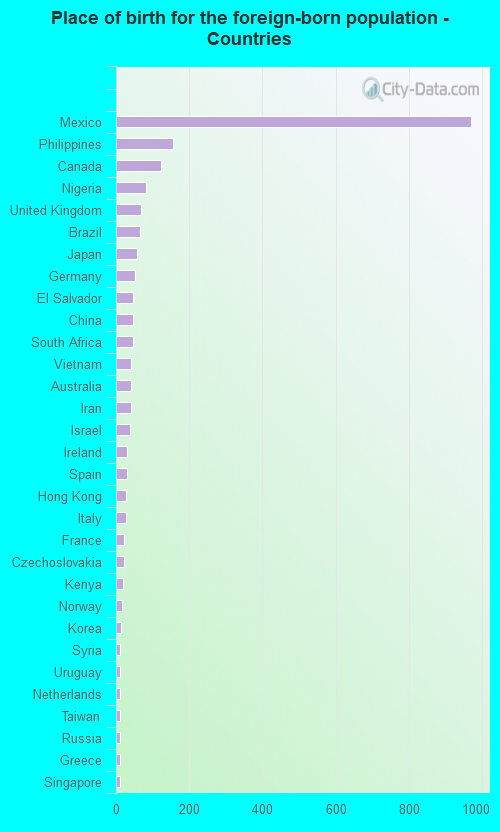
According to 2022 data, the most numerous races in Coronado, CA are Hispanic (3,895 residents), White alone (16,612 residents), and Asian alone (783 residents). 85.5% of Coronado residents speak English at home. 9.6% of Coronado, CA residents are foreign-born (4.6% born in Latin America, 2.1% born in Asia, 1.6% born in Europe), which is 169.5% less than the foreign-born rate of 26.0% across the entire state of California.
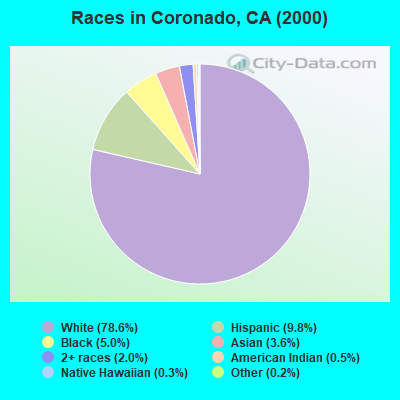
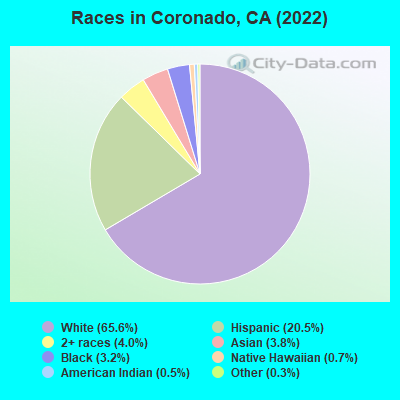
Race distribution in Coronado
2000 2022
15,816,790 46.7% White alone 10,966,556 32.4% Hispanic 3,648,860 10.8% Asian alone 2,181,926 6.4% Black alone 903,115 2.7% Two or more races 178,984 0.5% American Indian alone 103,736 0.3% Native Hawaiian and Other 71,681 0.2% Other race alone
15,732,184 40.3% Hispanic 13,160,426 33.7% White alone 5,957,867 15.3% Asian alone 2,025,218 5.2% Black alone 1,663,222 4.3% Two or more races 251,618 0.6% Other race alone 135,777 0.3% Native Hawaiian and Other 103,030 0.3% American Indian alone
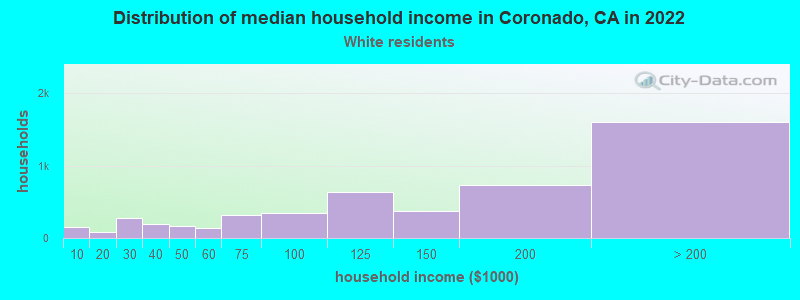
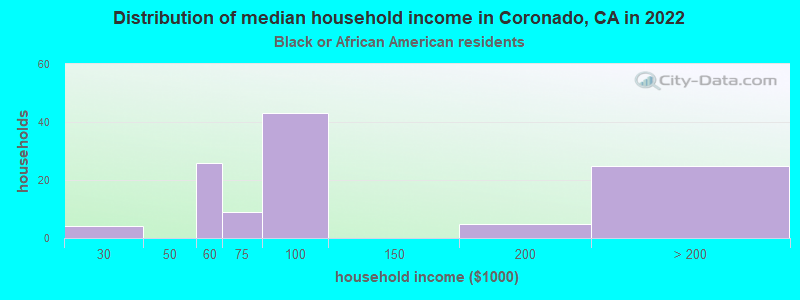
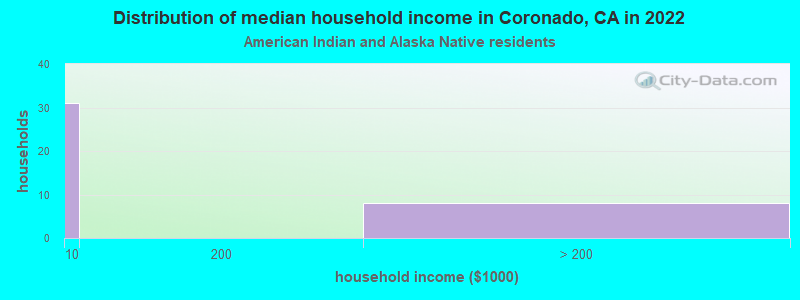
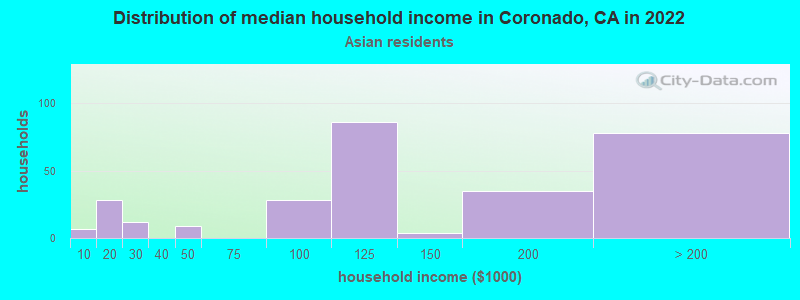
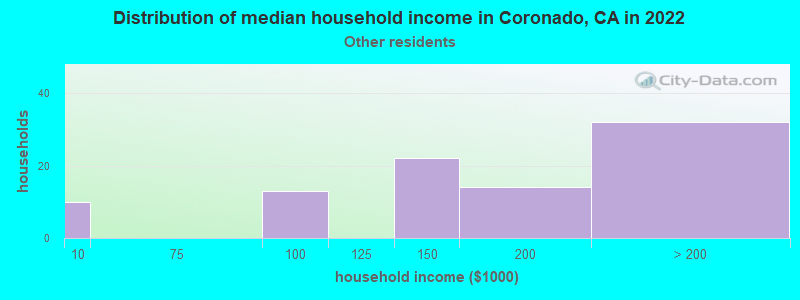
Income and house value in Coronado Median household income in 2022 $142,764 White non-Hispanic householders$110,711 Black householders$71,081 American Indian and Alaska Native householders$132,366 Asian householders$101,281 Native Hawaiian and other Pacific Islander householdersover $200,000 Some other race householders$188,515 Two or more races householders$112,611 Hispanic or Latino race householdersMedian 2022 house value over $1,000,000 White Non-Hispanic householders$635,635 Black or African American householdersover $1,000,000 American Indian or Alaska Native householders over $1,000,000 Asian householdersover $1,000,000 Some other race householdersover $1,000,000 Two or more races householdersover $1,000,000 Hispanic or Latino householders
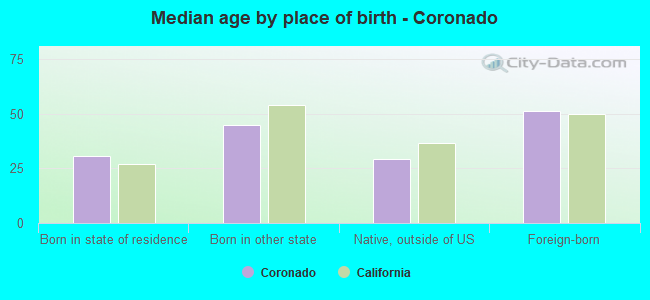
Median age by race in Coronado
45.9 Median age for White residents42.2 50.8 27.9 Median age for Black or African American residents29.1 23.6 35.1 Median age for American Indian / Alaska Native residents35.5 Median age for Asian residents31.8 43.3 30.3 Median age for Native Hawaiian / Pacific Islander residents24.5 Median age for Other race residents24.2 25.1 27.9 Median age for Two or more races residents29.4 23.6 46.6 Median age for White alone residents42.4 50.7 24.8 Median age for Hispanic or Latino residents23.4 40.8
Owner/renter occupied households by race in Coronado
House owners and renters - White residents 3,788 55.9% Owner occupied2,991 44.1% Renter occupiedHouse owners and renters - Black or African American residents 39 43.9% Owner occupied50 56.1% Renter occupiedHouse owners and renters - American Indian / Alaska Native residents 69 54.9% Owner occupied56 45.1% Renter occupiedHouse owners and renters - Asian residents 86 32.7% Owner occupied177 67.3% Renter occupiedHouse owners and renters - Other race residents 33 39.9% Owner occupied49 60.1% Renter occupiedHouse owners and renters - Two or more races residents 290 62.2% Owner occupied177 37.8% Renter occupiedHouse owners and renters - White alone residents 3,783 56.5% Owner occupied2,907 43.5% Renter occupiedHouse owners and renters - Hispanic or Latino residents 355 38.7% Owner occupied562 61.3% Renter occupied
Language usage in Coronado
English speakers - Total 85.5% of residents of Coronado speak English at home.
9.9% of residents speak Spanish at home 1,754 77.7% Speak English very well502 22.3% Speak English less than very well5.0% of residents speak other language at home 847 74.0% Speak English very well297 26.0% Speak English less than very well
English speakers - Born in the United States 93.2% of residents of Coronado speak English at home.
4.3% of residents speak Spanish at home 445 86.9% Speak English very well67 13.1% Speak English less than very well2.3% of residents speak other language at home 252 92.3% Speak English very well21 7.7% Speak English less than very well
English speakers - Native, born elsewhere 75.1% of residents of Coronado speak English at home.
11.2% of residents speak Spanish at home 38 50.7% Speak English very well37 49.3% Speak English less than very well13.3% of residents speak other language at home 43 48.3% Speak English very well46 51.7% Speak English less than very well
English speakers - Foreign-born 32.2% of residents of Coronado speak English at home.
41.8% of residents speak Spanish at home 614 65.6% Speak English very well322 34.4% Speak English less than very well28.8% of residents speak other language at home 418 64.9% Speak English very well226 35.1% Speak English less than very well
White (Caucasian) - Speak only English Native:
97.4% (15,174)Foreign-born:
40.4% (441)
White (Caucasian) - Speak another language Native:
6.2% (966)Foreign-born:
67.5% (737)
Black or African American - Speak only English Native:
98.6% (683)Foreign-born:
14.4% (18)
Black or African American - Speak another language Native:
1.5% (10)Foreign-born:
87.8% (110)
American Indian / Alaska Native - Speak only English Native:
80.3% (158)Foreign-born:
89.9% (63)
Asian - Speak only English Native:
75.6% (350)Foreign-born:
41.2% (150)
Asian - Speak another language Native:
26.1% (121)Foreign-born:
63.8% (232)
Other race - Speak only English Native:
71.9% (275)Foreign-born:
28.9% (15)
Other race - Speak another language Native:
36.5% (140)Foreign-born:
80.2% (43)
Two or more races - Speak only English Native:
72.4% (1,325)Foreign-born:
19.8% (41)
Two or more races - Speak another language Native:
12.3% (225)Foreign-born:
72.2% (150)
White alone - Speak only English Native:
96.0% (14,566)Foreign-born:
57.4% (407)
White alone - Speak another language Native:
3.9% (596)Foreign-born:
42.4% (301)
Hispanic or Latino - Speak only English Native:
66.1% (1,905)Foreign-born:
12.4% (118)
Hispanic or Latino - Speak another language Native:
38.0% (1,094)Foreign-born:
89.8% (859)
Foreign-born residents in Coronado 2,300 residents are foreign born (4.6% Latin America , 2.1% Asia , 1.6% Europe ).
This city:
9.6%California:
100.0%
Marital status for residents in Coronado Marital status - White (Caucasian) population 15 years and over
Males 29.5% Never married60.6% Now married1.0% Separated2.5% Widowed6.4% DivorcedFemales 20.4% Never married58.8% Now married1.4% Separated8.6% Widowed10.8% DivorcedWomen who gave birth in the past 12 months Now married:
100.0% (117)Unmarried:
0.0% (0)
Women who did not give birth in the past 12 months Now married:
56.7% (1,654)Unmarried:
43.3% (1,264)
Marital status - Black or African American population 15 years and over
Males 53.1% Never married43.6% Now married0.0% Separated0.4% Widowed2.9% DivorcedFemales 38.5% Never married60.3% Now married0.0% Separated0.0% Widowed1.3% DivorcedWomen who gave birth in the past 12 months Now married:
100.0% (5)Unmarried:
0.0% (0)
Women who did not give birth in the past 12 months Now married:
52.3% (31)Unmarried:
47.7% (28)
Marital status - American Indian / Alaska Native population 15 years and over
Males 6.5% Never married93.5% Now married0.0% Separated0.0% Widowed0.0% DivorcedFemales 0.0% Never married100.0% Now married0.0% Separated0.0% Widowed0.0% DivorcedMarital status - Asian population 15 years and over
Males 55.5% Never married28.2% Now married0.0% Separated0.0% Widowed16.3% DivorcedFemales 12.5% Never married74.7% Now married0.0% Separated3.2% Widowed9.6% DivorcedWomen who did not give birth in the past 12 months Now married:
80.8% (153)Unmarried:
19.2% (36)
Marital status - Other race population 15 years and over
Males 73.1% Never married23.3% Now married0.0% Separated0.5% Widowed3.2% DivorcedFemales 70.2% Never married29.8% Now married0.0% Separated0.0% Widowed0.0% DivorcedWomen who did not give birth in the past 12 months Now married:
22.6% (33)Unmarried:
77.4% (112)
Marital status - Two or more races population 15 years and over
Males 74.0% Never married23.8% Now married0.0% Separated0.0% Widowed2.3% DivorcedFemales 41.3% Never married37.2% Now married0.8% Separated2.4% Widowed18.2% DivorcedWomen who gave birth in the past 12 months Now married:
100.0% (39)Unmarried:
0.0% (0)
Women who did not give birth in the past 12 months Now married:
28.7% (116)Unmarried:
71.3% (290)
Marital status - White alone, not Hispanic / Latino population 15 years and over
Males 27.6% Never married62.0% Now married1.1% Separated2.8% Widowed6.5% DivorcedFemales 19.1% Never married59.8% Now married1.1% Separated9.1% Widowed10.9% DivorcedWomen who gave birth in the past 12 months Now married:
100.0% (136)Unmarried:
0.0% (0)
Women who did not give birth in the past 12 months Now married:
58.7% (1,603)Unmarried:
41.3% (1,129)
Marital status - Hispanic or Latino population 15 years and over
Males 46.6% Never married49.5% Now married0.0% Separated0.1% Widowed3.8% DivorcedFemales 34.9% Never married48.7% Now married2.9% Separated4.8% Widowed8.8% DivorcedWomen who did not give birth in the past 12 months Now married:
42.6% (383)Unmarried:
57.4% (516)
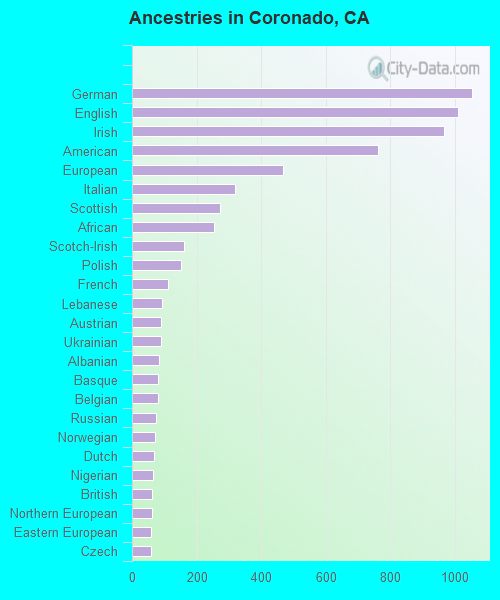
Ancestries in Coronado
1,017 9.1% Irish984 8.8% American918 8.2% English875 7.8% German618 5.5% European339 3.0% Italian284 2.5% Scottish270 2.4% African152 1.4% British145 1.3% Polish125 1.1% Scotch-Irish122 1.1% Nigerian120 1.1% Norwegian102 0.9% Eastern European91 0.8% Russian89 0.8% Swedish74 0.7% French73 0.7% Greek69 0.6% Ukrainian62 0.6% Dutch61 0.5% Northern European47 0.4% Belgian41 0.4% Czech39 0.3% Iranian30 0.3% Brazilian29 0.3% Scandinavian27 0.2% Armenian27 0.2% Welsh25 0.2% Syrian24 0.2% Kenyan24 0.2% French Canadian21 0.2% Lebanese20 0.2% Danish19 0.2% Austrian17 0.2% Finnish17 0.2% Czechoslovakian17 0.2% Hungarian16 0.1% Israeli16 0.1% Slovak14 0.1% Cypriot12 0.1% Swiss7 0.06% Celtic7 0.06% Yugoslavian7 0.06% Haitian6 0.05% Serbian5 0.04% Slovene5 0.04% Macedonian5 0.04% Maltese4 0.04% Romanian4 0.04% Canadian2 0.02% Jamaican1 0.01% New Zealander
Geographical mobility in Coronado Same house 1 year ago 13,674 81.7% White (Caucasian)661 81.5% Black or African American201 77.0% American Indian / Alaska Native616 75.2% Asian16 100.0% Native Hawaiian / Pacific Islander315 79.2% Other race1,618 78.3% Two or more races13,243 79.6% White alone, not Hispanic / Latino3,024 80.1% Hispanic or LatinoMoved within same county 1,102 6.6% White / Caucasian24 3.0% Black or African American42 15.9% American Indian / Alaska Native79 9.7% Asian9 2.3% Other race268 13.0% Two or more races1,337 8.0% White alone, not Hispanic / Latino317 8.4% Hispanic or LatinoMoved within same state 520 3.1% White / Caucasian36 4.4% Asian41 10.3% Other race68 3.3% Two or more races390 2.3% White alone, not Hispanic / Latino174 4.6% Hispanic or LatinoMoved from different state 1,028 6.1% White / Caucasian126 15.5% Black or African American6 2.2% American Indian / Alaska Native1 0.1% Asian61 15.3% Other race29 1.4% Two or more races1,205 7.2% White alone, not Hispanic / Latino121 3.2% Hispanic or LatinoMoved from abroad 215 1.3% White2 0.2% Black or African American49 6.0% Asian7 1.8% Other race291 1.8% White alone, not Hispanic / Latino109 2.9% Hispanic or Latino
Children Nativity (place of birth) in Coronado
Children under 6 years - Living with two parents Both parents native 914 100.0% NativeBoth parents foreign-born 23 78.2% Native6 21.8% Foreign-bornOne native, one foreign-born parent 91 100.0% NativeChildren under 6 years - Living with one parent Native parent 48 100.0% NativeForeign-born parent 29 100.0% NativeChildren 6 to 17 years - Living with two parents Both parents native 1,831 99.1% Native17 0.9% Foreign-bornBoth parents foreign-born 146 53.3% Native128 46.7% Foreign-bornOne native, one foreign-born parent 403 100.0% NativeChildren 6 to 17 years - Living with one parent Native parent 365 100.0% NativeForeign-born parent 125 50.2% Native124 49.8% Foreign-born
Grandparents responsible for own grandchildren in Coronado
Grandparents (30 to 59 years) White / Caucasian 54 100.0% Responsible for grandchildrenWhite alone, not Hispanic / Latino 34 100.0% Responsible for grandchildrenGrandparents (60 years and over) White / Caucasian 47 32.7% Responsible for grandchildren97 67.3% Not responsible for grandchildrenWhite alone, not Hispanic / Latino 48 26.2% Responsible for grandchildren137 73.8% Not responsible for grandchildren