Races in Council Bluffs, Iowa (IA) Detailed Stats
Data:
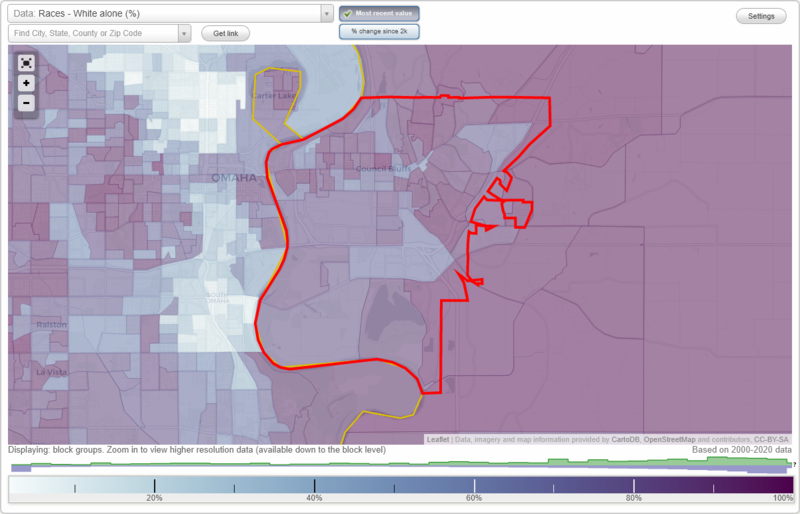
Races - White alone (%)
Races - White alone (% change since 2000)
Races - Black alone (%)
Races - Black alone (% change since 2000)
Races - American Indian alone (%)
Races - American Indian alone (% change since 2000)
Races - Asian alone (%)
Races - Asian alone (% change since 2000)
Races - Hispanic (%)
Races - Hispanic (% change since 2000)
Races - Native Hawaiian and Other Pacific Islander alone (%)
Races - Native Hawaiian and Other Pacific Islander alone (% change since 2000)
Races - Two or more races(%)
Races - Two or more races(% change since 2000)
Races - Other race alone (%)
Races - Other race alone (% change since 2000)
Racial diversity
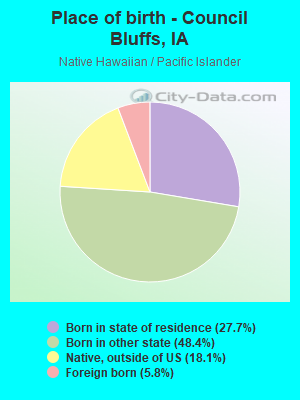
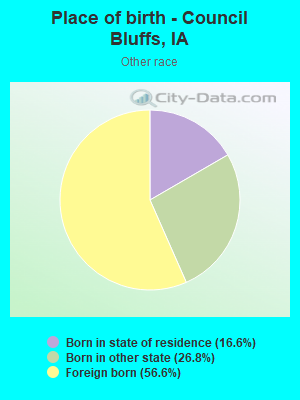
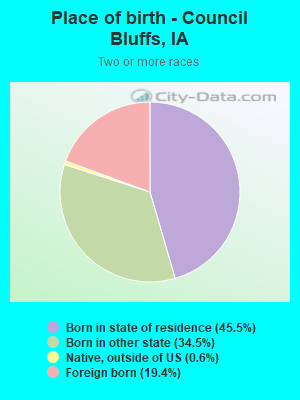
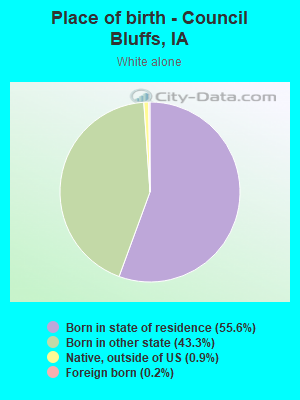
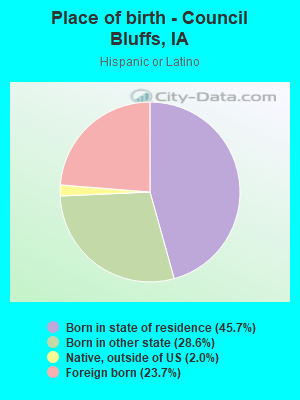
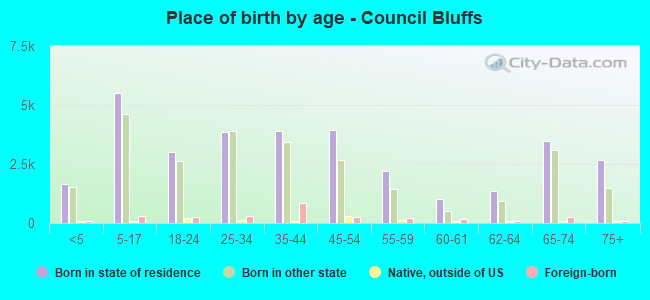
Place of birth - Born in state of residence (%)
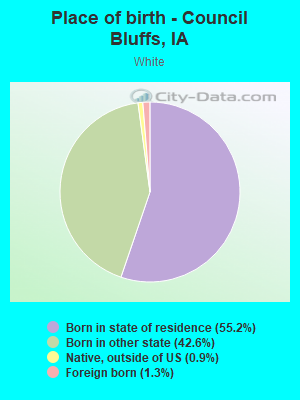
Place of birth - Born in state of residence (%) - White
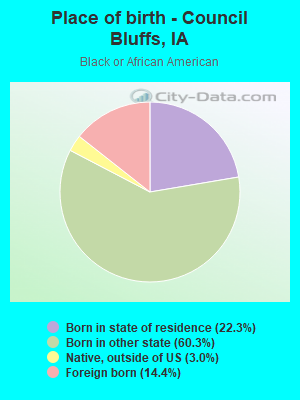
Place of birth - Born in state of residence (%) - Black or African American
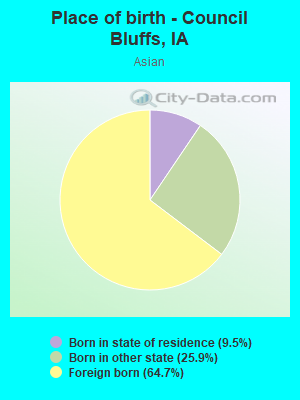
Place of birth - Born in state of residence (%) - Asian
Place of birth - Born in state of residence (%) - Hispanic or Latino
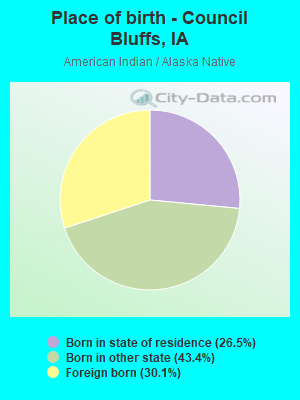
Place of birth - Born in state of residence (%) - American Indian and Alaska Native
Place of birth - Born in state of residence (%) - Multirace
Place of birth - Born in state of residence (%) - Other Race
Place of birth - Born in other state (%)
Place of birth - Born in other state (%) - White
Place of birth - Born in other state (%) - Black or African American
Place of birth - Born in other state (%) - Asian
Place of birth - Born in other state (%) - Hispanic or Latino
Place of birth - Born in other state (%) - American Indian and Alaska Native
Place of birth - Born in other state (%) - Multirace
Place of birth - Born in other state (%) - Other Race
Place of birth - Native, outside of US (%)
Place of birth - Native, outside of US (%) - White
Place of birth - Native, outside of US (%) - Black or African American
Place of birth - Native, outside of US (%) - Asian
Place of birth - Native, outside of US (%) - Hispanic or Latino
Place of birth - Native, outside of US (%) - American Indian and Alaska Native
Place of birth - Native, outside of US (%) - Multirace
Place of birth - Native, outside of US (%) - Other Race
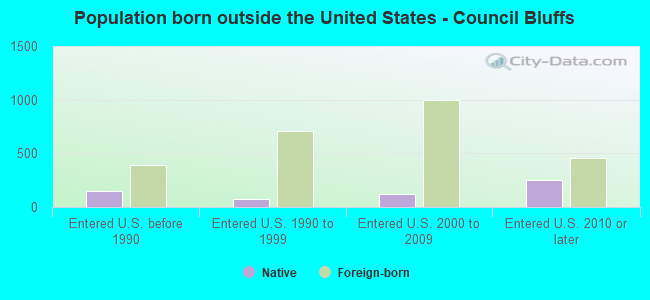
Place of birth - Foreign born (%)
Place of birth - Foreign born (%) - White
Place of birth - Foreign born (%) - Black or African American
Place of birth - Foreign born (%) - Asian
Place of birth - Foreign born (%) - Hispanic or Latino
Place of birth - Foreign born (%) - American Indian and Alaska Native
Place of birth - Foreign born (%) - Multirace
Place of birth - Foreign born (%) - Other Race
Residents speaking English at home (%)
Residents speaking English at home - Born in the United States (%)
Residents speaking English at home - Native, born elsewhere (%)
Residents speaking English at home - Foreign born (%)
Residents speaking Spanish at home (%)
Residents speaking Spanish at home - Born in the United States (%)
Residents speaking Spanish at home - Native, born elsewhere (%)
Residents speaking Spanish at home - Foreign born (%)
Residents speaking other language at home (%)
Residents speaking other language at home - Born in the United States (%)
Residents speaking other language at home - Native, born elsewhere (%)
Residents speaking other language at home - Foreign born (%)
Marital status - Never married (%)
Marital status - Now married (%)
Marital status - Separated (%)
Marital status - Widowed (%)
Marital status - Divorced (%)
Ancestries Reported - Arab (%)
Ancestries Reported - Czech (%)
Ancestries Reported - Danish (%)
Ancestries Reported - Dutch (%)
Ancestries Reported - English (%)
Ancestries Reported - French (%)
Ancestries Reported - French Canadian (%)
Ancestries Reported - German (%)
Ancestries Reported - Greek (%)
Ancestries Reported - Hungarian (%)
Ancestries Reported - Irish (%)
Ancestries Reported - Italian (%)
Ancestries Reported - Lithuanian (%)
Ancestries Reported - Norwegian (%)
Ancestries Reported - Polish (%)
Ancestries Reported - Portuguese (%)
Ancestries Reported - Russian (%)
Ancestries Reported - Scotch-Irish (%)
Ancestries Reported - Scottish (%)
Ancestries Reported - Slovak (%)
Ancestries Reported - Subsaharan African (%)
Ancestries Reported - Swedish (%)
Ancestries Reported - Swiss (%)
Ancestries Reported - Ukrainian (%)
Ancestries Reported - United States (%)
Ancestries Reported - Welsh (%)
Ancestries Reported - West Indian (%)
Ancestries Reported - Other (%)
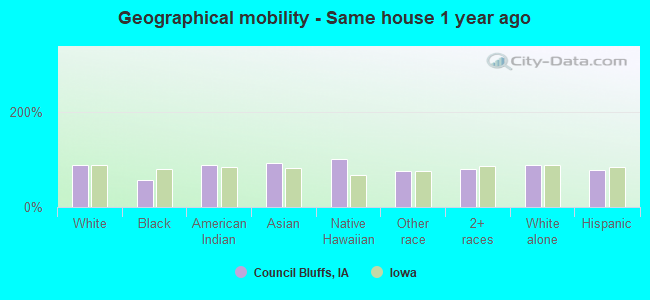
Geographical mobility - Same house 1 year ago (%)
Geographical mobility - Same house 1 year ago (%) - White
Geographical mobility - Same house 1 year ago (%) - Black or African American
Geographical mobility - Same house 1 year ago (%) - Asian
Geographical mobility - Same house 1 year ago (%) - Hispanic or Latino
Geographical mobility - Same house 1 year ago (%) - American Indian and Alaska Native
Geographical mobility - Same house 1 year ago (%) - Multirace
Geographical mobility - Same house 1 year ago (%) - Other Race
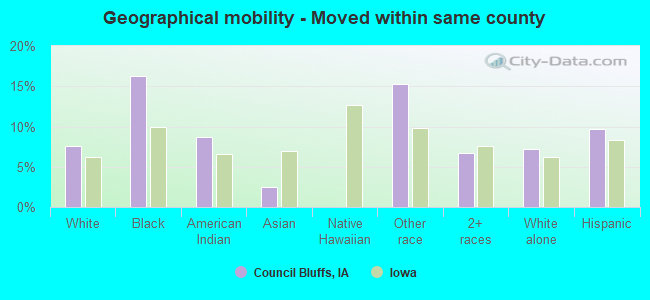
Geographical mobility - Moved within same county (%)
Geographical mobility - Moved within same county (%) - White
Geographical mobility - Moved within same county (%) - Black or African American
Geographical mobility - Moved within same county (%) - Asian
Geographical mobility - Moved within same county (%) - Hispanic or Latino
Geographical mobility - Moved within same county (%) - American Indian and Alaska Native
Geographical mobility - Moved within same county (%) - Multirace
Geographical mobility - Moved within same county (%) - Other Race
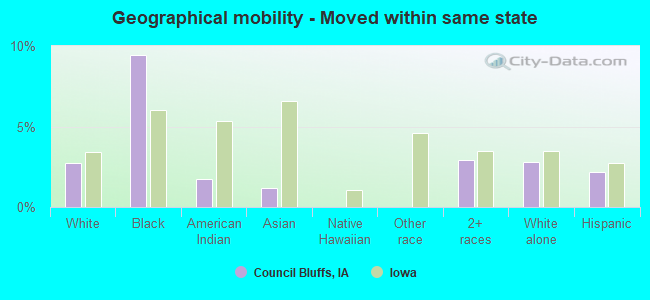
Geographical mobility - Moved from different county within same state (%)
Geographical mobility - Moved from different county within same state (%) - White
Geographical mobility - Moved from different county within same state (%) - Black or African American
Geographical mobility - Moved from different county within same state (%) - Asian
Geographical mobility - Moved from different county within same state (%) - Hispanic or Latino
Geographical mobility - Moved from different county within same state (%) - American Indian and Alaska Native
Geographical mobility - Moved from different county within same state (%) - Multirace
Geographical mobility - Moved from different county within same state (%) - Other Race
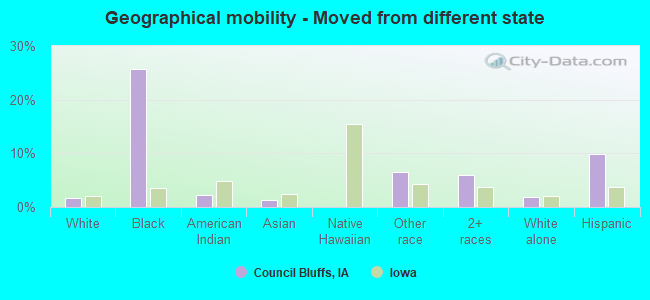
Geographical mobility - Moved from different state (%)
Geographical mobility - Moved from different state (%) - White
Geographical mobility - Moved from different state (%) - Black or African American
Geographical mobility - Moved from different state (%) - Asian
Geographical mobility - Moved from different state (%) - Hispanic or Latino
Geographical mobility - Moved from different state (%) - American Indian and Alaska Native
Geographical mobility - Moved from different state (%) - Multirace
Geographical mobility - Moved from different state (%) - Other Race
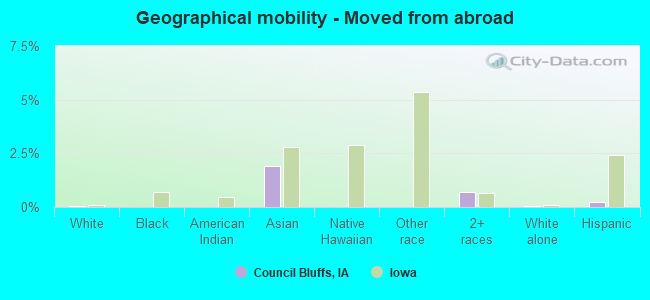
Geographical mobility - Moved from abroad (%)
Geographical mobility - Moved from abroad (%) - White
Geographical mobility - Moved from abroad (%) - Black or African American
Geographical mobility - Moved from abroad (%) - Asian
Geographical mobility - Moved from abroad (%) - Hispanic or Latino
Geographical mobility - Moved from abroad (%) - American Indian and Alaska Native
Geographical mobility - Moved from abroad (%) - Multirace
Geographical mobility - Moved from abroad (%) - Other Race
Place of birth for the foreign-born population - Ireland (%)
Place of birth for the foreign-born population - Denmark (%)
Place of birth for the foreign-born population - Norway (%)
Place of birth for the foreign-born population - Sweden (%)
Place of birth for the foreign-born population - United Kingdom (%)
Place of birth for the foreign-born population - England (%)
Place of birth for the foreign-born population - Scotland (%)
Place of birth for the foreign-born population - Other Northern Europe (%)
Place of birth for the foreign-born population - Austria (%)
Place of birth for the foreign-born population - Belgium (%)
Place of birth for the foreign-born population - France (%)
Place of birth for the foreign-born population - Germany (%)
Place of birth for the foreign-born population - Netherlands (%)
Place of birth for the foreign-born population - Switzerland (%)
Place of birth for the foreign-born population - Other Western Europe (%)
Place of birth for the foreign-born population - Greece (%)
Place of birth for the foreign-born population - Italy (%)
Place of birth for the foreign-born population - Portugal (%)
Place of birth for the foreign-born population - Spain (%)
Place of birth for the foreign-born population - Other Southern Europe (%)
Place of birth for the foreign-born population - Albania (%)
Place of birth for the foreign-born population - Belarus (%)
Place of birth for the foreign-born population - Bosnia and Herzegovina (%)
Place of birth for the foreign-born population - Bulgaria (%)
Place of birth for the foreign-born population - Croatia (%)
Place of birth for the foreign-born population - Czechoslovakia (%)
Place of birth for the foreign-born population - Hungary (%)
Place of birth for the foreign-born population - Latvia (%)
Place of birth for the foreign-born population - Lithuania (%)
Place of birth for the foreign-born population - North Macedonia (Macedonia) (%)
Place of birth for the foreign-born population - Moldova (%)
Place of birth for the foreign-born population - Poland (%)
Place of birth for the foreign-born population - Romania (%)
Place of birth for the foreign-born population - Russia (%)
Place of birth for the foreign-born population - Serbia (%)
Place of birth for the foreign-born population - Ukraine (%)
Place of birth for the foreign-born population - Other Eastern Europe (%)
Place of birth for the foreign-born population - China (%)
Place of birth for the foreign-born population - Hong Kong (%)
Place of birth for the foreign-born population - Taiwan (%)
Place of birth for the foreign-born population - Japan (%)
Place of birth for the foreign-born population - Korea (%)
Place of birth for the foreign-born population - Other Eastern Asia (%)
Place of birth for the foreign-born population - Afghanistan (%)
Place of birth for the foreign-born population - Bangladesh (%)
Place of birth for the foreign-born population - India (%)
Place of birth for the foreign-born population - Iran (%)
Place of birth for the foreign-born population - Kazakhstan (%)
Place of birth for the foreign-born population - Nepal (%)
Place of birth for the foreign-born population - Pakistan (%)
Place of birth for the foreign-born population - Sri Lanka (%)
Place of birth for the foreign-born population - Uzbekistan (%)
Place of birth for the foreign-born population - Other South Central Asia (%)
Place of birth for the foreign-born population - Burma (%)
Place of birth for the foreign-born population - Cambodia (%)
Place of birth for the foreign-born population - Indonesia (%)
Place of birth for the foreign-born population - Laos (%)
Place of birth for the foreign-born population - Malaysia (%)
Place of birth for the foreign-born population - Philippines (%)
Place of birth for the foreign-born population - Singapore (%)
Place of birth for the foreign-born population - Thailand (%)
Place of birth for the foreign-born population - Vietnam (%)
Place of birth for the foreign-born population - Other South Eastern Asia (%)
Place of birth for the foreign-born population - Armenia (%)
Place of birth for the foreign-born population - Iraq (%)
Place of birth for the foreign-born population - Israel (%)
Place of birth for the foreign-born population - Jordan (%)
Place of birth for the foreign-born population - Kuwait (%)
Place of birth for the foreign-born population - Lebanon (%)
Place of birth for the foreign-born population - Saudi Arabia (%)
Place of birth for the foreign-born population - Syria (%)
Place of birth for the foreign-born population - Turkey (%)
Place of birth for the foreign-born population - Yemen (%)
Place of birth for the foreign-born population - Other Western Asia (%)
Place of birth for the foreign-born population - Eritrea (%)
Place of birth for the foreign-born population - Ethiopia (%)
Place of birth for the foreign-born population - Kenya (%)
Place of birth for the foreign-born population - Somalia (%)
Place of birth for the foreign-born population - Uganda (%)
Place of birth for the foreign-born population - Zimbabwe (%)
Place of birth for the foreign-born population - Other Eastern Africa (%)
Place of birth for the foreign-born population - Cameroon (%)
Place of birth for the foreign-born population - Congo (%)
Place of birth for the foreign-born population - Democratic Republic of Congo (Zaire) (%)
Place of birth for the foreign-born population - Other Middle Africa (%)
Place of birth for the foreign-born population - Egypt (%)
Place of birth for the foreign-born population - Morocco (%)
Place of birth for the foreign-born population - Sudan (%)
Place of birth for the foreign-born population - Other Northern Africa (%)
Place of birth for the foreign-born population - South Africa (%)
Place of birth for the foreign-born population - Other Southern Africa (%)
Place of birth for the foreign-born population - Cabo Verde (%)
Place of birth for the foreign-born population - Ghana (%)
Place of birth for the foreign-born population - Liberia (%)
Place of birth for the foreign-born population - Nigeria (%)
Place of birth for the foreign-born population - Senegal (%)
Place of birth for the foreign-born population - Sierra Leone (%)
Place of birth for the foreign-born population - Other Western Africa (%)
Place of birth for the foreign-born population - Australia (%)
Place of birth for the foreign-born population - New Zealand (%)
Place of birth for the foreign-born population - Fiji (%)
Place of birth for the foreign-born population - Micronesia (%)
Place of birth for the foreign-born population - Bahamas (%)
Place of birth for the foreign-born population - Barbados (%)
Place of birth for the foreign-born population - Cuba (%)
Place of birth for the foreign-born population - Dominica (%)
Place of birth for the foreign-born population - Dominican Republic (%)
Place of birth for the foreign-born population - Grenada (%)
Place of birth for the foreign-born population - Haiti (%)
Place of birth for the foreign-born population - Jamaica (%)
Place of birth for the foreign-born population - St. Vincent and the Grenadines (%)
Place of birth for the foreign-born population - Trinidad and Tobago (%)
Place of birth for the foreign-born population - West Indies (%)
Place of birth for the foreign-born population - Other Caribbean (%)
Place of birth for the foreign-born population - Belize (%)
Place of birth for the foreign-born population - Costa Rica (%)
Place of birth for the foreign-born population - El Salvador (%)
Place of birth for the foreign-born population - Guatemala (%)
Place of birth for the foreign-born population - Honduras (%)
Place of birth for the foreign-born population - Mexico (%)
Place of birth for the foreign-born population - Nicaragua (%)
Place of birth for the foreign-born population - Panama (%)
Place of birth for the foreign-born population - Other Central America (%)
Place of birth for the foreign-born population - Argentina (%)
Place of birth for the foreign-born population - Bolivia (%)
Place of birth for the foreign-born population - Brazil (%)
Place of birth for the foreign-born population - Chile (%)
Place of birth for the foreign-born population - Colombia (%)
Place of birth for the foreign-born population - Ecuador (%)
Place of birth for the foreign-born population - Guyana (%)
Place of birth for the foreign-born population - Peru (%)
Place of birth for the foreign-born population - Uruguay (%)
Place of birth for the foreign-born population - Venezuela (%)
Place of birth for the foreign-born population - Other South America (%)
Place of birth for the foreign-born population - Canada (%)
Place of birth for the foreign-born population - Other Northern America (%)
Place of birth for the foreign-born population - Other (%)
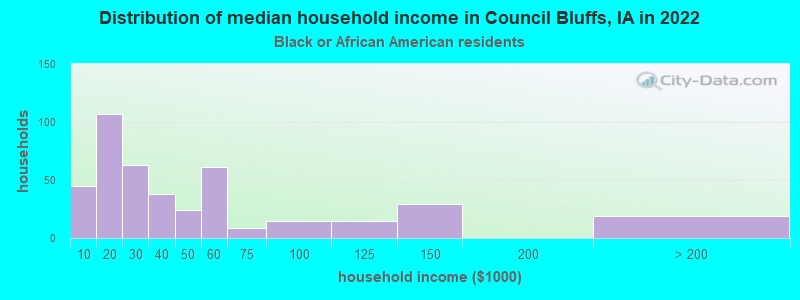
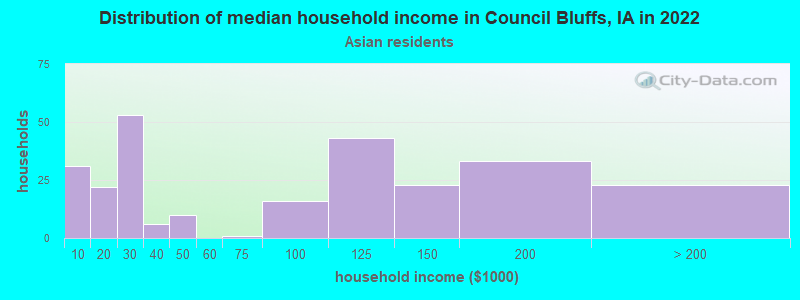
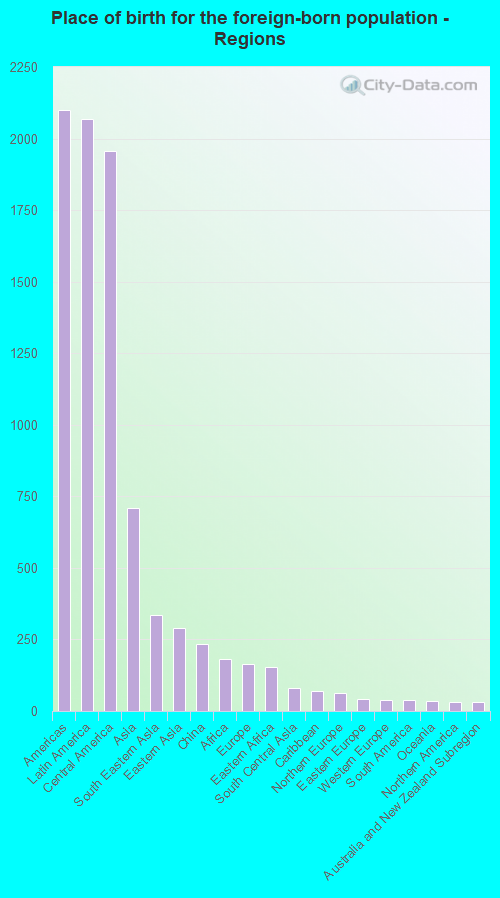
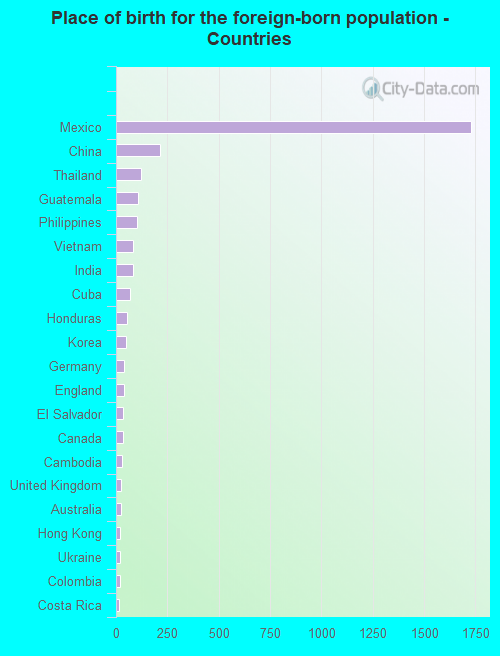
According to 2022 data, the most numerous races in Council Bluffs, IA are White alone (51,370 residents), Hispanic (6,977 residents), and Black alone (895 residents). 92.6% of Council Bluffs residents speak English at home. 5.1% of Council Bluffs, IA residents are foreign-born (3.2% born in Latin America, 1.1% born in Asia), which is 2.2% greater than the foreign-born rate of 5.0% across the entire state of Iowa.
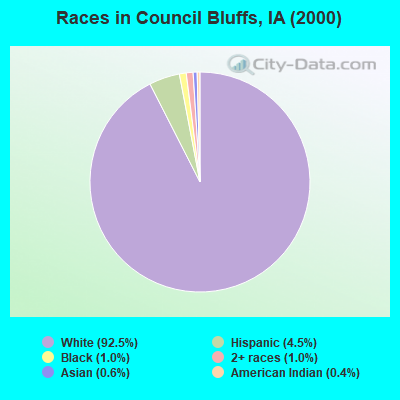
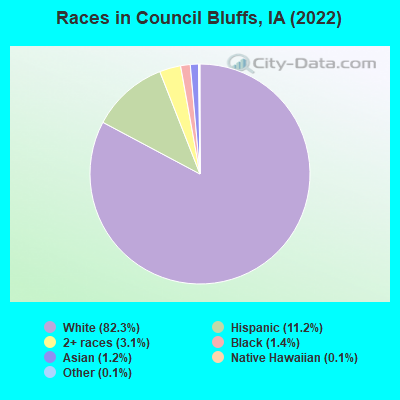
Race distribution in Council Bluffs
2000 2022
2,710,344 92.6% White alone 82,473 2.8% Hispanic 60,744 2.1% Black alone 36,345 1.2% Asian alone 25,472 0.9% Two or more races 7,955 0.3% American Indian alone 2,103 0.07% Other race alone 888 0.03% Native Hawaiian and Other
2,650,110 82.8% White alone 218,024 6.8% Hispanic 119,004 3.7% Black alone 115,286 3.6% Two or more races 74,892 2.3% Asian alone 9,260 0.3% Other race alone 8,595 0.3% Native Hawaiian and Other 5,346 0.2% American Indian alone
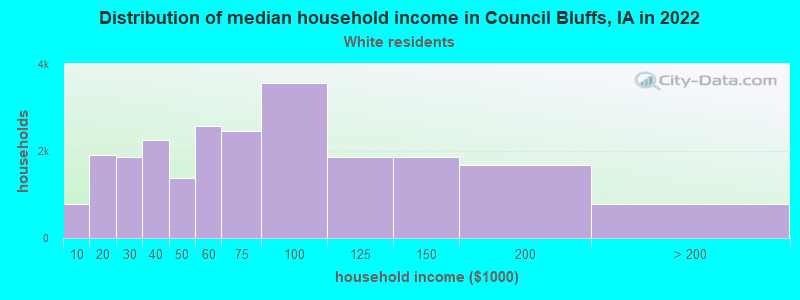
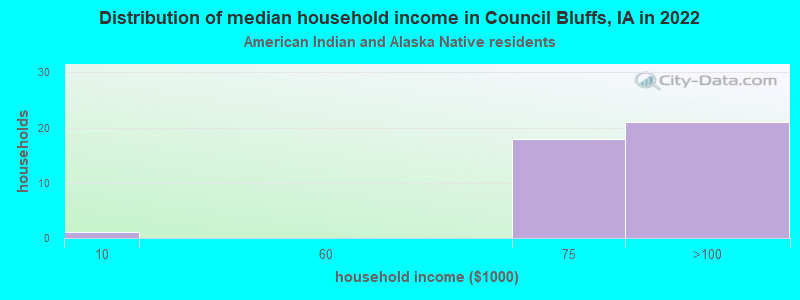
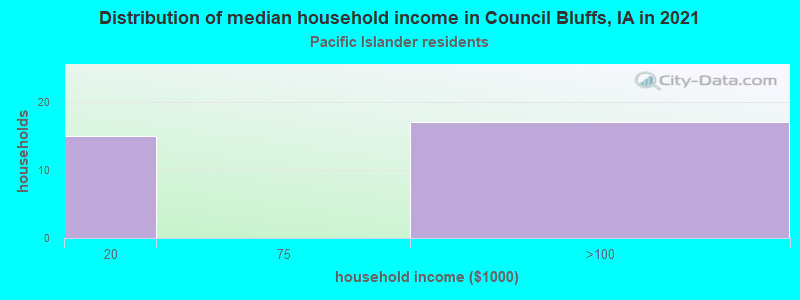
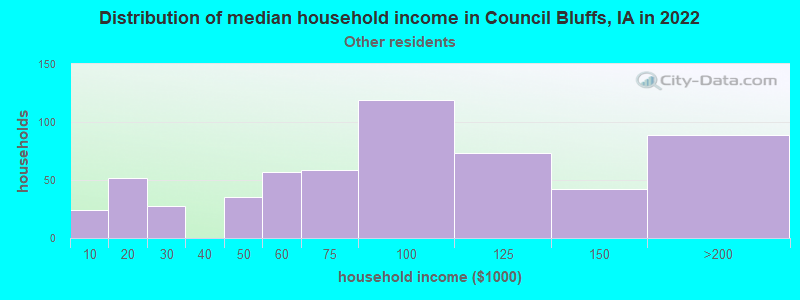
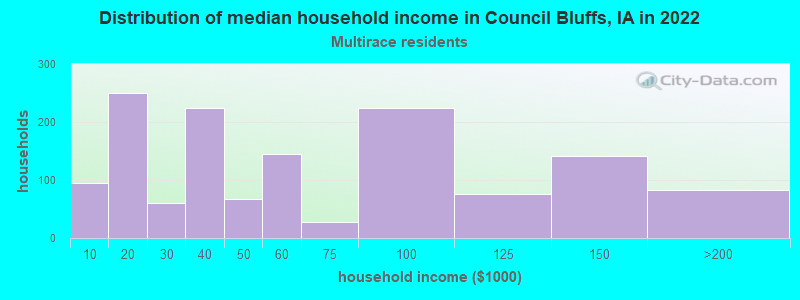
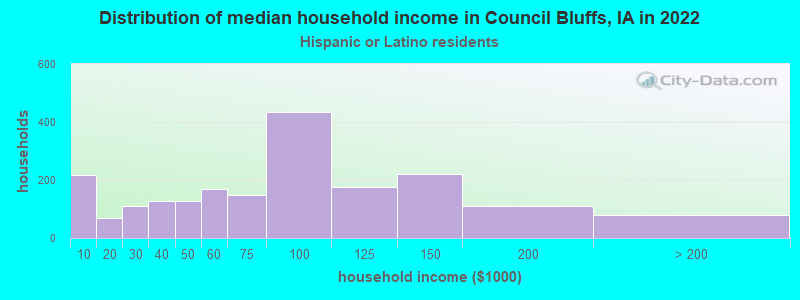
Income and house value in Council Bluffs Median household income in 2022 $64,293 White non-Hispanic householders$31,330 Black householders$62,481 American Indian and Alaska Native householders$56,653 Some other race householders$47,305 Two or more races householders$68,767 Hispanic or Latino race householdersMedian 2022 house value $180,083 White Non-Hispanic householders$144,984 Black or African American householders$126,173 American Indian or Alaska Native householders $164,483 Asian householders$172,054 Native Hawaiian and other Pacific Islander householders$152,325 Some other race householders$189,259 Two or more races householders$164,025 Hispanic or Latino householders
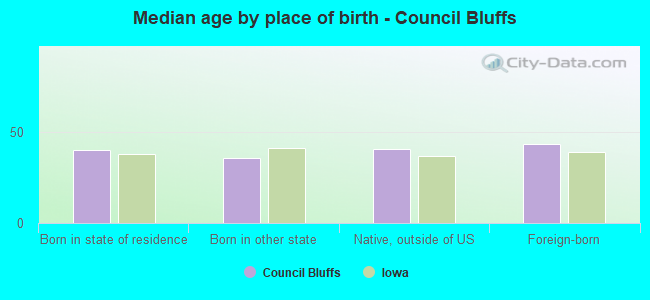
Median age by race in Council Bluffs
41.2 Median age for White residents40.9 41.9 37.7 Median age for Black or African American residents40.4 42.5 82.9 Median age for American Indian / Alaska Native residents49.1 51.8 44.0 Median age for Asian residents58.1 53.9 49.8 Median age for Native Hawaiian / Pacific Islander residents-590,534,978.8 10.5 35.7 Median age for Other race residents37.2 32.6 22.9 Median age for Two or more races residents20.0 26.7 42.1 Median age for White alone residents40.9 43.0 25.8 Median age for Hispanic or Latino residents29.7 24.1
Owner/renter occupied households by race in Council Bluffs
House owners and renters - White residents 14,730 63.4% Owner occupied8,506 36.6% Renter occupiedHouse owners and renters - Black or African American residents 53 12.5% Owner occupied372 87.5% Renter occupiedHouse owners and renters - American Indian / Alaska Native residents 35 65.7% Owner occupied18 34.3% Renter occupiedHouse owners and renters - Asian residents 162 57.9% Owner occupied118 42.1% Renter occupiedHouse owners and renters - Native Hawaiian / Pacific Islander residents 52 83.9% Owner occupied10 16.1% Renter occupiedHouse owners and renters - Other race residents 363 63.5% Owner occupied209 36.5% Renter occupiedHouse owners and renters - Two or more races residents 901 56.9% Owner occupied681 43.1% Renter occupiedHouse owners and renters - White alone residents 14,330 62.9% Owner occupied8,466 37.1% Renter occupiedHouse owners and renters - Hispanic or Latino residents 1,607 78.7% Owner occupied434 21.3% Renter occupied
Language usage in Council Bluffs
English speakers - Total 92.6% of residents of Council Bluffs speak English at home.
6.0% of residents speak Spanish at home 2,011 56.3% Speak English very well1,558 43.7% Speak English less than very well1.3% of residents speak other language at home 350 47.1% Speak English very well393 52.9% Speak English less than very well
English speakers - Born in the United States 96.3% of residents of Council Bluffs speak English at home.
3.3% of residents speak Spanish at home 703 85.2% Speak English very well122 14.8% Speak English less than very well0.3% of residents speak other language at home 83 100.0% Speak English very well
English speakers - Native, born elsewhere 82.5% of residents of Council Bluffs speak English at home.
6.8% of residents speak Spanish at home 32 55.2% Speak English very well26 44.8% Speak English less than very well1.5% of residents speak other language at home 13 100.0% Speak English very well
English speakers - Foreign-born 12.9% of residents of Council Bluffs speak English at home.
62.3% of residents speak Spanish at home 454 28.1% Speak English very well1,161 71.9% Speak English less than very well24.8% of residents speak other language at home 256 39.8% Speak English very well388 60.2% Speak English less than very well
White (Caucasian) - Speak only English Native:
98.3% (49,574)Foreign-born:
37.8% (257)
White (Caucasian) - Speak another language Native:
1.8% (894)Foreign-born:
65.3% (444)
Black or African American - Speak only English Native:
97.9% (1,151)Foreign-born:
61.9% (115)
Black or African American - Speak another language Native:
2.1% (25)Foreign-born:
12.5% (23)
American Indian / Alaska Native - Speak another language Native:
24.9% (31)Foreign-born:
93.5% (49)
Asian - Speak only English Native:
53.9% (85)Foreign-born:
42.0% (229)
Asian - Speak another language Native:
46.2% (73)Foreign-born:
61.6% (335)
Native Hawaiian / Pacific Islander - Speak only English Native:
81.6% (47)Foreign-born:
40.7% (4)
Other race - Speak only English Native:
66.7% (524)Foreign-born:
3.0% (29)
Other race - Speak another language Native:
36.9% (290)Foreign-born:
99.7% (982)
Two or more races - Speak only English Native:
72.2% (3,043)Foreign-born:
4.4% (47)
Two or more races - Speak another language Native:
27.7% (1,169)Foreign-born:
95.7% (1,036)
White alone - Speak only English Native:
99.2% (48,401)Foreign-born:
58.1% (156)
White alone - Speak another language Native:
0.8% (368)Foreign-born:
41.6% (112)
Hispanic or Latino - Speak only English Native:
62.5% (3,171)Foreign-born:
10.8% (181)
Hispanic or Latino - Speak another language Native:
37.7% (1,915)Foreign-born:
97.0% (1,624)
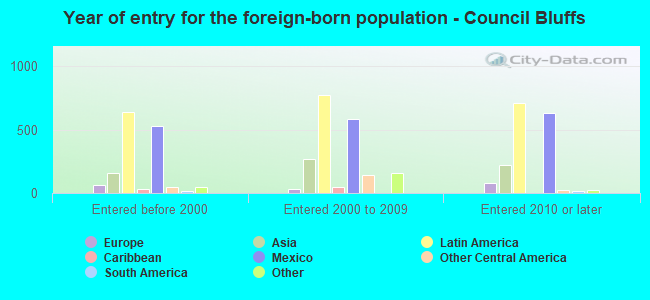
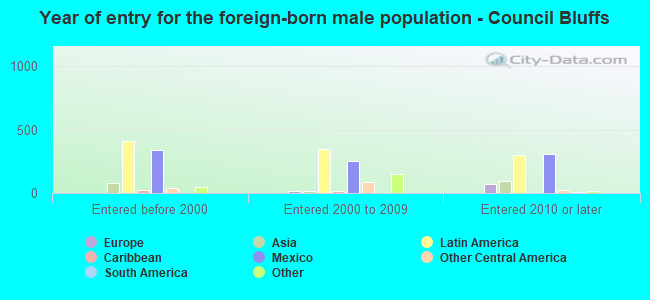
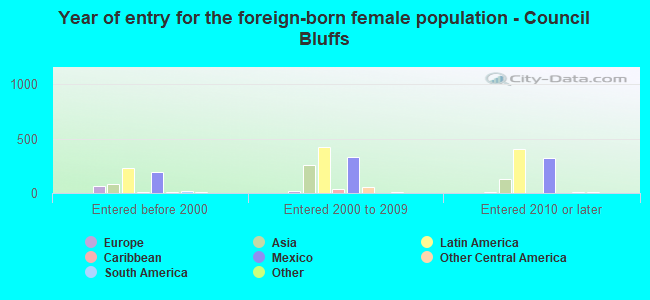
Foreign-born residents in Council Bluffs 3,190 residents are foreign born (3.2% Latin America , 1.1% Asia ).
Marital status for residents in Council Bluffs Marital status - White (Caucasian) population 15 years and over
Males 38.6% Never married44.3% Now married1.3% Separated3.2% Widowed12.6% DivorcedFemales 31.1% Never married40.0% Now married1.3% Separated10.1% Widowed17.5% DivorcedWomen who gave birth in the past 12 months Now married:
45.9% (228)Unmarried:
54.1% (269)
Women who did not give birth in the past 12 months Now married:
34.6% (4,141)Unmarried:
65.4% (7,816)
Marital status - Black or African American population 15 years and over
Males 74.4% Never married17.7% Now married0.0% Separated0.0% Widowed7.9% DivorcedFemales 53.0% Never married29.1% Now married0.0% Separated2.6% Widowed15.3% DivorcedWomen who did not give birth in the past 12 months Now married:
25.8% (59)Unmarried:
74.2% (169)
Marital status - American Indian / Alaska Native population 15 years and over
Males 36.6% Never married50.0% Now married0.0% Separated0.0% Widowed13.4% DivorcedFemales 0.0% Never married48.5% Now married0.0% Separated0.0% Widowed51.5% DivorcedWomen who did not give birth in the past 12 months Now married:
9.1% (3)Unmarried:
90.9% (31)
Marital status - Asian population 15 years and over
Males 20.5% Never married76.4% Now married0.0% Separated0.0% Widowed3.1% DivorcedFemales 11.2% Never married66.8% Now married0.9% Separated16.3% Widowed4.8% DivorcedWomen who gave birth in the past 12 months Now married:
100.0% (11)Unmarried:
0.0% (0)
Women who did not give birth in the past 12 months Now married:
83.4% (241)Unmarried:
16.6% (48)
Marital status - Native Hawaiian / Pacific Islander population 15 years and over
Males 0.0% Never married37.5% Now married0.0% Separated0.0% Widowed62.5% DivorcedFemales 0.0% Never married84.0% Now married0.0% Separated0.0% Widowed16.0% DivorcedWomen who did not give birth in the past 12 months Now married:
100.0% (16)Unmarried:
0.0% (0)
Marital status - Other race population 15 years and over
Males 47.2% Never married45.4% Now married0.0% Separated0.0% Widowed7.4% DivorcedFemales 20.7% Never married64.6% Now married3.2% Separated4.8% Widowed6.6% DivorcedWomen who did not give birth in the past 12 months Now married:
71.1% (328)Unmarried:
28.9% (133)
Marital status - Two or more races population 15 years and over
Males 57.8% Never married34.3% Now married0.0% Separated1.3% Widowed6.6% DivorcedFemales 49.8% Never married36.5% Now married1.9% Separated2.7% Widowed9.1% DivorcedWomen who gave birth in the past 12 months Now married:
0.0% (0)Unmarried:
100.0% (107)
Women who did not give birth in the past 12 months Now married:
39.5% (503)Unmarried:
60.5% (772)
Marital status - White alone, not Hispanic / Latino population 15 years and over
Males 38.4% Never married44.2% Now married1.4% Separated3.3% Widowed12.8% DivorcedFemales 29.9% Never married40.6% Now married1.3% Separated10.4% Widowed17.8% DivorcedWomen who gave birth in the past 12 months Now married:
47.5% (233)Unmarried:
52.5% (258)
Women who did not give birth in the past 12 months Now married:
35.2% (3,981)Unmarried:
64.8% (7,333)
Marital status - Hispanic or Latino population 15 years and over
Males 45.8% Never married45.8% Now married0.0% Separated0.8% Widowed7.5% DivorcedFemales 43.0% Never married42.1% Now married1.8% Separated3.1% Widowed10.0% DivorcedWomen who gave birth in the past 12 months Now married:
0.0% (0)Unmarried:
100.0% (104)
Women who did not give birth in the past 12 months Now married:
43.7% (876)Unmarried:
56.3% (1,130)
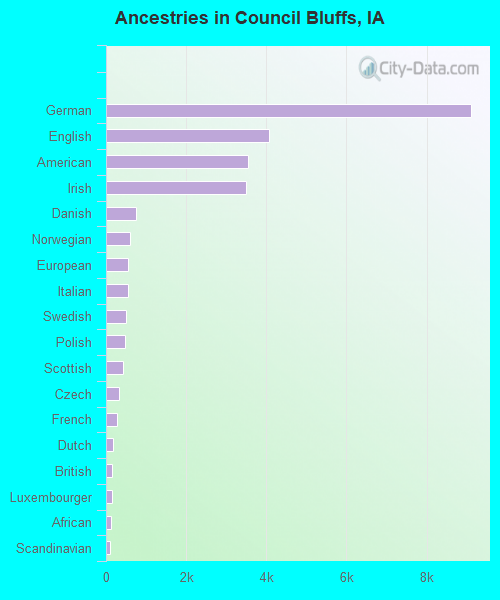
Ancestries in Council Bluffs
9,103 27.5% German4,058 12.3% English3,551 10.7% American3,506 10.6% Irish749 2.3% Danish603 1.8% Norwegian559 1.7% European537 1.6% Italian488 1.5% Swedish486 1.5% Polish432 1.3% Scottish332 1.0% Czech270 0.8% French181 0.5% Dutch155 0.5% British141 0.4% Luxembourger118 0.4% African88 0.3% Scandinavian75 0.2% Icelander54 0.2% Scotch-Irish52 0.2% Croatian46 0.1% Welsh44 0.1% Greek37 0.1% Hungarian34 0.1% Ukrainian31 0.09% Russian26 0.08% Eastern European16 0.05% Swiss15 0.05% French Canadian15 0.05% Sudanese13 0.04% Portuguese12 0.04% Romanian11 0.03% Armenian11 0.03% Iranian11 0.03% Pennsylvania German8 0.02% Estonian7 0.02% Northern European6 0.02% Moroccan3 0.01% Serbian2 0.01% Czechoslovakian
Geographical mobility in Council Bluffs Same house 1 year ago 46,544 87.9% White (Caucasian)576 56.4% Black or African American149 88.4% American Indian / Alaska Native673 93.3% Asian62 100.0% Native Hawaiian / Pacific Islander1,391 75.5% Other race4,238 78.6% Two or more races45,107 88.1% White alone, not Hispanic / Latino5,290 77.2% Hispanic or LatinoMoved within same county 3,988 7.5% White / Caucasian167 16.3% Black or African American15 8.7% American Indian / Alaska Native18 2.5% Asian281 15.3% Other race363 6.7% Two or more races3,694 7.2% White alone, not Hispanic / Latino661 9.6% Hispanic or LatinoMoved within same state 1,439 2.7% White / Caucasian97 9.4% Black or African American3 1.7% American Indian / Alaska Native8 1.2% Asian158 2.9% Two or more races1,427 2.8% White alone, not Hispanic / Latino149 2.2% Hispanic or LatinoMoved from different state 910 1.7% White / Caucasian263 25.7% Black or African American4 2.3% American Indian / Alaska Native9 1.3% Asian121 6.6% Other race323 6.0% Two or more races916 1.8% White alone, not Hispanic / Latino675 9.8% Hispanic or LatinoMoved from abroad 21 0.0% White14 1.9% Asian37 0.7% Two or more races21 0.0% White alone, not Hispanic / Latino15 0.2% Hispanic or Latino
Children Nativity (place of birth) in Council Bluffs
Children under 6 years - Living with two parents Both parents native 1,813 100.0% NativeBoth parents foreign-born 129 100.0% NativeOne native, one foreign-born parent 129 100.0% NativeChildren under 6 years - Living with one parent Native parent 1,874 100.0% NativeForeign-born parent 112 100.0% NativeChildren 6 to 17 years - Living with two parents Both parents native 3,669 94.6% Native210 5.4% Foreign-bornBoth parents foreign-born 270 79.5% Native70 20.5% Foreign-bornOne native, one foreign-born parent 329 100.0% NativeChildren 6 to 17 years - Living with one parent Native parent 3,674 100.0% NativeForeign-born parent 552 51.8% Native514 48.2% Foreign-born
Grandparents responsible for own grandchildren in Council Bluffs
Grandparents (30 to 59 years) White / Caucasian 608 67.1% Responsible for grandchildren298 32.9% Not responsible for grandchildrenOther race 6 100.0% Responsible for grandchildrenTwo or more races 7 100.0% Responsible for grandchildrenWhite alone, not Hispanic / Latino 588 66.5% Responsible for grandchildren296 33.5% Not responsible for grandchildrenHispanic or Latino 41 78.3% Responsible for grandchildren11 21.7% Not responsible for grandchildrenGrandparents (60 years and over) White / Caucasian 188 46.1% Responsible for grandchildren220 53.9% Not responsible for grandchildrenWhite alone, not Hispanic / Latino 188 46.1% Responsible for grandchildren220 53.9% Not responsible for grandchildren